SlideShare uma empresa Scribd logo
1 de 16
Baixar para ler offline


                                             Investing	in	America:		
                                        Building	an	Economy	That	Lasts	
                                                               January	2012	
  
Summary	
 
The economy has added private sector jobs for 22 straight months, a total of 3.2 million jobs over that 
period.   In  2011  alone,  nearly  2  million  private  sector  jobs  were  created,  more  than  in  any  year  since 
2005.  While the economy is moving in the right direction, we need faster economic growth to address 
the more than 8 million jobs lost from the recession and put more Americans back to work. 
 
The Administration is working to restore economic security for the middle class and rebuild an economy 
based  on  investment,  production,  and  innovation.    Creating  an  economy  built  to  last  means  that  we 
must make investments that will equip our workers to compete effectively in the global economy, today 
and tomorrow.   
 
Over the past decade, real business investment in production capacity stagnated.   Economic growth in 
the U.S. relied far too heavily on an unsustainable boom in residential and commercial real estate fueled 
by  an  unchecked  financial  sector.    The  bubble  created  by  this  boom  distorted  our  economy  and 
undercut  the  international  competitiveness  of  our  products  and  services.    Companies  increasingly 
chased  low‐cost  labor  outside  of  the  U.S.,  moving  their  manufacturing  production,  and  some  of  their 
services, like call centers and software development, abroad.     
 
     From 2001 to 2007, investment in equipment and software to make companies more productive 
         declined by 15% as a share of GDP.1   
          
     Over this same period, the U.S. manufacturing sector lost more than 3 million jobs.2  For the first 
         time in decades, real net investment in manufacturing capacity stagnated for years, even as the 
         economy expanded.3 
          
     The  U.S.  trade  deficit  grew  to  unprecedented  levels  in  the  2000s,  in  absolute  terms,  and  as  a 
         fraction of GDP.  This growth was fueled by our trade deficit in goods.  By 2006, the U.S. trade 
         deficit in goods exceeded $835 billion, greater than 6 percent of our GDP.4 


1
   Department of Commerce. Bureau of Economic Analysis. “National Income and Product Accounts, Table 1.1.5.” 
2
   Department of Labor, Bureau of Labor Statistics. “Current Employment Statistics.” 
3
   Department of Commerce, Bureau of Economic Analysis.  “Fixed Assets Accounts, Table 3.8ES.” 
                                                                                                                     1 


As the recovery has started to take hold, we have begun adding private sector jobs.  Amidst this early 
progress, we see an emerging pattern of growth that rests on a far more sustainable foundation than 
that of the past decade, but it is still in its early stages.   
 
     Real business fixed investment has begun to rebound, growing by 18% since the end of 2009.5  
         As  this  has  happened,  we  have  seen  a  shift  in  the  composition  of  investment  by  the  private 
         sector  towards  the  types  of  investments  that  expand  capacity,  help  workers  become  more 
         productive, and develop a foundation for future sustainable growth.

             The manufacturing sector has recovered faster than the rest of the economy, supporting growth 
              and job creation.  Over the past two years, the economy has added 334,000 manufacturing jobs 
              –  the  strongest  two‐year  period  of  manufacturing  job  growth  since  the  late  1990s. 6  
              Manufacturing production has surged 5.7% on an annualized basis since its low in June of 2009, 
              the fastest pace of growth of production in a decade. 7  However, we still have a long way to go 
              to recover from the more than 2 million manufacturing jobs lost in the recession.8

        The competitiveness of America's producers of goods and tradable services has improved, and 
         with it we have seen strong growth in exports.  Over the past twelve months, exports have been 
         growing  at  an  annualized  rate  of  16.1%  when  compared  with  2009,  meaning  that  America  is 
         ahead of schedule in meeting the President’s goal of doubling exports over 2009 levels by the 
         end of 2014.  As of October, American exports of goods and services over the past 12 months 
         totaled over $2 trillion, a 31.6% increase over the level in 2009.9  
          
Over  recent  months,  outside  analysts,  including  the  Boston  Consulting  Group,  Accenture,  and  Booz  & 
Company  have  examined  the  increasing  relative  attractiveness  of  the  U.S.  as  a  location  for 
manufacturing.  The Boston Consulting Group noted that “the U.S. will become an increasingly attractive 
option, especially for products consumed in North America,” as the “total cost of doing business” – after 
taking  into  account  the  productivity  of  U.S.  workers  as  well  as  transportation,  supply  chain  risks,  and 
other costs – are now making production in a range of industries as economical in the United States as in 
other parts of the world, including China.   


4
   Department of Commerce, Census Bureau and Bureau of Economic Analysis.  “U.S. International Trade in Goods 
and Services.”   
5
   Department of Commerce, Bureau of Economic Analysis.  “National Income and Product Accounts, Table 1.1.6.” 
6
   Department of Labor, Bureau of Labor Statistics.  op. cit. 
7
   Federal Reserve Board.  “G.17 Statistical Release: Industrial Production and Capacity Utilization.” 
8
   Department of Commerce, Bureau of Economic Analysis.  “National Income and Product Accounts, Table 1.1.6.” 
9
   Department of Commerce, Bureau of Economic Analysis.  “National Income and Product Accounts, Table 1.1.6.” 
                                                                                                                                                                                           2 


While these  reports have  identified  the emerging  trend of companies bringing production back  to the 
U.S.,  our  analysis,  official  data,  and  examination  of  the  behavior  of    particular  firms  support  the  view 
that investment has been growing and a new, promising trend of ‘insourcing’ is beginning to take shape.  
While ‘insourcing’ is often used to describe a company bringing activities back in‐house, we use the term 
to  refer  to  bringing  activities  and  jobs  back  to  the  U.S.  or  choosing  to  invest  in  the  U.S.  instead  of 
overseas.  We find that these jobs are coming back to the U.S. from a wide range of locations, including 
advanced industrial countries and some emerging economies. 
 
      Large  U.S.  manufacturers  like  Ford  and  Caterpillar  have  announced  major  investments  in  the 
         U.S., ‘insourcing’ jobs to the U.S. from places like Japan, Mexico, and China.   
          
      Smaller  manufacturers  across  a  range  of  industrial  and  consumer  products  are  also  making 
         decisions to return production and bring jobs back.  KEEN, a footwear design and manufacturing 
         company, has moved production to Oregon from China, and Master Lock has brought back jobs 
         to its facility in Milwaukee, Wisconsin.   
          
      Services  firms  that  sought  to  take  advantage  of  low‐cost  labor  abroad  are  re‐examining  those 
         decisions and investing in the U.S. for their operations – ranging from customer support centers 
         to  software  developers,  engineers,  and  other  high‐tech,  high‐skill  service  industries.    GalaxE 
         Solutions is ‘insourcing’ jobs to its location in Detroit, with plans to hire hundreds of IT services 
         professionals,  and  call  center  company  Novo1  has  opened  facilities  in  Michigan  and  Texas, 
         bringing back jobs to the U.S. from all over the world.  
          
      Foreign‐domiciled  firms  invest  in  the  United  States  to  take  advantage  of  a  dependable  pro‐
         growth business climate, productive workforce, and innovative culture.  The U.S. market is open 
         to  products,  ideas,  and  inward  investment  in  ways  that  few  other  countries  are. 10  
         Approximately $228 billion in FDI flowed into the United States in 2010, an increase from $153 
         billion in 2009 and the largest FDI inflow of any economy in the world by a large margin.11 
 
The analysis we have undertaken identifies economic shifts that could help propel investment in the U.S. 
and economic expansion for many years to come.  Much more must be done to ensure that our progress 
is able to take hold: 
 
      U.S.  manufacturing  has  improved  its  cost  competitiveness:  In  recent  years,  American 
         manufacturing has improved its cost competitiveness vis‐à‐vis other countries.   


10
      Council of Economic Advisers.  “U.S. Inbound Foreign Direct Investment.”  June 2011. 
11
      United Nations Conference on Trade and Development (UNCTAD). World Investment Report. Annex Table 01. 
                                                                                                                       3 


              ‐       Relative  costs  in  the  U.S.  have  improved  with  productivity  growth:  U.S.  manufacturing 
                      productivity – which has always been strong – continues to improve, rising nearly 13% since 
                      the first quarter of 2009.  Combined with an increased cost of labor elsewhere in the world, 
                      it  is  now  more  cost  competitive  to  invest  in  American  manufacturing  workers.    The  U.S. 
                      Bureau of Labor Statistics tracks manufacturing unit labor costs,  which reflect productivity 
                      changes, for a range of industrial countries, in a manner that allow for direct international 
                      comparisons.  Between 2002 and 2010, only one of the 19 countries managed to improve its 
                      unit labor cost position in manufacturing more than the U.S.12   
                       
              ‐       A  boom  in  natural  gas  production  has  supported  manufacturing:  The  surge  in  domestic 
                      natural gas production can lower energy costs, reduce pollution and drive investment in the 
                      industries that supply equipment the natural gas sector and those that use natural gas as an 
                      input  to  production,  like  the  chemical  industry.    Recent  data  from  the  Energy  Information 
                      Administration  indicate  that  by  the  end  of  2011  natural  gas  extraction  increased  by  over 
                      24% since 2006.13 
         
     High‐value  U.S.  service  sectors  have  been  able  to  take  advantage  of  an  expanded 
        marketplace:  The  increasing  tradability  of  business  services  allows  one  of  America's  most 
        productive and dynamic sectors to expand its exports, fueling jobs and investment. Services like 
        engineering, research and development, finance and software production– which typically pay 
        high wages – can now be more easily traded across countries. As a result, the United States is 
        poised  to  expand  its  trade  surplus  in  services,  which  has  already  grown  substantially,  nearly 
        tripling in size since 2003, to $146 billion in 2010. 
         
        ‐ The highly‐skilled U.S. workforce continues to be a source of advantage across the service 
             sector.    Companies  ‘insourcing’  to  the  U.S.  points  to  better  performance  in  U.S.  service 
             centers relative to many foreign locations, off‐setting the benefits of lower wages abroad. 
              
As these economic shifts occur, they have encouraged companies – both large and small – to reevaluate 
whether it makes sense to locate abroad as opposed to in the United States.  As the U.S. becomes more 
cost  competitive,  the  other  advantages  of  locating  here,    including  access  to  a  high‐skilled  workforce, 
proximity  to  customers,  reduced  cultural  and  linguistic  barriers,  the  strength  of  intellectual‐property 
protection, and access to the world’s leading research universities, are becoming increasingly important.  


12
      The BLS unit labor cost data do not track many emerging markets, but BLS hourly compensation data for 
manufacturing, which contain more complete coverage of developing countries, suggest the presence of similar 
trends. 
13
     This projection is taken from the EIA’s Short Term Energy Outlook. 
                                                                                                                           4 


Over  the  past  three  years,  the  President  has  taken  steps  to  stabilize  the  financial  system,  rescue  the 
auto industry, cut taxes for the middle class, and make investments to get Americans back to work.  The 
Administration’s policies have helped arrest the greatest financial shock since the Great Depression, get 
credit flowing more freely to businesses and consumers, and return our economy to growth within six 
months  of  the  President  taking  office  –  all  key  elements  in  making  the  U.S.  more  attractive  for 
investment in very challenging times and going forward.  In addition, the President has signed into law 
policies specifically targeted towards making it more competitive for companies to locate and invest in 
the United States, including the passage of three new Free Trade Agreements, increased aid through Pell 
Grants  and  community  colleges  to  improve  workers’  skills,  tax  incentives  to  encourage  investment  at 
home ‐ including 100% expensing and the 48C investment tax credit for advanced energy technologies ‐ 
measures  to  expand  access  to  capital  for  small  businesses,  and  investments  to  rebuild  our 
infrastructure.  But  there  is  still  more  to  be  done.  Additional  measures  to  ensure  workforce  skills  are 
aligned  with  industry  needs,  rebuild  our  infrastructure,  invest  in  the  technologies  of  the  future,  and 
reform our  corporate tax  system  to encourage  investment at home  can help  strengthen our ability  to 
attract more businesses to invest, grow, and create jobs in the U.S. 
 
 
From	Boom	to	Bubble	to	Bust:	American	Economic	Growth	in	the	1990s	
and	the	2000s	
 
The 1990s began with a recession, a slow recovery, and mounting concern about the long‐run prospects 
for  U.S.  economic  performance.  During  the  previous  decade,  U.S.  productivity  had  grown  relatively 
slowly and there was concern that American productivity growth had permanently stalled.  In the 1980s, 
business fixed investment as a share of GDP had declined, despite years of robust economic expansion.  
American  industries  faced  unprecedented  global  competition,  and  leading  experts  worried  that  the 
nation was losing its competitive edge.   
 
In  the  1990s,  however,  America's  industrial  fortunes  improved.    Export  growth  had  fallen  below  long‐
term trends in the 1980s, but it resumed historical patterns of growth in the 1990s. This was stimulated 
by  lower  relative  production  costs  and  robust  economic  growth  outside  the  United  States.14   By  the 
middle of the decade, fundamental breakthroughs in information technology appeared to be driving a 
reengineering of the American economy.  Productivity growth accelerated significantly and private fixed 
investment  as  a  fraction  of  GDP  rose  from  13.1%  in  the  first  quarter  of  1992  to  17.1%  by  the  third 
quarter  of  1999.    The  health  of  the  manufacturing  sector  improved  in  the  1990s,  and  manufacturing 
capacity expanded at the fastest rate in decades.  The boom helped drive unemployment to the lowest 


14
     This export growth is carefully documented by Bernard and Jensen (2004), "Entry, Expansion, and Intensity in 
the US Export Boom, 1987‐1992." During this period, US exports were dominated by manufactured goods. 
                                                                                                                     5 


levels  in  a  generation  while  inflation  remained  low.    Even  when  a  series  of  financial  crises  struck 
developing countries at the end of the 1990s, America's economic expansion remained robust.   
 
Recession hit again at the beginning of the 2000s.  As growth resumed, the composition of investment in 
the  U.S.  economy  was  quite  different  in  the  2000s  than  in  previous  decades.    Total  private  fixed 
investment,  which  includes  residential  investment  as  well  as  business  fixed  investment  in  equipment, 
software, and structures, rose in the 2000s about as quickly as it had in late 1990s.  However, as Figure 1 
shows  the  share  of  business  fixed  investment  in  total  private  fixed  investment  fell  dramatically, 
reflecting the decade’s unsustainable boom in residential real estate. 
 
                                               Figure 1
                        Percent       Business Fixed Investment
                       85
                                as a Share of Private Fixed Investment


                       80

                                                                              2011:Q3
                       75


                       70


                       65


                       60
                       1990:Q1                 2000:Q1                       2010:Q1
                       Source: Bureau of Economic Analysis                                         
 
 
Capacity utilization in manufacturing fell sharply during the recession of the early 2000s and recovered 
with  a  slowness  unprecedented  in  post‐war  history,  even  as  real  estate  investment  boomed.    After 
surging in the 1990s, manufacturing capacity remained stagnant for much of 2000s, as is shown in Figure 
2.    In  fact,  for  most  of  the  decade  prior  to  the  most  recent  recession,  manufacturing  investment  was 
barely sufficient to keep pace with depreciation.  As the decade stretched on, it was increasingly hard to 
deny that something fundamental had changed. 


                                                                                                                   6 


                                                                     Figure 2
                                                               Manufacturing Capacity
                                     % of 2007 Output, SA
                                    140
                                    130
                                    120
                                    110                                                 2011:Q3
                                    100
                                      90
                                      80
                                      70
                                      60
                                      50
                                      40
                                      1972:Q1 1979:Q1 1986:Q1 1993:Q1 2000:Q1 2007:Q1
                                      Source: Federal Reserve Board                                


Import	Surge	and	Manufacturing	Decline 
 
Since World War II, the manufacturing sector has declined as a share of the overall economy, whether 
measured by GDP or by employment.  However, from the late 1960s until the end of the 1990s, the level 
of  manufacturing  employment  stayed  at  approximately  18  million.    For  decades,  American 
manufacturing firms had cut jobs in recessions, but increased them during recoveries.  Over time, some 
jobs  and  output  connected  to  low‐wage,  low‐tech  products  had  disappeared  for  good,  but  American 
manufacturers  had  also  created  jobs  associated  with  more  sophisticated,  technologically  advanced 
products.    This  shift  reflected  America's  comparative  advantage  in  advanced  manufacturing,  and  it 
contributed  to  the  measured  productivity  growth  in  American  manufacturing  as  U.S.  industry 
increasingly focused on the relatively sophisticated, capital‐ and skill‐intensive activities in which it was 
relatively  more  efficient.    As  shown  in  Figure  3,  over  the  business  cycle,  job  loss  and  job  creation 
happened  at  roughly  the  same  rate,  preserving  a  fairly  stable  level  of  employment  in  manufacturing 
through the late 1990s, even as the share of manufacturing workers in the total workforce declined. 15 


15
    The stability of employment does not imply that manufacturing faced no challenges or that there were no 
worrisome trends prior to the end of the 1990s. Some of these are reviewed in the “The Competitiveness and 
Innovation Capacity of the United States,” a comprehensive report undertaken by the Department of Commerce 
and available online at http://www.commerce.gov/americacompetes. 
                                                                                                                   7 


                                                                       Figure 3
                                                               Manufacturing Employment
                                      Millions of Persons, SA                       Share of Total, Percent
                                      22                                                                35

                                       20                                                               30

                                                                                                        25
                                       18
                                                                                                        20
                                       16
                                                                                             2011:Q4    15
                                                 Manufacturing                Share of
                                       14
                                                 Employment                      Total                  10
                                                   (left axis)              Employment
                                       12                                    (right axis)               5

                                      10                                                                0
                                      1960:Q1 1970:Q1 1980:Q1 1990:Q1              2000:Q1    2010:Q1
                                      Source: Bureau of Labor Statistics                           
 
The  dramatic  decline  in  the  level  of  manufacturing  employment  after  2000  signaled  that  something 
fundamental  had  changed.  A  complete  review  of  the  challenges  and  difficulties  faced  by  American 
manufacturing  at  this  point  in  history  are  beyond  the  scope  of  this  report. 16   Instead,  the  analysis  of 
economic  events  and  their  consequences  described  below  deliberately  focuses  on  only  part  of  the 
multifaceted challenge that has confronted U.S. manufacturing in recent years.   The components of the 
challenge  we  focus  on  in  this  document  appear  to  be  improving  in  recent  years,  suggesting  the 
possibility for greater strength and improved competitiveness on the part of American manufacturers. 
 
In  the  late  1990s  as  a  series  of  financial  crises  began  to  erupt  in  emerging  markets,  starting  with  five 
major  Asian  economies  and  extending  to  Brazil  and  Russia.    As  these  countries  succumbed,  their 
currencies  depreciated  sharply  against  the  dollar.    This  shift  occurred  in  the  midst  of  a  broad 
depreciation  of  the  currencies  of  America's  advanced  country  trading  partners,  raising  the  cost  of 
production  of  American  manufacturers  relative  to  their  international  competitors.    These  shifts  were 
then  followed  by  a  domestic  recession  at  the  beginning  of  the  2000s,  creating  a  perfect  storm  for 
America's  manufacturing  sector.    The  confluence  of  adverse  circumstances  helps  explain  the  sharp 
contrast in the data between the relative mildness of the early 2000s recession and the sharp decline in 
manufacturing employment and manufacturing capacity utilization. 
 
As  the  shock  induced  by  the  Asian,  Brazilian,  and  Russian  financial  crises  was  abating,  China  took  off.  
U.S. imports of manufactures from all low wage countries surged from roughly 3 percent of U.S. trade in 


16
    Readers seeking a more comprehensive analysis are referred to The Department of Commerce report, “The 
Competitiveness and Innovation Capacity of the United States.”      
                                                                                                                        8 


1991 to about 12 percent in 2007, with China accounting for approximately 92 percent of this surge.17  
China’s growing import penetration in the U.S. market accelerated sharply after 2001.18  China’s exports 
may  have  been  elevated  by  the  country’s  exchange  rate  policies,  which  led  to  a  fundamental 
misalignment of the renminbi‐dollar exchange rate.19   
 
The	Impact	of	the	2000s	Financial	Bubble	on	Manufacturing	and	the	Real	Economy	
 
Throughout much of the 2000s, America’s trade deficit in goods widened both with respect to emerging 
market economies and with respect to some of our advanced country trading partners.  For a time, this 
widening  deficit  was  financed  by  capital  inflows  that  helped  feed  America’s  real  estate  boom.    As 
investors  around  the  world  poured  capital  into  the  U.S.  financial  sector’s  products  in  pursuit  of  high 
returns  with  low  perceived  risk,  these  capital  inflows  effectively  pushed  relative  U.S.  production  costs 
above the level that we would have seen in the absence of such strong, sustained inflows.  The resulting 
elevated  level  of  relative  production  costs  mattered.    While  U.S.  trade  in  manufactured  goods  with 
emerging  markets  grew  rapidly  in  the  2000s,  there  were  important  categories  of  goods  in  which 
domestic producers’ primary competitors tended to be based in advanced industrial countries – goods 
like  aircraft,  automobiles,  and  specialized  capital  equipment.20   The  trends  in  production  costs  limited 
America’s  attractiveness  as  a  manufacturing  location  for  these  more  sophisticated  goods  relative  to 
other advanced industrial countries, and that raised additional concerns.  Loss of manufacturing in these 
categories  could  threaten  America’s  strength  and  innovation  if  the  ability  to  innovate  is  linked  to  the 
presence of a robust manufacturing base.21 
 
 
From	Crisis	to	Recovery	and	Beyond:	Investment	and	Growth	in	the	Next	
Decade	
 
When  the  financial  bubble  of  the  2000s  finally  burst,  the  impact  on  America's  real  economy  was 
devastating.  Trillions of dollars in household wealth were lost as the stock market and the real estate 
market collapsed at roughly the same time, and households cut back sharply on consumption.  At the 
                                                            
 
17
     See David Autor, David Dorn, and Gordon Hanson (2011), “The China Syndrome:  Local Labor Market Effects of 
Import Competition,” available at http://econ.www.mit.edu/files/6613.  The set of “low wage” countries examined 
in this study includes many of the world’s poorest nations, as of 1989, but omits some of America’s middle income 
developing country trading partners. 
18
      See Autor et al. (2011). 
19
     Lardy (2011) offers a systematic analysis of China’s exchange rate intervention and its likely impact on Chinese 
trade flows, as well as the structure of the Chinese economy. 
20
     As Feldstein (2008) notes, about half of U.S. imports at this point were coming from other advanced industrial 
countries. 
21
     See the President’s Council of Advisers on Science and Technology (PCAST), “Report to the President on 
Ensuring American Leadership in Advanced Manufacturing,” released in June 2011. 
                                                                                                                    9 


peak  of  the  crisis,  financial  markets  seized  up,  and  companies  were  unable  to  finance  investment.  
Global demand collapsed, and manufacturing activity contracted sharply.   However, as the recovery has 
started  to  take  hold,  we  have  begun  to  see  an  emerging  pattern  of  growth  that  rests  on  a  far  more 
sustainable  foundation  than  the  bubble‐driven  excesses  of  the  past  decade.    Investment  and 
manufacturing  are  playing  a  more  prominent  role  during  the  first  two  years  of  America's  current 
expansion  than  they  did  at  a  similar  point  in  the  previous  recovery.    This  revival  of  investment  and 
growth in the real economy is supported by fundamental shifts that could continue to drive growth for 
years  to  come:    the  recovery  of  American  manufacturing  competitiveness,  America's  natural  resource 
boom, and the continued growth in demand for high‐skill, high‐wage tradable services. 
 
Increased	U.S.	Competitiveness	
 
U.S. workers are more productive than those of any other G‐20 economy, and U.S. productivity growth 
has been especially strong in the manufacturing sector.  However, even highly productive U.S. workers 
can  be  placed  at  a  competitive  disadvantage  due  to  low  labor  costs  abroad.22   This  disadvantage  was 
especially severe in the early years of the 2000s when the enduring effects of financial crises in many 
parts of the world depressed production costs in much of Asia, Brazil, Russia, and elsewhere. 
 
Since  then,  continued  robust  productivity  growth  in  the  U.S.,  particularly  in  the  manufacturing  sector, 
has been reinforced by a gradual realignment of many trading partner currencies.  The result has been a 
sharp  improvement  in  the  relative  unit  labor  cost  in  the  U.S.    For  example,  the  U.S.  Bureau  of  Labor 
Statistics (BLS) tracks changes over time in the unit labor cost of manufacturing in the U.S. and in key 
trading partners.  U.S. hourly compensation in manufacturing has grown over the past decade, but rapid 
productivity  growth  has  reduced  the  cost  of  producing  a  unit  of  manufactured  output  in  the  U.S.  
Meanwhile, when measured in U.S. dollars, the cost of producing a unit of manufactured output in key 
trading  partners  has  risen,  in  some  cases  substantially,  as  is  shown  in  Figure  4.    Of  the  19  countries 
tracked by the BLS, only Taiwan managed to improve its unit labor cost position more than the U.S. 23   


22
     We acknowledge that productivity growth has been even more rapid in the tradable goods sectors of some 
developing countries, such as China.  This growth usually leads to exchange rate adjustments via the well known 
“Belassa Samuelson” effect, but some trading partners, including China, have intervened in foreign exchange 
markets to limit this natural adjustment. 
23
      Chinese unit labor costs are not tracked by the BLS.  However, the BLS has tracked an index of import prices 
from China since 2003, and the most recent movements in this index suggest that Chinese unit labor costs are also 
rising. 
                                                                                                                    10 


The  impa of  Americ
                act                     ca's  improved  position  ca already  b seen  in  so
                                                                            an            be              ome  industri  ies,  like  auto an 
                                                                                                                                        os, 
industry  that  has  acco
                 t                      ounted  for  23.2  percent  of  the  increa in  manuf
                                                             2                            ase             facturing  inddustrial  produ uction 
since the  recovery beg 24  As U.S. auto deman
                                       gan.                                 nd recovers, t the Big 3 dom mestic auto c  companies an    nd the 
foreign‐do       omiciled com        mpanies have been expand              ding U.S. prod duction.  This  expansion is not only des     signed 
to serve t      the U.S. mark          ket but also to        o use their U.S. productio n sites as an  export platfo   orm from which to 
serve  oth markets  within  the  Americas  and  beyond.    Fo has  anno
               her                      w                    A                            ord            ounced  inten  ntions  to  ram up 
                                                                                                                                        mp 
investmen in  the  U.S.,  both  to  serve  the  U.S.  market  and  to  export.    R
                 nt                                                                                      Recent  annou  uncements  in   nclude 
moving its commercial F‐650 and F‐750 lines to  Ohio from M                              Mexico and co   omponents lik   ke transmission oil 
pumps fro       om China to  Michigan.  Fo                   ord’s internal studies indic cate that abo out 30 percen   nt of the value of a 
vehicle’s  content  cons                sists  of  elem      ments  like  ele
                                                                            ectronics,  sof
                                                                                          ftware,  and  intellectual  p property.    As cars 
                                                                                                                                         s 
become  a  higher‐tech product,  th may  fit  even  better  with  America’s  compara
                 a                      h                     hey                                                        ative  advantage.25  
Honda  is  seeking  to  bolster  its  pro
                                       b                      oduction  cappacity  in  Nort America  b as  much  a 40%,  and  BMW 
                                                                                          th             by             as 
already ex       xports over 7         70 percent of the vehicles that are built           t at its plant  in South Caro olina to more  e than 
100 markets around th                  he world.   
 
Of  course the  differe
                e,                      ences  in  labo costs  that remain  bet
                                                              or            t             tween  the  ad  dvanced  indu  ustrial  econo omies, 
including the U.S., on t                the one hand, and emerging markets o             on the other, s  suggest some  e limitations t  to the 
return  of  low‐tech,  lab              bor‐intensive manufacturing.    Recent  evidence  sug
                                                             e                                           ggests  that  CChina  is  starti to 
                                                                                                                                         ing 
lose  competitiveness  in  the  most labor‐inten              t            nsive  goods  t even  low
                                                                                           to           wer‐wage  eco   onomies.    Fu  urther 
                                                            
 
24
      This is large relative to the size of th
                                             he motor vehic cles and parts iindustry, which
                                                                                          h constitutes 5
                                                                                                        5.2 percent of t
                                                                                                                       the 
manufactu    uring sector. 
25
     Deloittee, an internatioonal consulting g firm, suggests
                                                            s in a 2009 studdy that the sha
                                                                                          are of auto cos
                                                                                                        sts accounted ffor by 
electronics   s will grow substantially in cooming decades. 
                                                                                                                                           11 


increases in wages and other factor costs are likely to lead to further erosion of China's advantages in 
these  kinds  of  goods.    That  said,  even  studies  that  have  suggested  the  economics  of  offshoring 
manufacturing to China are less compelling than they used to be do not predict large‐scale shifts of low 
value‐added, labor‐intensive, commodity manufacturing back to the U.S.   
 
On the other hand, the data clearly point to an improvement in America’s ability to compete across the 
range of more skill‐ and capital‐intensive products in which America has traditionally had a comparative 
advantage.  Even in recent years, the relatively small share of labor costs in total production for many of 
these  goods  has  tended  to  limit  the  role  played  by  developing  countries  in  their  manufacture  and 
exports.  The secondary role that labor costs play in these goods – which limits inroads from low wage 
countries – and the improvement of America’s competitive position vis‐à‐vis other advanced industrial 
countries  amount  to  an  important,  positive  shift  for  U.S.‐based  manufacturing.    In  addition,  natural 
disasters,  such  as  the  devastating  earthquake  and  resulting  tsunami  in  Japan,  have  heightened  the 
awareness  of  manufacturers  to  the  risks  created  by  moving  production  overseas.    Where  the  shift  in 
total unit production costs reinforces America's comparative advantage, we are likely to see continued 
growth in investment, output, and exports, suggesting that the comparative benefits of operating in the 
U.S. will grow in importance. 
 
America's	Natural	Resource	Boom	
 
Only a few years ago, fears of a looming natural gas shortage led to significant investments in the rapid 
construction of liquefied natural gas (LNG) port facilities that could enable the United States to import 
vast quantities of natural gas.  Projections from the Energy Information Administration (EIA) as recently 
as  2005  suggested  expanding  natural  gas  imports  for  decades.  Just  several  years  ago,  leaders  of  the 
domestic organic chemical industry predicted that shortages in natural gas would dramatically raise the 
domestic  price  of  natural  gas,  one  of  their  key  inputs.  Without  the  prospect  for  adequate  domestic 
supplies  of  natural  gas  at  reasonable  prices,  companies  increasingly  pointed  to  overseas  operations 
where they could access large quantities of low‐cost natural gas.  
 
Since the mid‐2000s, however, the discovery of new natural gas reserves, such as the Marcellus Shale, 
and the development of hydraulic fracturing techniques to extract natural gas from these reserves has 
led  to  rapidly  growing  domestic  production  and  relatively  low  domestic  prices  for  households  and 
downstream  industrial  users.    Appropriate  care  must  to  be  taken  to  ensure  that  America's  natural 
resources are extracted in a safe and environmentally responsible manner with the safeguards in place 
to protect public health and safety.  Provided these precautions are taken, the potential benefits to the 
U.S. economy are substantial. 


                                                                                                               12 


                                                                        Figure 5
                                                               U.S. Natural Gas Production
                                      Trillions of Cubic Feet
                                     25
                                                                                        2011
                                                                                       estimate


                                     20


                                     15
                                       1990         1995          2000              2005          2010
                                      Source: Energy Information Administration                
 
Of  the  major  fossil  fuels,  natural  gas  is  the  cleanest  and  least  carbon‐intensive  for  electric  power 
generation.    By  keeping  domestic  energy  costs  relatively  low,  this  resource  also  supports  energy 
intensive  manufacturing  in  the  United  States.    In  fact,  companies  like  Dow  Chemical  and  Westlake 
Chemical have announced intentions to make major investments in new facilities over the next several 
years.    In  addition,  firms  that  provide  equipment  for  shale  gas  production  have  announced  major 
investments in the U.S., including Vallourec’s $650 million plant for steel pipes in Ohio.   
 
An abundant local supply will translate into relatively low costs for the industries that use natural gas as 
an  input.    Expansion  in  these  industries,  including  industrial  chemicals  and  fertilizers,  will  boost 
investment  and  exports  in  the  coming  years,  generating  new  jobs.    In  the  longer  run,  the  scale  of 
America's natural gas endowment appears to be sufficiently large that  exports of natural gas to other 
major markets could be economically viable. 
     
Tradable	Services	as	a	Source	of	Jobs,	Business	Investment,	and	Exports	
 
Even  before  the  recession  hit,  business  services,  a  collection  of  industries  that  includes  engineering 
services,  research  and  development  services,  finance,  and  software  production,  employed  25%  of  the 
U.S.  workforce  at  an  average  annual  wage  of  $56,000.26   Recent  developments  in  communications 
technologies  and  the  growing  ease  and  declining  expense  of  international  travel  are  making  business 
services  increasingly  tradable  across  countries.    As  the  IT  revolution  has  made  business  services  more 
tradable, employment in the U.S. business service sector increased almost 30 percent over the decade 
                                                            
 
26
    J. Bradford Jensen provides a comprehensive overview of tradable business services and their growing role in 
world trade in his 2011 book, Global Trade in Services:  Fear, Facts, and Offshoring. 
                                                                                                                 13 


1997‐2007.    Services  exports,  as  measured  in  the  official  data,  have  expanded  dramatically,  nearly 
doubling  between  1997  and  2007,  and  now  accounting  for  nearly  30%  of  U.S.  exports.27   This  growth 
was  disproportionately  driven  by  business  services,  broadly  defined.    Imports  of  services  have  also 
expanded rapidly, but the United States has maintained a large surplus in services trade that has grown 
substantially over the course of the 2000s, nearly tripling in size since 2003 to $146 billion in 2010.   
 
Most  tradable  business  services  intensively  rely  on  highly  skilled  experts  with  which  the  U.S.  is  well 
endowed.  In other words, the growing tradability of business services plays to America’s comparative 
advantage.  Despite the media emphasis on U.S. imports of services from developing countries like India, 
most U.S. service imports come from other high‐wage, high‐skill countries, reinforcing the expectation 
that expansion of international trade in these industries is likely to benefit relatively high‐wage workers 
in  advanced  industrial  countries.    Beyond  the  return  of  services  jobs  like  call  centers  is  the  more 
economically  significant  story  of  America’s  enduring  and  growing  strength  in  advanced,  high  valued‐
added services.  These trends are likely to continue, possibly even accelerate as the IT revolution renders 
a broader range of industries services tradable and demand for America’s sophisticated services grows 
in rapidly developing emerging markets.   
 
America’s competitive strength in advanced services is driven, in part, by an effective use of information 
technology and sophisticated data analysis; the robust expansion of firms in these advanced services 
industries will spur additional investment.  The rise of business services has even started to blur the 
traditional lines separating services from manufacturing.  Within U.S. manufacturing firms, it is already 
true that more workers are providing services than actually making products.  That is likely to strengthen 
as global manufacturers increasingly seek to enhance their products through the sophisticated analysis 
of data generated by their products while in use.28  As global manufacturers seek to acquire these 
capabilities, they are finding that the world’s leading providers of these services are almost all based in 
the U.S.  
 
 
Conclusion	
 
Over the last decade, the U.S. followed a pattern of growth and investment that failed to lay the 
foundation for sustained prosperity.  In 2008, that path led to the worst economic downturn since the 
Great Depression.  The last decade and the recession we have emerged from point to the critical 
importance of ensuring an economy that is built to last.   


27
    These developments were noted by Jensen (2011). 
28
     These same global firms are likely to demand more detailed and data‐driven market research, more 
sophisticated consulting services, and more comprehensive international legal advice – all trends that will benefit 
leading U.S. exporters of these services. 
                                                                                                                  14 


We are seeing some encouraging economic signs, including 22 straight months of private sector job 
creation, a measurable improvement in the competitive position of U.S. manufacturing, and an 
expansion of our domestic natural resources that further supports business investment.  The 
composition of investment has shifted, with a focus, once again, on building the equipment and the 
plants that produce the real goods and services our people need and the world demands.  We also see 
evidence of the continued growth of America’s tradable services sector.   
 
While the emerging evidence is positive, more must be done to realize the promise that these recent 
trends offer.  From investments in our workforce and infrastructure to measures to support innovation, 
this Administration is committed to helping American workers and American companies together realize 
the potential we have documented in this report.  By taking these steps, we can create an economy that 
is built to last.   


                                                                                                    15 


References	
 
    1. Accenture. 2011. “Manufacturing’s Secret Shift: Gaining Competitive Advantage by Getting 
        Closer to the Consumer.”
         
    2. Autor, David, David Dorn, and Gordon Hanson. 2011. “The China Syndrome: Local Labor Market 
        Effects of Import Competition.” MIT Working Paper. August. 
         
    3. Bernard, Andrew B. and J. Bradford Jensen. 2004. “Entry, Expansion, and Intensity in the US 
        Export Boom, 1987‐1992.” Review of International Economics, 12 (4), 662‐675 
         
    4. Booz & Company. 2011. “Manufacturing’s Wake‐Up Call.” Fall. 
         
    5. Boston Consulting Group. 2011. “Made in America, Again: Why Manufacturing will Return to the 
        U.S.” August. 
         
    6. Council of Economic Advisers.  2011.  “U.S. Inbound Foreign Direct Investment.” June. 
         
    7. Department of Commerce. 2012. “The Competitiveness and Innovative Capacity of the United 
        States.” January. 
         
    8. Deloitte. 2009. “A New Era: Accelerating Toward 2020 – An Automotive Industry Transformed.” 
        September. 
         
    9. Energy Information Administration (EIA), Office of Oil and Gas. 2007. “U.S. Natural Gas Imports 
        and Exports: Issues and Trends 2005.” Washington, DC. 
         
    10. EIA, “Short‐Term Energy Outlook: January 2012.” Washington, DC.  
         
    11. Feldstein, Martin S. 2008. “Resolving the Global Imbalance: The Dollar and the U.S. Saving Rate.” 
        Working Paper 13952. Cambridge, MA: National Bureau of Economic Research. April. 
         
    12. Jensen, J. Bradford. 2011. Global Trade in Services:  Fear, Facts, and Offshoring. Peter G. 
        Peterson Institute for International Economics. Washington, DC. 
         
    13. Lardy, Nicholas.  2011.  Sustaining China’s Economic Growth After the Global Financial 
        Crisis.  Peterson G. Institute for International Economics.  Washington, DC. 
         
    14. President’s Council of Advisers on Science and Technology (PCAST). 2011. “Report to the 
        President on Ensuring American Leadership in Advanced Manufacturing.” June. 


                                                                                                       16 


Mais conteúdo relacionado

Mais procurados

U.S. Construction Perspective Q3 2015
U.S. Construction Perspective Q3 2015U.S. Construction Perspective Q3 2015
U.S. Construction Perspective Q3 2015JLL
 
THE IMPACT OF TRADE LIBERALIZATION ON ECONOMIC GROWTH; THE CASE OF SUB-SAHARA...
THE IMPACT OF TRADE LIBERALIZATION ON ECONOMIC GROWTH; THE CASE OF SUB-SAHARA...THE IMPACT OF TRADE LIBERALIZATION ON ECONOMIC GROWTH; THE CASE OF SUB-SAHARA...
THE IMPACT OF TRADE LIBERALIZATION ON ECONOMIC GROWTH; THE CASE OF SUB-SAHARA...AkashSharma618775
 
Effect of international trade on economic growth in kenya
Effect of international trade on economic growth in kenyaEffect of international trade on economic growth in kenya
Effect of international trade on economic growth in kenyaAlexander Decker
 
Economic Research Initative Issue #6 Findings and Conclusions
Economic Research Initative Issue #6 Findings and ConclusionsEconomic Research Initative Issue #6 Findings and Conclusions
Economic Research Initative Issue #6 Findings and ConclusionsLuis Nieves-Ruiz
 
Microeconomics Essay Draft
Microeconomics Essay Draft Microeconomics Essay Draft
Microeconomics Essay Draft Declan Boyle
 
Jobs report sep13
Jobs report sep13Jobs report sep13
Jobs report sep13staceyjj
 
Mercer Capital's Value Focus: Auto Dealer Industry | Year-End 2015
Mercer Capital's Value Focus: Auto Dealer Industry | Year-End 2015Mercer Capital's Value Focus: Auto Dealer Industry | Year-End 2015
Mercer Capital's Value Focus: Auto Dealer Industry | Year-End 2015Mercer Capital
 
Japanese Investment in the United States
Japanese Investment in the United StatesJapanese Investment in the United States
Japanese Investment in the United Statesgccrowe
 
North america industrial forecast 2014 2017
North america industrial forecast 2014 2017North america industrial forecast 2014 2017
North america industrial forecast 2014 2017Guy Masse
 
2015 san diego and national economic update july 24 2015
2015 san diego and national economic update july 24 20152015 san diego and national economic update july 24 2015
2015 san diego and national economic update july 24 2015Evan Donaldson
 
The Future of U.S. Manufacturing: A Change Manifesto
The Future of U.S. Manufacturing: A Change ManifestoThe Future of U.S. Manufacturing: A Change Manifesto
The Future of U.S. Manufacturing: A Change ManifestoCognizant
 
Econ214 Macroeconomics Chapters 1 & 2
Econ214 Macroeconomics Chapters 1 & 2Econ214 Macroeconomics Chapters 1 & 2
Econ214 Macroeconomics Chapters 1 & 2BHUOnlineDepartment
 
2. understanding the environments of business - itb - ayesha aman - Economics
2. understanding the environments of business - itb - ayesha aman - Economics2. understanding the environments of business - itb - ayesha aman - Economics
2. understanding the environments of business - itb - ayesha aman - EconomicsAmaan Hussain
 
Construction industry in kenya
Construction industry in kenyaConstruction industry in kenya
Construction industry in kenyaLinson Kolanchery
 
Economic and Business Commentary By Sean Lannan 9-3-10
Economic and Business Commentary By Sean Lannan 9-3-10Economic and Business Commentary By Sean Lannan 9-3-10
Economic and Business Commentary By Sean Lannan 9-3-10seantl
 
Articles
ArticlesArticles
ArticlesSHK
 

Mais procurados (20)

U.S. Construction Perspective Q3 2015
U.S. Construction Perspective Q3 2015U.S. Construction Perspective Q3 2015
U.S. Construction Perspective Q3 2015
 
National 1Q15
National 1Q15National 1Q15
National 1Q15
 
THE IMPACT OF TRADE LIBERALIZATION ON ECONOMIC GROWTH; THE CASE OF SUB-SAHARA...
THE IMPACT OF TRADE LIBERALIZATION ON ECONOMIC GROWTH; THE CASE OF SUB-SAHARA...THE IMPACT OF TRADE LIBERALIZATION ON ECONOMIC GROWTH; THE CASE OF SUB-SAHARA...
THE IMPACT OF TRADE LIBERALIZATION ON ECONOMIC GROWTH; THE CASE OF SUB-SAHARA...
 
Effect of international trade on economic growth in kenya
Effect of international trade on economic growth in kenyaEffect of international trade on economic growth in kenya
Effect of international trade on economic growth in kenya
 
Economic Research Initative Issue #6 Findings and Conclusions
Economic Research Initative Issue #6 Findings and ConclusionsEconomic Research Initative Issue #6 Findings and Conclusions
Economic Research Initative Issue #6 Findings and Conclusions
 
Microeconomics Essay Draft
Microeconomics Essay Draft Microeconomics Essay Draft
Microeconomics Essay Draft
 
Jobs report sep13
Jobs report sep13Jobs report sep13
Jobs report sep13
 
Mercer Capital's Value Focus: Auto Dealer Industry | Year-End 2015
Mercer Capital's Value Focus: Auto Dealer Industry | Year-End 2015Mercer Capital's Value Focus: Auto Dealer Industry | Year-End 2015
Mercer Capital's Value Focus: Auto Dealer Industry | Year-End 2015
 
April en lvrec
April en lvrecApril en lvrec
April en lvrec
 
Japanese Investment in the United States
Japanese Investment in the United StatesJapanese Investment in the United States
Japanese Investment in the United States
 
North america industrial forecast 2014 2017
North america industrial forecast 2014 2017North america industrial forecast 2014 2017
North america industrial forecast 2014 2017
 
2015 san diego and national economic update july 24 2015
2015 san diego and national economic update july 24 20152015 san diego and national economic update july 24 2015
2015 san diego and national economic update july 24 2015
 
The Future of U.S. Manufacturing: A Change Manifesto
The Future of U.S. Manufacturing: A Change ManifestoThe Future of U.S. Manufacturing: A Change Manifesto
The Future of U.S. Manufacturing: A Change Manifesto
 
Econ214 Macroeconomics Chapters 1 & 2
Econ214 Macroeconomics Chapters 1 & 2Econ214 Macroeconomics Chapters 1 & 2
Econ214 Macroeconomics Chapters 1 & 2
 
Final Report
Final ReportFinal Report
Final Report
 
Japanese economy globalisation
Japanese economy globalisationJapanese economy globalisation
Japanese economy globalisation
 
2. understanding the environments of business - itb - ayesha aman - Economics
2. understanding the environments of business - itb - ayesha aman - Economics2. understanding the environments of business - itb - ayesha aman - Economics
2. understanding the environments of business - itb - ayesha aman - Economics
 
Construction industry in kenya
Construction industry in kenyaConstruction industry in kenya
Construction industry in kenya
 
Economic and Business Commentary By Sean Lannan 9-3-10
Economic and Business Commentary By Sean Lannan 9-3-10Economic and Business Commentary By Sean Lannan 9-3-10
Economic and Business Commentary By Sean Lannan 9-3-10
 
Articles
ArticlesArticles
Articles
 

Semelhante a Investing in America: Building an Economy that Lasts

Understanding the US-China Trade Relationship
Understanding the US-China Trade Relationship Understanding the US-China Trade Relationship
Understanding the US-China Trade Relationship Peachy Essay
 
Report: Revitalizing American Manufacturing
Report: Revitalizing American ManufacturingReport: Revitalizing American Manufacturing
Report: Revitalizing American ManufacturingMarcellus Drilling News
 
A detailed study to evaluate the financial impact of demanding made in usa pr...
A detailed study to evaluate the financial impact of demanding made in usa pr...A detailed study to evaluate the financial impact of demanding made in usa pr...
A detailed study to evaluate the financial impact of demanding made in usa pr...Charm Rammandala
 
Dr Dev Kambhampati | What is "Made in America"?
Dr Dev Kambhampati | What is "Made in America"?Dr Dev Kambhampati | What is "Made in America"?
Dr Dev Kambhampati | What is "Made in America"?Dr Dev Kambhampati
 
Ch 12 presentation
Ch 12 presentationCh 12 presentation
Ch 12 presentationkrobinette
 
The rise of the chinese economy and implications for the united states
The rise of  the chinese economy and implications for the united statesThe rise of  the chinese economy and implications for the united states
The rise of the chinese economy and implications for the united statesAbeer Ansari
 
Mr. Wood Block 1 slideshow
Mr. Wood Block 1 slideshowMr. Wood Block 1 slideshow
Mr. Wood Block 1 slideshowdoritrenter
 
Fritz Meyer Sample Presentation
Fritz Meyer Sample PresentationFritz Meyer Sample Presentation
Fritz Meyer Sample PresentationAdvisors4Advisors
 
Outlook For Commodities
Outlook For CommoditiesOutlook For Commodities
Outlook For CommoditiesRusNewton
 
China economic growth.pptx
China economic growth.pptxChina economic growth.pptx
China economic growth.pptxDianeJohn1
 
Market-Insight_Chinese Manufacturings Low-Cost Run
Market-Insight_Chinese Manufacturings Low-Cost RunMarket-Insight_Chinese Manufacturings Low-Cost Run
Market-Insight_Chinese Manufacturings Low-Cost RunTevia Arnold
 
DCR Trendline December 2013 – Contingent Worker Forecast and Supply Report
DCR Trendline December 2013 – Contingent Worker Forecast and Supply ReportDCR Trendline December 2013 – Contingent Worker Forecast and Supply Report
DCR Trendline December 2013 – Contingent Worker Forecast and Supply Reportss
 
Fritzmeyersamplepresentation 110217102619-phpapp01
Fritzmeyersamplepresentation 110217102619-phpapp01Fritzmeyersamplepresentation 110217102619-phpapp01
Fritzmeyersamplepresentation 110217102619-phpapp01Rod Tyler
 
Venture Impact 2011 Report
Venture Impact 2011 ReportVenture Impact 2011 Report
Venture Impact 2011 ReportMaxwell Wessel
 
Are markets in Australia and overseas becoming more concentrated, and is that...
Are markets in Australia and overseas becoming more concentrated, and is that...Are markets in Australia and overseas becoming more concentrated, and is that...
Are markets in Australia and overseas becoming more concentrated, and is that...Nick Twort
 
PwC Global Economy watch (mars 2014)
PwC Global Economy watch (mars 2014)PwC Global Economy watch (mars 2014)
PwC Global Economy watch (mars 2014)PwC France
 

Semelhante a Investing in America: Building an Economy that Lasts (20)

Understanding the US-China Trade Relationship
Understanding the US-China Trade Relationship Understanding the US-China Trade Relationship
Understanding the US-China Trade Relationship
 
Report: Revitalizing American Manufacturing
Report: Revitalizing American ManufacturingReport: Revitalizing American Manufacturing
Report: Revitalizing American Manufacturing
 
A detailed study to evaluate the financial impact of demanding made in usa pr...
A detailed study to evaluate the financial impact of demanding made in usa pr...A detailed study to evaluate the financial impact of demanding made in usa pr...
A detailed study to evaluate the financial impact of demanding made in usa pr...
 
Dr Dev Kambhampati | What is "Made in America"?
Dr Dev Kambhampati | What is "Made in America"?Dr Dev Kambhampati | What is "Made in America"?
Dr Dev Kambhampati | What is "Made in America"?
 
Neil M BCA Dissertation
Neil M BCA DissertationNeil M BCA Dissertation
Neil M BCA Dissertation
 
Manufacturing Renaissance
Manufacturing RenaissanceManufacturing Renaissance
Manufacturing Renaissance
 
Ch 12 presentation
Ch 12 presentationCh 12 presentation
Ch 12 presentation
 
Usa economy
Usa economyUsa economy
Usa economy
 
The rise of the chinese economy and implications for the united states
The rise of  the chinese economy and implications for the united statesThe rise of  the chinese economy and implications for the united states
The rise of the chinese economy and implications for the united states
 
Mr. Wood Block 1 slideshow
Mr. Wood Block 1 slideshowMr. Wood Block 1 slideshow
Mr. Wood Block 1 slideshow
 
Fritz Meyer Sample Presentation
Fritz Meyer Sample PresentationFritz Meyer Sample Presentation
Fritz Meyer Sample Presentation
 
Outlook For Commodities
Outlook For CommoditiesOutlook For Commodities
Outlook For Commodities
 
Balsiger Final Paper 2008-12
Balsiger Final Paper 2008-12Balsiger Final Paper 2008-12
Balsiger Final Paper 2008-12
 
China economic growth.pptx
China economic growth.pptxChina economic growth.pptx
China economic growth.pptx
 
Market-Insight_Chinese Manufacturings Low-Cost Run
Market-Insight_Chinese Manufacturings Low-Cost RunMarket-Insight_Chinese Manufacturings Low-Cost Run
Market-Insight_Chinese Manufacturings Low-Cost Run
 
DCR Trendline December 2013 – Contingent Worker Forecast and Supply Report
DCR Trendline December 2013 – Contingent Worker Forecast and Supply ReportDCR Trendline December 2013 – Contingent Worker Forecast and Supply Report
DCR Trendline December 2013 – Contingent Worker Forecast and Supply Report
 
Fritzmeyersamplepresentation 110217102619-phpapp01
Fritzmeyersamplepresentation 110217102619-phpapp01Fritzmeyersamplepresentation 110217102619-phpapp01
Fritzmeyersamplepresentation 110217102619-phpapp01
 
Venture Impact 2011 Report
Venture Impact 2011 ReportVenture Impact 2011 Report
Venture Impact 2011 Report
 
Are markets in Australia and overseas becoming more concentrated, and is that...
Are markets in Australia and overseas becoming more concentrated, and is that...Are markets in Australia and overseas becoming more concentrated, and is that...
Are markets in Australia and overseas becoming more concentrated, and is that...
 
PwC Global Economy watch (mars 2014)
PwC Global Economy watch (mars 2014)PwC Global Economy watch (mars 2014)
PwC Global Economy watch (mars 2014)
 

Mais de Marcellus Drilling News

Five facts about shale: it’s coming back, and coming back strong
Five facts about shale: it’s coming back, and coming back strongFive facts about shale: it’s coming back, and coming back strong
Five facts about shale: it’s coming back, and coming back strongMarcellus Drilling News
 
Quarterly legislative action update: Marcellus and Utica shale region (4Q16)
Quarterly legislative action update: Marcellus and Utica shale region (4Q16)Quarterly legislative action update: Marcellus and Utica shale region (4Q16)
Quarterly legislative action update: Marcellus and Utica shale region (4Q16)Marcellus Drilling News
 
Access Northeast Pipeline Project - Dec 2016 Update
Access Northeast Pipeline Project - Dec 2016 UpdateAccess Northeast Pipeline Project - Dec 2016 Update
Access Northeast Pipeline Project - Dec 2016 UpdateMarcellus Drilling News
 
Rover Pipeline Letter to FERC Requesting Final Certificate
Rover Pipeline Letter to FERC Requesting Final CertificateRover Pipeline Letter to FERC Requesting Final Certificate
Rover Pipeline Letter to FERC Requesting Final CertificateMarcellus Drilling News
 
DOE Order Granting Elba Island LNG Right to Export to Non-FTA Countries
DOE Order Granting Elba Island LNG Right to Export to Non-FTA CountriesDOE Order Granting Elba Island LNG Right to Export to Non-FTA Countries
DOE Order Granting Elba Island LNG Right to Export to Non-FTA CountriesMarcellus Drilling News
 
LSE Study: Fracking is Revitalizing U.S. Manufacturing
LSE Study: Fracking is Revitalizing U.S. ManufacturingLSE Study: Fracking is Revitalizing U.S. Manufacturing
LSE Study: Fracking is Revitalizing U.S. ManufacturingMarcellus Drilling News
 
Letter From 24 States Asking Trump & Congress to Withdraw the Unlawful Clean ...
Letter From 24 States Asking Trump & Congress to Withdraw the Unlawful Clean ...Letter From 24 States Asking Trump & Congress to Withdraw the Unlawful Clean ...
Letter From 24 States Asking Trump & Congress to Withdraw the Unlawful Clean ...Marcellus Drilling News
 
Report: New U.S. Power Costs: by County, with Environmental Externalities
Report: New U.S. Power Costs: by County, with Environmental ExternalitiesReport: New U.S. Power Costs: by County, with Environmental Externalities
Report: New U.S. Power Costs: by County, with Environmental ExternalitiesMarcellus Drilling News
 
U.S. Crude Oil and Natural Gas Proved Reserves, Year-end 2015
U.S. Crude Oil and Natural Gas Proved Reserves, Year-end 2015U.S. Crude Oil and Natural Gas Proved Reserves, Year-end 2015
U.S. Crude Oil and Natural Gas Proved Reserves, Year-end 2015Marcellus Drilling News
 
U.S. EIA's Drilling Productivity Report - December 2015
U.S. EIA's Drilling Productivity Report - December 2015U.S. EIA's Drilling Productivity Report - December 2015
U.S. EIA's Drilling Productivity Report - December 2015Marcellus Drilling News
 
Velocys Plan to "Build the Business" - Gas-to-Liquids Plants
Velocys Plan to "Build the Business" - Gas-to-Liquids PlantsVelocys Plan to "Build the Business" - Gas-to-Liquids Plants
Velocys Plan to "Build the Business" - Gas-to-Liquids PlantsMarcellus Drilling News
 
PA DEP Revised Permit for Natural Gas Compression Stations, Processing Plants...
PA DEP Revised Permit for Natural Gas Compression Stations, Processing Plants...PA DEP Revised Permit for Natural Gas Compression Stations, Processing Plants...
PA DEP Revised Permit for Natural Gas Compression Stations, Processing Plants...Marcellus Drilling News
 
PA DEP Permit for Unconventional NatGas Well Site Operations and Remote Piggi...
PA DEP Permit for Unconventional NatGas Well Site Operations and Remote Piggi...PA DEP Permit for Unconventional NatGas Well Site Operations and Remote Piggi...
PA DEP Permit for Unconventional NatGas Well Site Operations and Remote Piggi...Marcellus Drilling News
 
PA DEP: Methane Reduction Strategies for Natural Gas Operations
PA DEP: Methane Reduction Strategies for Natural Gas OperationsPA DEP: Methane Reduction Strategies for Natural Gas Operations
PA DEP: Methane Reduction Strategies for Natural Gas OperationsMarcellus Drilling News
 
US EIA's December 2016 Short-Term Energy Outlook
US EIA's December 2016 Short-Term Energy OutlookUS EIA's December 2016 Short-Term Energy Outlook
US EIA's December 2016 Short-Term Energy OutlookMarcellus Drilling News
 
Northeast Gas Association's 2016 Statistical Guide
Northeast Gas Association's 2016 Statistical GuideNortheast Gas Association's 2016 Statistical Guide
Northeast Gas Association's 2016 Statistical GuideMarcellus Drilling News
 
PA PUC Responses to Auditor General's Act 13 Impact Fee Audit
PA PUC Responses to Auditor General's Act 13 Impact Fee AuditPA PUC Responses to Auditor General's Act 13 Impact Fee Audit
PA PUC Responses to Auditor General's Act 13 Impact Fee AuditMarcellus Drilling News
 
Pennsylvania Public Utility Commission Act 13/Impact Fees Audit by PA Auditor...
Pennsylvania Public Utility Commission Act 13/Impact Fees Audit by PA Auditor...Pennsylvania Public Utility Commission Act 13/Impact Fees Audit by PA Auditor...
Pennsylvania Public Utility Commission Act 13/Impact Fees Audit by PA Auditor...Marcellus Drilling News
 
Clyde Mine Discharge/Tenmile Creek Water Quality Final Report
Clyde Mine Discharge/Tenmile Creek Water Quality Final ReportClyde Mine Discharge/Tenmile Creek Water Quality Final Report
Clyde Mine Discharge/Tenmile Creek Water Quality Final ReportMarcellus Drilling News
 
FERC Order Denying Stay of Kinder Morgan's Broad Run Expansion Project
FERC Order Denying Stay of Kinder Morgan's Broad Run Expansion ProjectFERC Order Denying Stay of Kinder Morgan's Broad Run Expansion Project
FERC Order Denying Stay of Kinder Morgan's Broad Run Expansion ProjectMarcellus Drilling News
 

Mais de Marcellus Drilling News (20)

Five facts about shale: it’s coming back, and coming back strong
Five facts about shale: it’s coming back, and coming back strongFive facts about shale: it’s coming back, and coming back strong
Five facts about shale: it’s coming back, and coming back strong
 
Quarterly legislative action update: Marcellus and Utica shale region (4Q16)
Quarterly legislative action update: Marcellus and Utica shale region (4Q16)Quarterly legislative action update: Marcellus and Utica shale region (4Q16)
Quarterly legislative action update: Marcellus and Utica shale region (4Q16)
 
Access Northeast Pipeline Project - Dec 2016 Update
Access Northeast Pipeline Project - Dec 2016 UpdateAccess Northeast Pipeline Project - Dec 2016 Update
Access Northeast Pipeline Project - Dec 2016 Update
 
Rover Pipeline Letter to FERC Requesting Final Certificate
Rover Pipeline Letter to FERC Requesting Final CertificateRover Pipeline Letter to FERC Requesting Final Certificate
Rover Pipeline Letter to FERC Requesting Final Certificate
 
DOE Order Granting Elba Island LNG Right to Export to Non-FTA Countries
DOE Order Granting Elba Island LNG Right to Export to Non-FTA CountriesDOE Order Granting Elba Island LNG Right to Export to Non-FTA Countries
DOE Order Granting Elba Island LNG Right to Export to Non-FTA Countries
 
LSE Study: Fracking is Revitalizing U.S. Manufacturing
LSE Study: Fracking is Revitalizing U.S. ManufacturingLSE Study: Fracking is Revitalizing U.S. Manufacturing
LSE Study: Fracking is Revitalizing U.S. Manufacturing
 
Letter From 24 States Asking Trump & Congress to Withdraw the Unlawful Clean ...
Letter From 24 States Asking Trump & Congress to Withdraw the Unlawful Clean ...Letter From 24 States Asking Trump & Congress to Withdraw the Unlawful Clean ...
Letter From 24 States Asking Trump & Congress to Withdraw the Unlawful Clean ...
 
Report: New U.S. Power Costs: by County, with Environmental Externalities
Report: New U.S. Power Costs: by County, with Environmental ExternalitiesReport: New U.S. Power Costs: by County, with Environmental Externalities
Report: New U.S. Power Costs: by County, with Environmental Externalities
 
U.S. Crude Oil and Natural Gas Proved Reserves, Year-end 2015
U.S. Crude Oil and Natural Gas Proved Reserves, Year-end 2015U.S. Crude Oil and Natural Gas Proved Reserves, Year-end 2015
U.S. Crude Oil and Natural Gas Proved Reserves, Year-end 2015
 
U.S. EIA's Drilling Productivity Report - December 2015
U.S. EIA's Drilling Productivity Report - December 2015U.S. EIA's Drilling Productivity Report - December 2015
U.S. EIA's Drilling Productivity Report - December 2015
 
Velocys Plan to "Build the Business" - Gas-to-Liquids Plants
Velocys Plan to "Build the Business" - Gas-to-Liquids PlantsVelocys Plan to "Build the Business" - Gas-to-Liquids Plants
Velocys Plan to "Build the Business" - Gas-to-Liquids Plants
 
PA DEP Revised Permit for Natural Gas Compression Stations, Processing Plants...
PA DEP Revised Permit for Natural Gas Compression Stations, Processing Plants...PA DEP Revised Permit for Natural Gas Compression Stations, Processing Plants...
PA DEP Revised Permit for Natural Gas Compression Stations, Processing Plants...
 
PA DEP Permit for Unconventional NatGas Well Site Operations and Remote Piggi...
PA DEP Permit for Unconventional NatGas Well Site Operations and Remote Piggi...PA DEP Permit for Unconventional NatGas Well Site Operations and Remote Piggi...
PA DEP Permit for Unconventional NatGas Well Site Operations and Remote Piggi...
 
PA DEP: Methane Reduction Strategies for Natural Gas Operations
PA DEP: Methane Reduction Strategies for Natural Gas OperationsPA DEP: Methane Reduction Strategies for Natural Gas Operations
PA DEP: Methane Reduction Strategies for Natural Gas Operations
 
US EIA's December 2016 Short-Term Energy Outlook
US EIA's December 2016 Short-Term Energy OutlookUS EIA's December 2016 Short-Term Energy Outlook
US EIA's December 2016 Short-Term Energy Outlook
 
Northeast Gas Association's 2016 Statistical Guide
Northeast Gas Association's 2016 Statistical GuideNortheast Gas Association's 2016 Statistical Guide
Northeast Gas Association's 2016 Statistical Guide
 
PA PUC Responses to Auditor General's Act 13 Impact Fee Audit
PA PUC Responses to Auditor General's Act 13 Impact Fee AuditPA PUC Responses to Auditor General's Act 13 Impact Fee Audit
PA PUC Responses to Auditor General's Act 13 Impact Fee Audit
 
Pennsylvania Public Utility Commission Act 13/Impact Fees Audit by PA Auditor...
Pennsylvania Public Utility Commission Act 13/Impact Fees Audit by PA Auditor...Pennsylvania Public Utility Commission Act 13/Impact Fees Audit by PA Auditor...
Pennsylvania Public Utility Commission Act 13/Impact Fees Audit by PA Auditor...
 
Clyde Mine Discharge/Tenmile Creek Water Quality Final Report
Clyde Mine Discharge/Tenmile Creek Water Quality Final ReportClyde Mine Discharge/Tenmile Creek Water Quality Final Report
Clyde Mine Discharge/Tenmile Creek Water Quality Final Report
 
FERC Order Denying Stay of Kinder Morgan's Broad Run Expansion Project
FERC Order Denying Stay of Kinder Morgan's Broad Run Expansion ProjectFERC Order Denying Stay of Kinder Morgan's Broad Run Expansion Project
FERC Order Denying Stay of Kinder Morgan's Broad Run Expansion Project
 

Último

Foreign Relation of Pakistan with Neighboring Countries.pptx
Foreign Relation of Pakistan with Neighboring Countries.pptxForeign Relation of Pakistan with Neighboring Countries.pptx
Foreign Relation of Pakistan with Neighboring Countries.pptxunark75
 
Power in International Relations (Pol 5)
Power in International Relations (Pol 5)Power in International Relations (Pol 5)
Power in International Relations (Pol 5)ssuser583c35
 
lok sabha Elections in india- 2024 .pptx
lok sabha Elections in india- 2024 .pptxlok sabha Elections in india- 2024 .pptx
lok sabha Elections in india- 2024 .pptxdigiyvbmrkt
 
Transforming Andhra Pradesh: TDP's Legacy in Road Connectivity
Transforming Andhra Pradesh: TDP's Legacy in Road ConnectivityTransforming Andhra Pradesh: TDP's Legacy in Road Connectivity
Transforming Andhra Pradesh: TDP's Legacy in Road Connectivitynarsireddynannuri1
 
12042024_First India Newspaper Jaipur.pdf
12042024_First India Newspaper Jaipur.pdf12042024_First India Newspaper Jaipur.pdf
12042024_First India Newspaper Jaipur.pdfFIRST INDIA
 
Mitochondrial Fusion Vital for Adult Brain Function and Disease Understanding...
Mitochondrial Fusion Vital for Adult Brain Function and Disease Understanding...Mitochondrial Fusion Vital for Adult Brain Function and Disease Understanding...
Mitochondrial Fusion Vital for Adult Brain Function and Disease Understanding...The Lifesciences Magazine
 
Emerging issues in migration policies.ppt
Emerging issues in migration policies.pptEmerging issues in migration policies.ppt
Emerging issues in migration policies.pptNandinituteja1
 
Geostrategic significance of South Asian countries.ppt
Geostrategic significance of South Asian countries.pptGeostrategic significance of South Asian countries.ppt
Geostrategic significance of South Asian countries.pptUsmanKaran
 
Political-Ideologies-and-The-Movements.pptx
Political-Ideologies-and-The-Movements.pptxPolitical-Ideologies-and-The-Movements.pptx
Political-Ideologies-and-The-Movements.pptxSasikiranMarri
 
15042024_First India Newspaper Jaipur.pdf
15042024_First India Newspaper Jaipur.pdf15042024_First India Newspaper Jaipur.pdf
15042024_First India Newspaper Jaipur.pdfFIRST INDIA
 
11042024_First India Newspaper Jaipur.pdf
11042024_First India Newspaper Jaipur.pdf11042024_First India Newspaper Jaipur.pdf
11042024_First India Newspaper Jaipur.pdfFIRST INDIA
 
13042024_First India Newspaper Jaipur.pdf
13042024_First India Newspaper Jaipur.pdf13042024_First India Newspaper Jaipur.pdf
13042024_First India Newspaper Jaipur.pdfFIRST INDIA
 
14042024_First India Newspaper Jaipur.pdf
14042024_First India Newspaper Jaipur.pdf14042024_First India Newspaper Jaipur.pdf
14042024_First India Newspaper Jaipur.pdfFIRST INDIA
 
16042024_First India Newspaper Jaipur.pdf
16042024_First India Newspaper Jaipur.pdf16042024_First India Newspaper Jaipur.pdf
16042024_First India Newspaper Jaipur.pdfFIRST INDIA
 

Último (14)

Foreign Relation of Pakistan with Neighboring Countries.pptx
Foreign Relation of Pakistan with Neighboring Countries.pptxForeign Relation of Pakistan with Neighboring Countries.pptx
Foreign Relation of Pakistan with Neighboring Countries.pptx
 
Power in International Relations (Pol 5)
Power in International Relations (Pol 5)Power in International Relations (Pol 5)
Power in International Relations (Pol 5)
 
lok sabha Elections in india- 2024 .pptx
lok sabha Elections in india- 2024 .pptxlok sabha Elections in india- 2024 .pptx
lok sabha Elections in india- 2024 .pptx
 
Transforming Andhra Pradesh: TDP's Legacy in Road Connectivity
Transforming Andhra Pradesh: TDP's Legacy in Road ConnectivityTransforming Andhra Pradesh: TDP's Legacy in Road Connectivity
Transforming Andhra Pradesh: TDP's Legacy in Road Connectivity
 
12042024_First India Newspaper Jaipur.pdf
12042024_First India Newspaper Jaipur.pdf12042024_First India Newspaper Jaipur.pdf
12042024_First India Newspaper Jaipur.pdf
 
Mitochondrial Fusion Vital for Adult Brain Function and Disease Understanding...
Mitochondrial Fusion Vital for Adult Brain Function and Disease Understanding...Mitochondrial Fusion Vital for Adult Brain Function and Disease Understanding...
Mitochondrial Fusion Vital for Adult Brain Function and Disease Understanding...
 
Emerging issues in migration policies.ppt
Emerging issues in migration policies.pptEmerging issues in migration policies.ppt
Emerging issues in migration policies.ppt
 
Geostrategic significance of South Asian countries.ppt
Geostrategic significance of South Asian countries.pptGeostrategic significance of South Asian countries.ppt
Geostrategic significance of South Asian countries.ppt
 
Political-Ideologies-and-The-Movements.pptx
Political-Ideologies-and-The-Movements.pptxPolitical-Ideologies-and-The-Movements.pptx
Political-Ideologies-and-The-Movements.pptx
 
15042024_First India Newspaper Jaipur.pdf
15042024_First India Newspaper Jaipur.pdf15042024_First India Newspaper Jaipur.pdf
15042024_First India Newspaper Jaipur.pdf
 
11042024_First India Newspaper Jaipur.pdf
11042024_First India Newspaper Jaipur.pdf11042024_First India Newspaper Jaipur.pdf
11042024_First India Newspaper Jaipur.pdf
 
13042024_First India Newspaper Jaipur.pdf
13042024_First India Newspaper Jaipur.pdf13042024_First India Newspaper Jaipur.pdf
13042024_First India Newspaper Jaipur.pdf
 
14042024_First India Newspaper Jaipur.pdf
14042024_First India Newspaper Jaipur.pdf14042024_First India Newspaper Jaipur.pdf
14042024_First India Newspaper Jaipur.pdf
 
16042024_First India Newspaper Jaipur.pdf
16042024_First India Newspaper Jaipur.pdf16042024_First India Newspaper Jaipur.pdf
16042024_First India Newspaper Jaipur.pdf
 

Investing in America: Building an Economy that Lasts

  • 1.     Investing in America: Building an Economy That Lasts January 2012    Summary   The economy has added private sector jobs for 22 straight months, a total of 3.2 million jobs over that  period.   In  2011  alone,  nearly  2  million  private  sector  jobs  were  created,  more  than  in  any  year  since  2005.  While the economy is moving in the right direction, we need faster economic growth to address  the more than 8 million jobs lost from the recession and put more Americans back to work.    The Administration is working to restore economic security for the middle class and rebuild an economy  based  on  investment,  production,  and  innovation.    Creating  an  economy  built  to  last  means  that  we  must make investments that will equip our workers to compete effectively in the global economy, today  and tomorrow.      Over the past decade, real business investment in production capacity stagnated.   Economic growth in  the U.S. relied far too heavily on an unsustainable boom in residential and commercial real estate fueled  by  an  unchecked  financial  sector.    The  bubble  created  by  this  boom  distorted  our  economy  and  undercut  the  international  competitiveness  of  our  products  and  services.    Companies  increasingly  chased  low‐cost  labor  outside  of  the  U.S.,  moving  their  manufacturing  production,  and  some  of  their  services, like call centers and software development, abroad.         From 2001 to 2007, investment in equipment and software to make companies more productive  declined by 15% as a share of GDP.1       Over this same period, the U.S. manufacturing sector lost more than 3 million jobs.2  For the first  time in decades, real net investment in manufacturing capacity stagnated for years, even as the  economy expanded.3     The  U.S.  trade  deficit  grew  to  unprecedented  levels  in  the  2000s,  in  absolute  terms,  and  as  a  fraction of GDP.  This growth was fueled by our trade deficit in goods.  By 2006, the U.S. trade  deficit in goods exceeded $835 billion, greater than 6 percent of our GDP.4                                                                 1  Department of Commerce. Bureau of Economic Analysis. “National Income and Product Accounts, Table 1.1.5.”  2  Department of Labor, Bureau of Labor Statistics. “Current Employment Statistics.”  3  Department of Commerce, Bureau of Economic Analysis.  “Fixed Assets Accounts, Table 3.8ES.”  1     
  • 2.       As the recovery has started to take hold, we have begun adding private sector jobs.  Amidst this early  progress, we see an emerging pattern of growth that rests on a far more sustainable foundation than  that of the past decade, but it is still in its early stages.       Real business fixed investment has begun to rebound, growing by 18% since the end of 2009.5   As  this  has  happened,  we  have  seen  a  shift  in  the  composition  of  investment  by  the  private  sector  towards  the  types  of  investments  that  expand  capacity,  help  workers  become  more  productive, and develop a foundation for future sustainable growth.  The manufacturing sector has recovered faster than the rest of the economy, supporting growth  and job creation.  Over the past two years, the economy has added 334,000 manufacturing jobs  –  the  strongest  two‐year  period  of  manufacturing  job  growth  since  the  late  1990s. 6   Manufacturing production has surged 5.7% on an annualized basis since its low in June of 2009,  the fastest pace of growth of production in a decade. 7  However, we still have a long way to go  to recover from the more than 2 million manufacturing jobs lost in the recession.8  The competitiveness of America's producers of goods and tradable services has improved, and  with it we have seen strong growth in exports.  Over the past twelve months, exports have been  growing  at  an  annualized  rate  of  16.1%  when  compared  with  2009,  meaning  that  America  is  ahead of schedule in meeting the President’s goal of doubling exports over 2009 levels by the  end of 2014.  As of October, American exports of goods and services over the past 12 months  totaled over $2 trillion, a 31.6% increase over the level in 2009.9     Over  recent  months,  outside  analysts,  including  the  Boston  Consulting  Group,  Accenture,  and  Booz  &  Company  have  examined  the  increasing  relative  attractiveness  of  the  U.S.  as  a  location  for  manufacturing.  The Boston Consulting Group noted that “the U.S. will become an increasingly attractive  option, especially for products consumed in North America,” as the “total cost of doing business” – after  taking  into  account  the  productivity  of  U.S.  workers  as  well  as  transportation,  supply  chain  risks,  and  other costs – are now making production in a range of industries as economical in the United States as in  other parts of the world, including China.                                                                                                                                                                                                          4  Department of Commerce, Census Bureau and Bureau of Economic Analysis.  “U.S. International Trade in Goods  and Services.”    5  Department of Commerce, Bureau of Economic Analysis.  “National Income and Product Accounts, Table 1.1.6.”  6  Department of Labor, Bureau of Labor Statistics.  op. cit.  7  Federal Reserve Board.  “G.17 Statistical Release: Industrial Production and Capacity Utilization.”  8  Department of Commerce, Bureau of Economic Analysis.  “National Income and Product Accounts, Table 1.1.6.”  9  Department of Commerce, Bureau of Economic Analysis.  “National Income and Product Accounts, Table 1.1.6.”  2     
  • 3.     While these  reports have  identified  the emerging  trend of companies bringing production back  to the  U.S.,  our  analysis,  official  data,  and  examination  of  the  behavior  of    particular  firms  support  the  view  that investment has been growing and a new, promising trend of ‘insourcing’ is beginning to take shape.   While ‘insourcing’ is often used to describe a company bringing activities back in‐house, we use the term  to  refer  to  bringing  activities  and  jobs  back  to  the  U.S.  or  choosing  to  invest  in  the  U.S.  instead  of  overseas.  We find that these jobs are coming back to the U.S. from a wide range of locations, including  advanced industrial countries and some emerging economies.     Large  U.S.  manufacturers  like  Ford  and  Caterpillar  have  announced  major  investments  in  the  U.S., ‘insourcing’ jobs to the U.S. from places like Japan, Mexico, and China.       Smaller  manufacturers  across  a  range  of  industrial  and  consumer  products  are  also  making  decisions to return production and bring jobs back.  KEEN, a footwear design and manufacturing  company, has moved production to Oregon from China, and Master Lock has brought back jobs  to its facility in Milwaukee, Wisconsin.       Services  firms  that  sought  to  take  advantage  of  low‐cost  labor  abroad  are  re‐examining  those  decisions and investing in the U.S. for their operations – ranging from customer support centers  to  software  developers,  engineers,  and  other  high‐tech,  high‐skill  service  industries.    GalaxE  Solutions is ‘insourcing’ jobs to its location in Detroit, with plans to hire hundreds of IT services  professionals,  and  call  center  company  Novo1  has  opened  facilities  in  Michigan  and  Texas,  bringing back jobs to the U.S. from all over the world.      Foreign‐domiciled  firms  invest  in  the  United  States  to  take  advantage  of  a  dependable  pro‐ growth business climate, productive workforce, and innovative culture.  The U.S. market is open  to  products,  ideas,  and  inward  investment  in  ways  that  few  other  countries  are. 10   Approximately $228 billion in FDI flowed into the United States in 2010, an increase from $153  billion in 2009 and the largest FDI inflow of any economy in the world by a large margin.11    The analysis we have undertaken identifies economic shifts that could help propel investment in the U.S.  and economic expansion for many years to come.  Much more must be done to ensure that our progress  is able to take hold:     U.S.  manufacturing  has  improved  its  cost  competitiveness:  In  recent  years,  American  manufacturing has improved its cost competitiveness vis‐à‐vis other countries.                                                                     10  Council of Economic Advisers.  “U.S. Inbound Foreign Direct Investment.”  June 2011.  11  United Nations Conference on Trade and Development (UNCTAD). World Investment Report. Annex Table 01.  3     
  • 4.     ‐ Relative  costs  in  the  U.S.  have  improved  with  productivity  growth:  U.S.  manufacturing  productivity – which has always been strong – continues to improve, rising nearly 13% since  the first quarter of 2009.  Combined with an increased cost of labor elsewhere in the world,  it  is  now  more  cost  competitive  to  invest  in  American  manufacturing  workers.    The  U.S.  Bureau of Labor Statistics tracks manufacturing unit labor costs,  which reflect productivity  changes, for a range of industrial countries, in a manner that allow for direct international  comparisons.  Between 2002 and 2010, only one of the 19 countries managed to improve its  unit labor cost position in manufacturing more than the U.S.12      ‐ A  boom  in  natural  gas  production  has  supported  manufacturing:  The  surge  in  domestic  natural gas production can lower energy costs, reduce pollution and drive investment in the  industries that supply equipment the natural gas sector and those that use natural gas as an  input  to  production,  like  the  chemical  industry.    Recent  data  from  the  Energy  Information  Administration  indicate  that  by  the  end  of  2011  natural  gas  extraction  increased  by  over  24% since 2006.13     High‐value  U.S.  service  sectors  have  been  able  to  take  advantage  of  an  expanded  marketplace:  The  increasing  tradability  of  business  services  allows  one  of  America's  most  productive and dynamic sectors to expand its exports, fueling jobs and investment. Services like  engineering, research and development, finance and software production– which typically pay  high wages – can now be more easily traded across countries. As a result, the United States is  poised  to  expand  its  trade  surplus  in  services,  which  has  already  grown  substantially,  nearly  tripling in size since 2003, to $146 billion in 2010.    ‐ The highly‐skilled U.S. workforce continues to be a source of advantage across the service  sector.    Companies  ‘insourcing’  to  the  U.S.  points  to  better  performance  in  U.S.  service  centers relative to many foreign locations, off‐setting the benefits of lower wages abroad.    As these economic shifts occur, they have encouraged companies – both large and small – to reevaluate  whether it makes sense to locate abroad as opposed to in the United States.  As the U.S. becomes more  cost  competitive,  the  other  advantages  of  locating  here,    including  access  to  a  high‐skilled  workforce,  proximity  to  customers,  reduced  cultural  and  linguistic  barriers,  the  strength  of  intellectual‐property  protection, and access to the world’s leading research universities, are becoming increasingly important.                                                                    12    The BLS unit labor cost data do not track many emerging markets, but BLS hourly compensation data for  manufacturing, which contain more complete coverage of developing countries, suggest the presence of similar  trends.  13   This projection is taken from the EIA’s Short Term Energy Outlook.  4     
  • 5.     Over  the  past  three  years,  the  President  has  taken  steps  to  stabilize  the  financial  system,  rescue  the  auto industry, cut taxes for the middle class, and make investments to get Americans back to work.  The  Administration’s policies have helped arrest the greatest financial shock since the Great Depression, get  credit flowing more freely to businesses and consumers, and return our economy to growth within six  months  of  the  President  taking  office  –  all  key  elements  in  making  the  U.S.  more  attractive  for  investment in very challenging times and going forward.  In addition, the President has signed into law  policies specifically targeted towards making it more competitive for companies to locate and invest in  the United States, including the passage of three new Free Trade Agreements, increased aid through Pell  Grants  and  community  colleges  to  improve  workers’  skills,  tax  incentives  to  encourage  investment  at  home ‐ including 100% expensing and the 48C investment tax credit for advanced energy technologies ‐  measures  to  expand  access  to  capital  for  small  businesses,  and  investments  to  rebuild  our  infrastructure.  But  there  is  still  more  to  be  done.  Additional  measures  to  ensure  workforce  skills  are  aligned  with  industry  needs,  rebuild  our  infrastructure,  invest  in  the  technologies  of  the  future,  and  reform our  corporate tax  system  to encourage  investment at home  can help  strengthen our ability  to  attract more businesses to invest, grow, and create jobs in the U.S.      From Boom to Bubble to Bust: American Economic Growth in the 1990s and the 2000s   The 1990s began with a recession, a slow recovery, and mounting concern about the long‐run prospects  for  U.S.  economic  performance.  During  the  previous  decade,  U.S.  productivity  had  grown  relatively  slowly and there was concern that American productivity growth had permanently stalled.  In the 1980s,  business fixed investment as a share of GDP had declined, despite years of robust economic expansion.   American  industries  faced  unprecedented  global  competition,  and  leading  experts  worried  that  the  nation was losing its competitive edge.      In  the  1990s,  however,  America's  industrial  fortunes  improved.    Export  growth  had  fallen  below  long‐ term trends in the 1980s, but it resumed historical patterns of growth in the 1990s. This was stimulated  by  lower  relative  production  costs  and  robust  economic  growth  outside  the  United  States.14   By  the  middle of the decade, fundamental breakthroughs in information technology appeared to be driving a  reengineering of the American economy.  Productivity growth accelerated significantly and private fixed  investment  as  a  fraction  of  GDP  rose  from  13.1%  in  the  first  quarter  of  1992  to  17.1%  by  the  third  quarter  of  1999.    The  health  of  the  manufacturing  sector  improved  in  the  1990s,  and  manufacturing  capacity expanded at the fastest rate in decades.  The boom helped drive unemployment to the lowest                                                                 14    This export growth is carefully documented by Bernard and Jensen (2004), "Entry, Expansion, and Intensity in  the US Export Boom, 1987‐1992." During this period, US exports were dominated by manufactured goods.  5     
  • 6.     levels  in  a  generation  while  inflation  remained  low.    Even  when  a  series  of  financial  crises  struck  developing countries at the end of the 1990s, America's economic expansion remained robust.      Recession hit again at the beginning of the 2000s.  As growth resumed, the composition of investment in  the  U.S.  economy  was  quite  different  in  the  2000s  than  in  previous  decades.    Total  private  fixed  investment,  which  includes  residential  investment  as  well  as  business  fixed  investment  in  equipment,  software, and structures, rose in the 2000s about as quickly as it had in late 1990s.  However, as Figure 1  shows  the  share  of  business  fixed  investment  in  total  private  fixed  investment  fell  dramatically,  reflecting the decade’s unsustainable boom in residential real estate.    Figure 1 Percent Business Fixed Investment 85 as a Share of Private Fixed Investment 80 2011:Q3 75 70 65 60 1990:Q1 2000:Q1 2010:Q1 Source: Bureau of Economic Analysis       Capacity utilization in manufacturing fell sharply during the recession of the early 2000s and recovered  with  a  slowness  unprecedented  in  post‐war  history,  even  as  real  estate  investment  boomed.    After  surging in the 1990s, manufacturing capacity remained stagnant for much of 2000s, as is shown in Figure  2.    In  fact,  for  most  of  the  decade  prior  to  the  most  recent  recession,  manufacturing  investment  was  barely sufficient to keep pace with depreciation.  As the decade stretched on, it was increasingly hard to  deny that something fundamental had changed.      6     
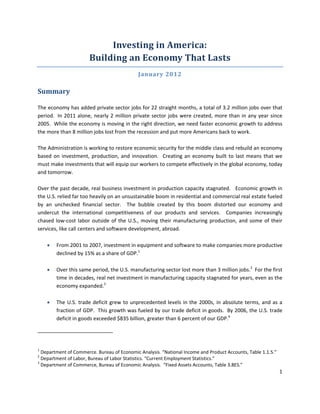
  • 7.     Figure 2 Manufacturing Capacity % of 2007 Output, SA 140 130 120 110 2011:Q3 100 90 80 70 60 50 40 1972:Q1 1979:Q1 1986:Q1 1993:Q1 2000:Q1 2007:Q1 Source: Federal Reserve Board       Import Surge and Manufacturing Decline    Since World War II, the manufacturing sector has declined as a share of the overall economy, whether  measured by GDP or by employment.  However, from the late 1960s until the end of the 1990s, the level  of  manufacturing  employment  stayed  at  approximately  18  million.    For  decades,  American  manufacturing firms had cut jobs in recessions, but increased them during recoveries.  Over time, some  jobs  and  output  connected  to  low‐wage,  low‐tech  products  had  disappeared  for  good,  but  American  manufacturers  had  also  created  jobs  associated  with  more  sophisticated,  technologically  advanced  products.    This  shift  reflected  America's  comparative  advantage  in  advanced  manufacturing,  and  it  contributed  to  the  measured  productivity  growth  in  American  manufacturing  as  U.S.  industry  increasingly focused on the relatively sophisticated, capital‐ and skill‐intensive activities in which it was  relatively  more  efficient.    As  shown  in  Figure  3,  over  the  business  cycle,  job  loss  and  job  creation  happened  at  roughly  the  same  rate,  preserving  a  fairly  stable  level  of  employment  in  manufacturing  through the late 1990s, even as the share of manufacturing workers in the total workforce declined. 15                                                                   15   The stability of employment does not imply that manufacturing faced no challenges or that there were no  worrisome trends prior to the end of the 1990s. Some of these are reviewed in the “The Competitiveness and  Innovation Capacity of the United States,” a comprehensive report undertaken by the Department of Commerce  and available online at http://www.commerce.gov/americacompetes.  7     
  • 8.     Figure 3 Manufacturing Employment Millions of Persons, SA Share of Total, Percent 22 35 20 30 25 18 20 16 2011:Q4 15 Manufacturing Share of 14 Employment Total 10 (left axis) Employment 12 (right axis) 5 10 0 1960:Q1 1970:Q1 1980:Q1 1990:Q1 2000:Q1 2010:Q1 Source: Bureau of Labor Statistics     The  dramatic  decline  in  the  level  of  manufacturing  employment  after  2000  signaled  that  something  fundamental  had  changed.  A  complete  review  of  the  challenges  and  difficulties  faced  by  American  manufacturing  at  this  point  in  history  are  beyond  the  scope  of  this  report. 16   Instead,  the  analysis  of  economic  events  and  their  consequences  described  below  deliberately  focuses  on  only  part  of  the  multifaceted challenge that has confronted U.S. manufacturing in recent years.   The components of the  challenge  we  focus  on  in  this  document  appear  to  be  improving  in  recent  years,  suggesting  the  possibility for greater strength and improved competitiveness on the part of American manufacturers.    In  the  late  1990s  as  a  series  of  financial  crises  began  to  erupt  in  emerging  markets,  starting  with  five  major  Asian  economies  and  extending  to  Brazil  and  Russia.    As  these  countries  succumbed,  their  currencies  depreciated  sharply  against  the  dollar.    This  shift  occurred  in  the  midst  of  a  broad  depreciation  of  the  currencies  of  America's  advanced  country  trading  partners,  raising  the  cost  of  production  of  American  manufacturers  relative  to  their  international  competitors.    These  shifts  were  then  followed  by  a  domestic  recession  at  the  beginning  of  the  2000s,  creating  a  perfect  storm  for  America's  manufacturing  sector.    The  confluence  of  adverse  circumstances  helps  explain  the  sharp  contrast in the data between the relative mildness of the early 2000s recession and the sharp decline in  manufacturing employment and manufacturing capacity utilization.    As  the  shock  induced  by  the  Asian,  Brazilian,  and  Russian  financial  crises  was  abating,  China  took  off.   U.S. imports of manufactures from all low wage countries surged from roughly 3 percent of U.S. trade in                                                                 16    Readers seeking a more comprehensive analysis are referred to The Department of Commerce report, “The  Competitiveness and Innovation Capacity of the United States.”       8     
  • 9.     1991 to about 12 percent in 2007, with China accounting for approximately 92 percent of this surge.17   China’s growing import penetration in the U.S. market accelerated sharply after 2001.18  China’s exports  may  have  been  elevated  by  the  country’s  exchange  rate  policies,  which  led  to  a  fundamental  misalignment of the renminbi‐dollar exchange rate.19      The Impact of the 2000s Financial Bubble on Manufacturing and the Real Economy   Throughout much of the 2000s, America’s trade deficit in goods widened both with respect to emerging  market economies and with respect to some of our advanced country trading partners.  For a time, this  widening  deficit  was  financed  by  capital  inflows  that  helped  feed  America’s  real  estate  boom.    As  investors  around  the  world  poured  capital  into  the  U.S.  financial  sector’s  products  in  pursuit  of  high  returns  with  low  perceived  risk,  these  capital  inflows  effectively  pushed  relative  U.S.  production  costs  above the level that we would have seen in the absence of such strong, sustained inflows.  The resulting  elevated  level  of  relative  production  costs  mattered.    While  U.S.  trade  in  manufactured  goods  with  emerging  markets  grew  rapidly  in  the  2000s,  there  were  important  categories  of  goods  in  which  domestic producers’ primary competitors tended to be based in advanced industrial countries – goods  like  aircraft,  automobiles,  and  specialized  capital  equipment.20   The  trends  in  production  costs  limited  America’s  attractiveness  as  a  manufacturing  location  for  these  more  sophisticated  goods  relative  to  other advanced industrial countries, and that raised additional concerns.  Loss of manufacturing in these  categories  could  threaten  America’s  strength  and  innovation  if  the  ability  to  innovate  is  linked  to  the  presence of a robust manufacturing base.21      From Crisis to Recovery and Beyond: Investment and Growth in the Next Decade   When  the  financial  bubble  of  the  2000s  finally  burst,  the  impact  on  America's  real  economy  was  devastating.  Trillions of dollars in household wealth were lost as the stock market and the real estate  market collapsed at roughly the same time, and households cut back sharply on consumption.  At the                                                                 17   See David Autor, David Dorn, and Gordon Hanson (2011), “The China Syndrome:  Local Labor Market Effects of  Import Competition,” available at http://econ.www.mit.edu/files/6613.  The set of “low wage” countries examined  in this study includes many of the world’s poorest nations, as of 1989, but omits some of America’s middle income  developing country trading partners.  18    See Autor et al. (2011).  19   Lardy (2011) offers a systematic analysis of China’s exchange rate intervention and its likely impact on Chinese  trade flows, as well as the structure of the Chinese economy.  20   As Feldstein (2008) notes, about half of U.S. imports at this point were coming from other advanced industrial  countries.  21   See the President’s Council of Advisers on Science and Technology (PCAST), “Report to the President on  Ensuring American Leadership in Advanced Manufacturing,” released in June 2011.  9     
  • 10.     peak  of  the  crisis,  financial  markets  seized  up,  and  companies  were  unable  to  finance  investment.   Global demand collapsed, and manufacturing activity contracted sharply.   However, as the recovery has  started  to  take  hold,  we  have  begun  to  see  an  emerging  pattern  of  growth  that  rests  on  a  far  more  sustainable  foundation  than  the  bubble‐driven  excesses  of  the  past  decade.    Investment  and  manufacturing  are  playing  a  more  prominent  role  during  the  first  two  years  of  America's  current  expansion  than  they  did  at  a  similar  point  in  the  previous  recovery.    This  revival  of  investment  and  growth in the real economy is supported by fundamental shifts that could continue to drive growth for  years  to  come:    the  recovery  of  American  manufacturing  competitiveness,  America's  natural  resource  boom, and the continued growth in demand for high‐skill, high‐wage tradable services.    Increased U.S. Competitiveness   U.S. workers are more productive than those of any other G‐20 economy, and U.S. productivity growth  has been especially strong in the manufacturing sector.  However, even highly productive U.S. workers  can  be  placed  at  a  competitive  disadvantage  due  to  low  labor  costs  abroad.22   This  disadvantage  was  especially severe in the early years of the 2000s when the enduring effects of financial crises in many  parts of the world depressed production costs in much of Asia, Brazil, Russia, and elsewhere.    Since  then,  continued  robust  productivity  growth  in  the  U.S.,  particularly  in  the  manufacturing  sector,  has been reinforced by a gradual realignment of many trading partner currencies.  The result has been a  sharp  improvement  in  the  relative  unit  labor  cost  in  the  U.S.    For  example,  the  U.S.  Bureau  of  Labor  Statistics (BLS) tracks changes over time in the unit labor cost of manufacturing in the U.S. and in key  trading partners.  U.S. hourly compensation in manufacturing has grown over the past decade, but rapid  productivity  growth  has  reduced  the  cost  of  producing  a  unit  of  manufactured  output  in  the  U.S.   Meanwhile, when measured in U.S. dollars, the cost of producing a unit of manufactured output in key  trading  partners  has  risen,  in  some  cases  substantially,  as  is  shown  in  Figure  4.    Of  the  19  countries  tracked by the BLS, only Taiwan managed to improve its unit labor cost position more than the U.S. 23                                                                   22   We acknowledge that productivity growth has been even more rapid in the tradable goods sectors of some  developing countries, such as China.  This growth usually leads to exchange rate adjustments via the well known  “Belassa Samuelson” effect, but some trading partners, including China, have intervened in foreign exchange  markets to limit this natural adjustment.  23    Chinese unit labor costs are not tracked by the BLS.  However, the BLS has tracked an index of import prices  from China since 2003, and the most recent movements in this index suggest that Chinese unit labor costs are also  rising.  10     
  • 11.           The  impa of  Americ act  ca's  improved  position  ca already  b seen  in  so an  be  ome  industri ies,  like  auto an  os,  industry  that  has  acco t ounted  for  23.2  percent  of  the  increa in  manuf 2 ase  facturing  inddustrial  produ uction  since the  recovery beg 24  As U.S. auto deman gan. nd recovers, t the Big 3 dom mestic auto c companies an nd the  foreign‐do omiciled com mpanies have been expand ding U.S. prod duction.  This  expansion is not only des signed  to serve t the U.S. mark ket but also to o use their U.S. productio n sites as an  export platfo orm from which to  serve  oth markets  within  the  Americas  and  beyond.    Fo has  anno her  w A ord  ounced  inten ntions  to  ram up  mp  investmen in  the  U.S.,  both  to  serve  the  U.S.  market  and  to  export.    R nt  Recent  annou uncements  in nclude  moving its commercial F‐650 and F‐750 lines to  Ohio from M Mexico and co omponents lik ke transmission oil  pumps fro om China to  Michigan.  Fo ord’s internal studies indic cate that abo out 30 percen nt of the value of a  vehicle’s  content  cons sists  of  elem ments  like  ele ectronics,  sof ftware,  and  intellectual  p property.    As cars  s  become  a  higher‐tech product,  th may  fit  even  better  with  America’s  compara a h  hey  ative  advantage.25   Honda  is  seeking  to  bolster  its  pro b oduction  cappacity  in  Nort America  b as  much  a 40%,  and  BMW  th  by  as  already ex xports over 7 70 percent of the vehicles that are built t at its plant  in South Caro olina to more e than  100 markets around th he world.      Of  course the  differe e,  ences  in  labo costs  that remain  bet or  t  tween  the  ad dvanced  indu ustrial  econo omies,  including the U.S., on t the one hand, and emerging markets o on the other, s suggest some e limitations t to the  return  of  low‐tech,  lab bor‐intensive manufacturing.    Recent  evidence  sug e  ggests  that  CChina  is  starti to  ing  lose  competitiveness  in  the  most labor‐inten t  nsive  goods  t even  low to  wer‐wage  eco onomies.    Fu urther                                                                 24    This is large relative to the size of th he motor vehic cles and parts iindustry, which h constitutes 5 5.2 percent of t the  manufactu uring sector.  25   Deloittee, an internatioonal consulting g firm, suggests s in a 2009 studdy that the sha are of auto cos sts accounted ffor by  electronics s will grow substantially in cooming decades.  11     
  • 12.     increases in wages and other factor costs are likely to lead to further erosion of China's advantages in  these  kinds  of  goods.    That  said,  even  studies  that  have  suggested  the  economics  of  offshoring  manufacturing to China are less compelling than they used to be do not predict large‐scale shifts of low  value‐added, labor‐intensive, commodity manufacturing back to the U.S.      On the other hand, the data clearly point to an improvement in America’s ability to compete across the  range of more skill‐ and capital‐intensive products in which America has traditionally had a comparative  advantage.  Even in recent years, the relatively small share of labor costs in total production for many of  these  goods  has  tended  to  limit  the  role  played  by  developing  countries  in  their  manufacture  and  exports.  The secondary role that labor costs play in these goods – which limits inroads from low wage  countries – and the improvement of America’s competitive position vis‐à‐vis other advanced industrial  countries  amount  to  an  important,  positive  shift  for  U.S.‐based  manufacturing.    In  addition,  natural  disasters,  such  as  the  devastating  earthquake  and  resulting  tsunami  in  Japan,  have  heightened  the  awareness  of  manufacturers  to  the  risks  created  by  moving  production  overseas.    Where  the  shift  in  total unit production costs reinforces America's comparative advantage, we are likely to see continued  growth in investment, output, and exports, suggesting that the comparative benefits of operating in the  U.S. will grow in importance.    America's Natural Resource Boom   Only a few years ago, fears of a looming natural gas shortage led to significant investments in the rapid  construction of liquefied natural gas (LNG) port facilities that could enable the United States to import  vast quantities of natural gas.  Projections from the Energy Information Administration (EIA) as recently  as  2005  suggested  expanding  natural  gas  imports  for  decades.  Just  several  years  ago,  leaders  of  the  domestic organic chemical industry predicted that shortages in natural gas would dramatically raise the  domestic  price  of  natural  gas,  one  of  their  key  inputs.  Without  the  prospect  for  adequate  domestic  supplies  of  natural  gas  at  reasonable  prices,  companies  increasingly  pointed  to  overseas  operations  where they could access large quantities of low‐cost natural gas.     Since the mid‐2000s, however, the discovery of new natural gas reserves, such as the Marcellus Shale,  and the development of hydraulic fracturing techniques to extract natural gas from these reserves has  led  to  rapidly  growing  domestic  production  and  relatively  low  domestic  prices  for  households  and  downstream  industrial  users.    Appropriate  care  must  to  be  taken  to  ensure  that  America's  natural  resources are extracted in a safe and environmentally responsible manner with the safeguards in place  to protect public health and safety.  Provided these precautions are taken, the potential benefits to the  U.S. economy are substantial.        12     
  • 13.     Figure 5 U.S. Natural Gas Production Trillions of Cubic Feet 25 2011 estimate 20 15 1990 1995 2000 2005 2010 Source: Energy Information Administration     Of  the  major  fossil  fuels,  natural  gas  is  the  cleanest  and  least  carbon‐intensive  for  electric  power  generation.    By  keeping  domestic  energy  costs  relatively  low,  this  resource  also  supports  energy  intensive  manufacturing  in  the  United  States.    In  fact,  companies  like  Dow  Chemical  and  Westlake  Chemical have announced intentions to make major investments in new facilities over the next several  years.    In  addition,  firms  that  provide  equipment  for  shale  gas  production  have  announced  major  investments in the U.S., including Vallourec’s $650 million plant for steel pipes in Ohio.      An abundant local supply will translate into relatively low costs for the industries that use natural gas as  an  input.    Expansion  in  these  industries,  including  industrial  chemicals  and  fertilizers,  will  boost  investment  and  exports  in  the  coming  years,  generating  new  jobs.    In  the  longer  run,  the  scale  of  America's natural gas endowment appears to be sufficiently large that  exports of natural gas to other  major markets could be economically viable.        Tradable Services as a Source of Jobs, Business Investment, and Exports   Even  before  the  recession  hit,  business  services,  a  collection  of  industries  that  includes  engineering  services,  research  and  development  services,  finance,  and  software  production,  employed  25%  of  the  U.S.  workforce  at  an  average  annual  wage  of  $56,000.26   Recent  developments  in  communications  technologies  and  the  growing  ease  and  declining  expense  of  international  travel  are  making  business  services  increasingly  tradable  across  countries.    As  the  IT  revolution  has  made  business  services  more  tradable, employment in the U.S. business service sector increased almost 30 percent over the decade                                                                 26    J. Bradford Jensen provides a comprehensive overview of tradable business services and their growing role in  world trade in his 2011 book, Global Trade in Services:  Fear, Facts, and Offshoring.  13     
  • 14.     1997‐2007.    Services  exports,  as  measured  in  the  official  data,  have  expanded  dramatically,  nearly  doubling  between  1997  and  2007,  and  now  accounting  for  nearly  30%  of  U.S.  exports.27   This  growth  was  disproportionately  driven  by  business  services,  broadly  defined.    Imports  of  services  have  also  expanded rapidly, but the United States has maintained a large surplus in services trade that has grown  substantially over the course of the 2000s, nearly tripling in size since 2003 to $146 billion in 2010.      Most  tradable  business  services  intensively  rely  on  highly  skilled  experts  with  which  the  U.S.  is  well  endowed.  In other words, the growing tradability of business services plays to America’s comparative  advantage.  Despite the media emphasis on U.S. imports of services from developing countries like India,  most U.S. service imports come from other high‐wage, high‐skill countries, reinforcing the expectation  that expansion of international trade in these industries is likely to benefit relatively high‐wage workers  in  advanced  industrial  countries.    Beyond  the  return  of  services  jobs  like  call  centers  is  the  more  economically  significant  story  of  America’s  enduring  and  growing  strength  in  advanced,  high  valued‐ added services.  These trends are likely to continue, possibly even accelerate as the IT revolution renders  a broader range of industries services tradable and demand for America’s sophisticated services grows  in rapidly developing emerging markets.      America’s competitive strength in advanced services is driven, in part, by an effective use of information  technology and sophisticated data analysis; the robust expansion of firms in these advanced services  industries will spur additional investment.  The rise of business services has even started to blur the  traditional lines separating services from manufacturing.  Within U.S. manufacturing firms, it is already  true that more workers are providing services than actually making products.  That is likely to strengthen  as global manufacturers increasingly seek to enhance their products through the sophisticated analysis  of data generated by their products while in use.28  As global manufacturers seek to acquire these  capabilities, they are finding that the world’s leading providers of these services are almost all based in  the U.S.       Conclusion   Over the last decade, the U.S. followed a pattern of growth and investment that failed to lay the  foundation for sustained prosperity.  In 2008, that path led to the worst economic downturn since the  Great Depression.  The last decade and the recession we have emerged from point to the critical  importance of ensuring an economy that is built to last.                                                                     27   These developments were noted by Jensen (2011).  28    These same global firms are likely to demand more detailed and data‐driven market research, more  sophisticated consulting services, and more comprehensive international legal advice – all trends that will benefit  leading U.S. exporters of these services.  14     
  • 15.     We are seeing some encouraging economic signs, including 22 straight months of private sector job  creation, a measurable improvement in the competitive position of U.S. manufacturing, and an  expansion of our domestic natural resources that further supports business investment.  The  composition of investment has shifted, with a focus, once again, on building the equipment and the  plants that produce the real goods and services our people need and the world demands.  We also see  evidence of the continued growth of America’s tradable services sector.      While the emerging evidence is positive, more must be done to realize the promise that these recent  trends offer.  From investments in our workforce and infrastructure to measures to support innovation,  this Administration is committed to helping American workers and American companies together realize  the potential we have documented in this report.  By taking these steps, we can create an economy that  is built to last.          15     
  • 16.     References   1. Accenture. 2011. “Manufacturing’s Secret Shift: Gaining Competitive Advantage by Getting  Closer to the Consumer.”   2. Autor, David, David Dorn, and Gordon Hanson. 2011. “The China Syndrome: Local Labor Market  Effects of Import Competition.” MIT Working Paper. August.    3. Bernard, Andrew B. and J. Bradford Jensen. 2004. “Entry, Expansion, and Intensity in the US  Export Boom, 1987‐1992.” Review of International Economics, 12 (4), 662‐675    4. Booz & Company. 2011. “Manufacturing’s Wake‐Up Call.” Fall.    5. Boston Consulting Group. 2011. “Made in America, Again: Why Manufacturing will Return to the  U.S.” August.    6. Council of Economic Advisers.  2011.  “U.S. Inbound Foreign Direct Investment.” June.    7. Department of Commerce. 2012. “The Competitiveness and Innovative Capacity of the United  States.” January.    8. Deloitte. 2009. “A New Era: Accelerating Toward 2020 – An Automotive Industry Transformed.”  September.    9. Energy Information Administration (EIA), Office of Oil and Gas. 2007. “U.S. Natural Gas Imports  and Exports: Issues and Trends 2005.” Washington, DC.    10. EIA, “Short‐Term Energy Outlook: January 2012.” Washington, DC.     11. Feldstein, Martin S. 2008. “Resolving the Global Imbalance: The Dollar and the U.S. Saving Rate.”  Working Paper 13952. Cambridge, MA: National Bureau of Economic Research. April.    12. Jensen, J. Bradford. 2011. Global Trade in Services:  Fear, Facts, and Offshoring. Peter G.  Peterson Institute for International Economics. Washington, DC.    13. Lardy, Nicholas.  2011.  Sustaining China’s Economic Growth After the Global Financial  Crisis.  Peterson G. Institute for International Economics.  Washington, DC.    14. President’s Council of Advisers on Science and Technology (PCAST). 2011. “Report to the  President on Ensuring American Leadership in Advanced Manufacturing.” June.  16