EIA Drilling Productivity Report - April 2014
•
0 gostou•1,171 visualizações

The monthly Drilling Productivity Report for April 2014 from the U.S. Energy Information Administration (EIA). The April report shows the Marcellus Shale average daily production continues to climb--and in May will come very close to 15 billion cubic feet per day of production (14.77 Bcf/d).

Recomendados
Recomendados
Mais conteúdo relacionado
Mais procurados
Mais procurados (18)
Destaque
Destaque (7)
Semelhante a EIA Drilling Productivity Report - April 2014
Semelhante a EIA Drilling Productivity Report - April 2014 (13)
Mais de Marcellus Drilling News
Mais de Marcellus Drilling News (20)
Último
Último (9)
EIA Drilling Productivity Report - April 2014
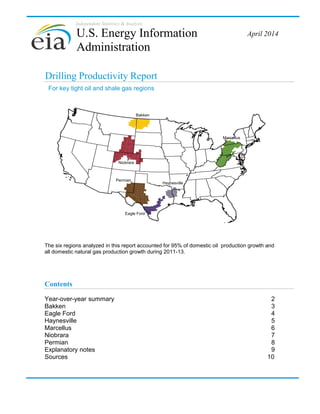
- 1. Independent Statistics & Analysis Drilling Productivity Report The six regions analyzed in this report accounted for 95% of domestic oil production growth and all domestic natural gas production growth during 2011-13. April 2014 For key tight oil and shale gas regions U.S. Energy Information Administration Contents Year-over-year summary 2 Bakken 3 Eagle Ford 4 Haynesville 5 Marcellus 6 Niobrara 7 Permian 8 Explanatory notes 9 Sources 10 Bakken Marcellus Niobrara Haynesville Eagle Ford Permian
- 2. U. S. Energy Information Administration | Drilling Productivity Report 0 400 800 1,200 1,600 2,000 2,400 Bakken Eagle Ford Haynesville Marcellus Niobrara Permian May-2013 May-2014 Oil production thousand barrels/day 0 2,000 4,000 6,000 8,000 10,000 12,000 14,000 16,000 Bakken Eagle Ford Haynesville Marcellus Niobrara Permian May-2013 May-2014 Natural gas production million cubic feet/day 0 250 500 750 1,000 1,250 Bakken Eagle Ford Haynesville Marcellus Niobrara Permian May-2013 May-2014 New-well oil production per rig barrels/day 0 1,000 2,000 3,000 4,000 5,000 6,000 7,000 Bakken Eagle Ford Haynesville Marcellus Niobrara Permian May-2013 May-2014 New-well gas production per rig thousand cubic feet/day (700) (600) (500) (400) (300) (200) (100) 0 Bakken Eagle Ford Haynesville Marcellus Niobrara Permian May-2013 May-2014 Legacy gas production change million cubic feet/day (125) (100) (75) (50) (25) 0 Bakken Eagle Ford Haynesville Marcellus Niobrara Permian May-2013 May-2014 Legacy oil production change thousand barrels/day drilling data through March projected production through May April 2014 Drilling Productivity Report Year-over-year summary -10 0 10 20 30 40 50 60 70 Bakken Eagle Ford Haynesville Marcellus Niobrara Permian May-2013 May-2014 thousand barrels/day Indicated monthly change in oil production (May vs. Apr) -200 0 200 400 600 800 1,000 Bakken Eagle Ford Haynesville Marcellus Niobrara Permian May-2013 May-2014 million cubic feet/day Indicated monthly change in gas production (May vs. Apr) 2
- 3. U. S. Energy Information Administration | Drilling Productivity Report 0 200 400 600 800 1,000 1,200 2007 2008 2009 2010 2011 2012 2013 2014 Oil production thousand barrels/day Bakken 0 50 100 Apr 1,033 Mbbl/d Production from new wells Legacy production change Net change May 1,055 Mbbl/d thousand barrels/day Bakken +90 -69 +21 Indicated change in oil production (May vs. Apr) 0 50 100 Apr 1,215 MMcf/d Production from new wells Legacy production change Net change May 1,239 MMcf/d Indicated change in natural gas production (May vs. Apr) million cubic feet/day Bakken +91 -67 +24 0 50 100 150 200 250 0 100 200 300 400 500 600 2007 2008 2009 2010 2011 2012 2013 2014 new-well oil production per rig rig count New-well oil production per rig barrels/day Bakken Rig count rigs (80) (70) (60) (50) (40) (30) (20) (10) 0 2007 2008 2009 2010 2011 2012 2013 2014 Legacy oil production change thousand barrels/day Bakken (80) (70) (60) (50) (40) (30) (20) (10) 0 2007 2008 2009 2010 2011 2012 2013 2014 Legacy gas production change million cubic feet/day BakkenBakken 0 1,000 2,000 3,000 4,000 5,000 6,000 7,000 2007 2008 2009 2010 2011 2012 2013 2014 Bakken Natural gas production million cubic feet/day 0 50 100 150 200 250 0 600 1,200 1,800 2,400 3,000 3,600 2007 2008 2009 2010 2011 2012 2013 2014 new-well gas production per rig rig count New-well gas production per rig thousand cubic feet/day Bakken Rig count rigs drilling data through March projected production through May April 2014 Drilling Productivity Report Monthly additions from one average rig May barrels/day April barrels/day month over month Oil +7 Gas thousand cubic feet/day month over month +8 Bakken million cubic feet/day month over month 505May thousand cubic feet/day April 497 499 492 thousand barrels/day month over month Oil +21 Gas +24 3
- 4. U. S. Energy Information Administration | Drilling Productivity Report 0 200 400 600 800 1,000 1,200 1,400 1,600 2007 2008 2009 2010 2011 2012 2013 2014 Oil production thousand barrels/day Eagle Ford 0 50 100 150 Apr 1,351 Mbbl/d Production from new wells Legacy production change Net change May 1,382 Mbbl/d thousand barrels/day Eagle Ford +135 -104 +31 Indicated change in oil production (May vs. Apr) 0 50 100 150 200 250 300 350 400 Apr 6,696 MMcf/d Production from new wells Legacy production change Net change May 6,811 MMcf/d Indicated change in natural gas production (May vs. Apr) million cubic feet/day Eagle Ford +371 -256 +115 0 50 100 150 200 250 300 350 0 100 200 300 400 500 600 2007 2008 2009 2010 2011 2012 2013 2014 new-well oil production per rig rig count New-well oil production per rig barrels/day Eagle Ford Rig count rigs (120) (100) (80) (60) (40) (20) 0 2007 2008 2009 2010 2011 2012 2013 2014 Legacy oil production change thousand barrels/day Eagle Ford (300) (250) (200) (150) (100) (50) 0 2007 2008 2009 2010 2011 2012 2013 2014 Legacy gas production change million cubic feet/day Eagle FordEagle Ford 0 1,000 2,000 3,000 4,000 5,000 6,000 7,000 2007 2008 2009 2010 2011 2012 2013 2014 Eagle Ford Natural gas production million cubic feet/day 0 50 100 150 200 250 300 350 0 600 1,200 1,800 2,400 3,000 3,600 2007 2008 2009 2010 2011 2012 2013 2014 new-well gas production per rig rig count New-well gas production per rig thousand cubic feet/day Eagle Ford Rig count rigs drilling data through March projected production through May April 2014 Drilling Productivity Report Monthly additions from one average rig May barrels/day April barrels/day month over month Oil +7 Gas thousand cubic feet/day month over month +6 Eagle Ford million cubic feet/day month over month 1,285May thousand cubic feet/day April 1,279 470 463 thousand barrels/day month over month Oil +31 Gas +115 4
- 5. U. S. Energy Information Administration | Drilling Productivity Report barrels/day 0 400 800 1,200 1,600 2,000 2007 2008 2009 2010 2011 2012 2013 2014 Oil production thousand barrels/day Haynesville 0.0 1.0 2.0 3.0 Apr 53 Mbbl/d Production from new wells Legacy production change Net change May 53 Mbbl/d thousand barrels/day Haynesville +1 -1 +0 Indicated change in oil production (May vs. Apr) -150 -50 50 150 250 350 Apr 6,604 MMcf/d Production from new wells Legacy production change Net change May 6,615 MMcf/d Indicated change in natural gas production (May vs. Apr) million cubic feet/day Haynesville +284 -272 +12 0 50 100 150 200 250 300 0 200 400 600 800 1,000 2007 2008 2009 2010 2011 2012 2013 2014 new-well oil production per rig rig count New-well oil production per rig barrels/day Haynesville Rig count rigs (3) (2) (1) 0 2007 2008 2009 2010 2011 2012 2013 2014 Legacy oil production change thousand barrels/day Haynesville (600) (500) (400) (300) (200) (100) 0 2007 2008 2009 2010 2011 2012 2013 2014 Legacy gas production change million cubic feet/day HaynesvilleHaynesville 0 2,000 4,000 6,000 8,000 10,000 12,000 2007 2008 2009 2010 2011 2012 2013 2014 Haynesville Natural gas production million cubic feet/day 0 50 100 150 200 250 300 0 1,000 2,000 3,000 4,000 5,000 6,000 2007 2008 2009 2010 2011 2012 2013 2014 new-well gas production per rig rig count New-well gas production per rig thousand cubic feet/day Haynesville Rig count rigs drilling data through March projected production through May April 2014 Drilling Productivity Report Monthly additions from one average rig May April barrels/day month over month Oil 0 Gas thousand cubic feet/day month over month +62 Haynesville million cubic feet/day month over month 5,230May thousand cubic feet/day April 5,168 23 23 thousand barrels/day month over month Oil +0 Gas +12 5
- 6. U. S. Energy Information Administration | Drilling Productivity Report Marcellus 0 400 800 1,200 1,600 2,000 2007 2008 2009 2010 2011 2012 2013 2014 Oil production thousand barrels/day Marcellus 0.0 1.0 2.0 3.0 4.0 Apr 40 Mbbl/d Production from new wells Legacy production change Net change May 41 Mbbl/d thousand barrels/day Marcellus +3 -2 +1 Indicated change in oil production (May vs. Apr) 0 200 400 600 Apr 14,520 MMcf/d Production from new wells Legacy production change Net change May 14,773 MMcf/d Indicated change in natural gas production (May vs. Apr) million cubic feet/day Marcellus +605 -352 +253 0 20 40 60 80 100 120 140 160 0 200 400 600 800 1,000 1,200 2007 2008 2009 2010 2011 2012 2013 2014 new-well oil production per rig rig count New-well oil production per rig barrels/day Marcellus Rig count rigs (3) (2) (1) 0 2007 2008 2009 2010 2011 2012 2013 2014 Legacy oil production change thousand barrels/day Marcellus (400) (360) (320) (280) (240) (200) (160) (120) (80) (40) 0 2007 2008 2009 2010 2011 2012 2013 2014 Legacy gas production change million cubic feet/day MarcellusMarcellus 0 2,000 4,000 6,000 8,000 10,000 12,000 14,000 16,000 2007 2008 2009 2010 2011 2012 2013 2014 Marcellus Natural gas production million cubic feet/day 0 20 40 60 80 100 120 140 160 0 1,200 2,400 3,600 4,800 6,000 7,200 2007 2008 2009 2010 2011 2012 2013 2014 new-well gas production per rig rig count New-well gas production per rig thousand cubic feet/day Marcellus Rig count rigs drilling data through March projected production through May April 2014 Drilling Productivity Report Monthly additions from one average rig May barrels/day April barrels/day month over month Oil 0 Gas thousandcubic feet/day month over month +46 million cubic feet/day month over month 6,501May thousand cubic feet/day April 6,455 30 30 thousand barrels/day month over month Oil +1 Gas +253 6
- 7. U. S. Energy Information Administration | Drilling Productivity Report 0 200 400 600 800 1,000 2007 2008 2009 2010 2011 2012 2013 2014 Oil production thousand barrels/day Niobrara 0 10 20 30 40 Apr 306 Mbbl/d Production from new wells Legacy production change Net change May 311 Mbbl/d thousand barrels/day Niobrara +34 -29 +5 Indicated change in oil production (May vs. Apr) 0 50 100 150 200 Apr 4,144 MMcf/d Production from new wells Legacy production change Net change May 4,169 MMcf/d Indicated change in natural gas production (May vs. Apr) million cubic feet/day Niobrara +151 -127 +24 0 20 40 60 80 100 120 140 0 100 200 300 400 500 600 2007 2008 2009 2010 2011 2012 2013 2014 new-well oil production per rig rig count New-well oil production per rig barrels/day Niobrara Rig count rigs (35) (30) (25) (20) (15) (10) (5) 0 2007 2008 2009 2010 2011 2012 2013 2014 Legacy oil production change thousand barrels/day Niobrara (160) (140) (120) (100) (80) (60) (40) (20) 0 2007 2008 2009 2010 2011 2012 2013 2014 Legacy gas production change million cubic feet/day NiobraraNiobrara 0 1,000 2,000 3,000 4,000 5,000 6,000 2007 2008 2009 2010 2011 2012 2013 2014 Niobrara Natural gas production million cubic feet/day 0 20 40 60 80 100 120 140 0 600 1,200 1,800 2,400 3,000 3,600 2007 2008 2009 2010 2011 2012 2013 2014 new-well gas production per rig rig count New-well gas production per rig thousand cubic feet/day Niobrara Rig count rigs drilling data through March projected production through May April 2014 Drilling Productivity Report Monthly additions from one average rig May barrels/day April barrels/day month over month Oil +8 Gas thousand cubic feet/day month over month +14 Niobrara million cubic feet/day month over month 1,554May thousand cubic feet/day April 1,540 352 344 thousand barrels/day month over month Oil +5 Gas +24 7
- 8. U. S. Energy Information Administration | Drilling Productivity Report 0 200 400 600 800 1,000 1,200 1,400 1,600 2007 2008 2009 2010 2011 2012 2013 2014 Oil production thousand barrels/day Permian 0 20 40 60 Apr 1,441 Mbbl/d Production from new wells Legacy production change Net change May 1,454 Mbbl/d thousand barrels/day Permian +56 -43 +13 Indicated change in oil production (May vs. Apr) 0 30 60 90 120 150 Apr 5,347 MMcf/d Production from new wells Legacy production change Net change May 5,386 MMcf/d Indicated change in natural gas production (May vs. Apr) million cubic feet/day Permian +140 -100 +40 0 100 200 300 400 500 600 0 100 200 300 400 500 600 2007 2008 2009 2010 2011 2012 2013 2014 new-well oil production per rig rig count New-well oil production per rig barrels/day Permian Rig count rigs (50) (45) (40) (35) (30) (25) (20) (15) (10) (5) 0 2007 2008 2009 2010 2011 2012 2013 2014 Legacy oil production change thousand barrels/day Permian (140) (120) (100) (80) (60) (40) (20) 0 2007 2008 2009 2010 2011 2012 2013 2014 Legacy gas production change million cubic feet/day PermianPermian 0 1,000 2,000 3,000 4,000 5,000 6,000 7,000 8,000 2007 2008 2009 2010 2011 2012 2013 2014 Permian Natural gas production million cubic feet/day 0 100 200 300 400 500 600 0 600 1,200 1,800 2,400 3,000 3,600 2007 2008 2009 2010 2011 2012 2013 2014 new-well gas production per rig rig count New-well gas production per rig thousand cubic feet/day Permian Rig count rigs drilling data through March projected production through May April 2014 Drilling Productivity Report Monthly additions from one average rig May barrels/day April barrels/day month over month Oil +1 Gas thousand cubic feet/day month over month +3 Permian million cubic feet/day month over month 276May thousand cubic feet/day April 273 110 109 thousand barrels/day month over month Oil +13 Gas +40 8
- 9. U. S. Energy Information Administration | Drilling Productivity Report April 2014Explanatory notes Drilling Productivity Report The Drilling Productivity Report uses recent data on the total number of drilling rigs in operation along with estimates of drilling productivity and estimated changes in production from existing oil and natural gas wells to provide estimated changes in oil and natural gas production for six key fields. EIA’s approach does not distinguish between oil-directed rigs and gas-directed rigs because once a well is completed it may produce both oil and gas; more than half of the wells do that. Monthly additions from one average rig Monthly additions from one average rig represent EIA’s estimate of an average rig’s1 contribution to production of oil and natural gas from new wells.2 The estimation of new-well production per rig uses several months of recent historical data on total production from new wells for each field divided by the region's monthly rig count, lagged by two months.3 Current- and next-month values are listed on the top header. The month-over-month change is listed alongside, with +/- signs and color-coded arrows to highlight the growth or decline in oil (brown) or natural gas (blue). New-well oil/gas production per rig Charts present historical estimated monthly additions from one average rig coupled with the number of total drilling rigs as reported by Baker Hughes. Legacy oil and natural gas production change Charts present EIA’s estimates of total oil and gas production changes from all the wells other than the new wells. The trend is dominated by the well depletion rates, but other circumstances can influence the direction of the change. For example, well freeze-offs or hurricanes can cause production to significantly decline in any given month, resulting in a production increase the next month when production simply returns to normal levels. Projected change in monthly oil/gas production Charts present the combined effects of new-well production and changes to legacy production. Total new-well production is offset by the anticipated change in legacy production to derive the net change in production. The estimated change in production does not reflect external circumstances that can affect the actual rates, such as infrastructure constraints, bad weather, or shut-ins based on environmental or economic issues. Oil/gas production Charts present oil and natural gas production from both new and legacy wells since 2007. This production is based on all wells reported to the state oil and gas agencies. Where state data are not immediately available, EIA estimates the production based on estimated changes in new-well oil/gas production and the corresponding legacy change. Footnotes: 1. The monthly average rig count used in this report is calculated from weekly data on total oil and gas rigs reported by Baker Hughes 2. A new well is defined as one that began producing for the first time in the previous month. Each well belongs to the new-well category for only one month. Reworked and recompleted wells are excluded from the calculation. 3. Rig count data lag production data because EIA has observed that the best predictor of the number of new wells beginning production in a given month is the count of rigs in operation two months earlier. 9
- 10. U. S. Energy Information Administration | Drilling Productivity Report April 2014Sources Drilling Productivity Report The data used in the preparation of this report come from the following sources. EIA is solely responsible for the analysis, calculations, and conclusions. Drilling Info (http://www.drillinginfo.com) Source of production, permit, and spud data for counties associated with this report. Source of real-time rig location to estimate new wells spudded and completed throughout the United States. Baker Hughes (http://www.bakerhughes.com) Source of rig and well counts by county, state, and basin. North Dakota Oil and Gas Division (https://www.dmr.nd.gov/oilgas) Source of well production, permit, and completion data in the counties associated with this report in North Dakota Railroad Commission of Texas (http://www.rrc.state.tx.us) Source of well production, permit, and completion data in the counties associated with this report in Texas Pennsylvania Department of Environmental Protection (https://www.paoilandgasreporting.state.pa.us/publicreports/Modules/Welcome/Welcome.aspx) Source of well production, permit, and completion data in the counties associated with this report in Pennsylvania West Virginia Department of Environmental Protection (http://www.dep.wv.gov/oil-and- gas/Pages/default.aspx) Source of well production, permit, and completion data in the counties associated with this report in West Virginia Colorado Oil and Gas Conservation Commission (http://cogcc.state.co.us) Source of well production, permit, and completion data in the counties associated with this report in Colorado Wyoming Oil and Conservation Commission (http://wogcc.state.wy.us ) Source of well production, permit, and completion data in the counties associated with this report in Wyoming Louisiana Department of Natural Resources (http://dnr.louisiana.gov) Source of well production, permit, and completion data in the counties associated with this report in Louisiana 10