Measuring the full impact of digital capital
•
1 like•360 views

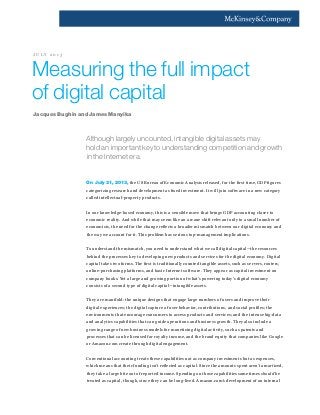
Article | McKinsey Quarterly Measuring the full impact of digital capital Although largely uncounted, intangible digital assets may hold an important key to understanding competition and growth in the Internet era. July 2013 | by Jacques Bughin and James Manyika http://buff.ly/1eo18Sy

Recommended
More Related Content
More from Managers
More from Managers (20)
Recently uploaded
Recently uploaded (20)
Measuring the full impact of digital capital
- 1. Although largely uncounted, intangible digital assets may hold an important key to understanding competition and growth in the Internet era. On July 31, 2013, the US Bureau of Economic Analysis released, for the first time, GDP figures categorizing research and development as fixed investment. It will join software in a new category called intellectual-property products. In our knowledge-based economy, this is a sensible move that brings GDP accounting closer to economic reality. And while that may seem like an arcane shift relevant only to a small number of economists, the need for the change reflects a broader mismatch between our digital economy and the way we account for it. This problem has serious top-management implications. To understand the mismatch, you need to understand what we call digital capital—the resources behind the processes key to developing new products and services for the digital economy. Digital capital takes two forms. The first is traditionally counted tangible assets, such as servers, routers, online-purchasing platforms, and basic Internet software. They appear as capital investment on company books. Yet a large and growing portion of what’s powering today’s digital economy consists of a second type of digital capital—intangible assets. They are manifold: the unique designs that engage large numbers of users and improve their digital experiences; the digital capture of user behavior, contributions, and social profiles; the environments that encourage consumers to access products and services; and the intense big-data and analytics capabilities that can guide operations and business growth. They also include a growing range of new business models for monetizing digital activity, such as patents and processes that can be licensed for royalty income, and the brand equity that companies like Google or Amazon.com create through digital engagement. Conventional accounting treats these capabilities not as company investments but as expenses, which means that their funding isn’t reflected as capital. Since the amounts spent aren’t amortized, they take a large bite out of reported income. Spending on those capabilities sometimes should be treated as capital, though, since they can be long-lived. Amazon.com’s development of an internal Measuring the full impact of digital capital Jacques Bughin and James Manyika J U L Y 2 0 1 3
- 2. 2 search process that promotes recurring sales or the efforts of Netflix to fine-tune personal recommendations to increase video viewing and retain customers are certainly more than expenses. Such capabilities, which are complex to build and replicate, can often help companies create enduring competitive strengths. We’re acutely aware of misguided efforts to justify sky-high valuations during the late-1990s Internet bubble by claiming that finance and accounting fundamentals were no longer relevant. We also recognize that we’re far from the first to note the relationship among intangibles, company- level growth and productivity, and overall economic growth.1 What we want to suggest here is that those relationships, which once represented a small minority of business activities, are becoming the rule in the digital economy. In fact, much of today’s digital spending could pay for long-lived intangible assets that will define the competitive landscape going forward.2 The rising stakes are seen in the copyright battles between Internet and consumer-electronics companies and in major spending on patent portfolios. Above all, we want to emphasize the importance, for many business leaders, of making the mind- set shift required to embrace the importance of digital capital fully. The disruptive nature of digital assets is intensifying in markets such as search, e-commerce, and social media (where attackers can build business models with near-limitless scale). Disruptive digital assets are also important in segments where behavioral data and user participation can be monetized, by defining entirely new business opportunities or fostering breakthroughs in collaborative innovation. As the mobile- payments start-up Square is demonstrating in the credit-card arena, increasingly, companies that deploy these assets have the potential to threaten large existing profit pools thanks to the challengers’ vastly different economics or radically new ways of doing things. The big picture There are parallels between what’s occurring today and during the period, 100 years ago, when electric motors gained widespread adoption. Early in that cycle, companies invested in physical motors, which like today’s servers and routers provided a new growth platform. But the more important kind of value appeared after companies began to understand how motors could change almost every process, improve productivity, and stimulate innovation. Companies that captured these benefits were more successful and more valuable than others. Today, the market valuations of many Internet-based companies are higher than those of their counterparts in other sectors, including high tech. Many Internet leaders earn lower returns on equity than established technology companies do, yet there’s no reason to believe that markets are making irrational bets on the growth potential of digitally adept companies. As the sidebar “Valuation and intangibles: Viewing the numbers differently” illustrates, treating digital intangibles as assets rather than expenses clarifies the logic behind valuations. (We based these pro-forma valuation calculations on data compiled by academic researchers, as well as assumptions about rates of intangible and digital investment from our own and outside research.) 1 See, for example, Lowell L. Bryan, “The new metrics of corporate performance: Profit per employee,” McKinsey Quarterly, 2007 Number 1. At a country level, see Carol Corrado and Charles Hulten, “How do you measure a ‘technological revolution’?,” American Economic Review, 2010, Volume 100, Number 5, pp. 99–104. 2 It’s noteworthy that today’s valuations coincide with the equity markets’ slow recovery from their financial-crisis doldrums. In the late 1990s, when the relative importance of intangibles seemed to be on a continuous upward trajectory, market conditions were quite different.
- 3. 3 Valuation and intangibles: Viewing the numbers differently The valuation premium investors place on digitized companies becomes clearer when intangible assets are counted as investments rather than expenses. To illustrate this point, we’ll define three pro-forma companies. The first, Company A, represents a baseline: a publicly quoted enterprise that mirrors the US economy across several business variables as compiled by researchers at NYU’s Stern School of Business.1 These variables include total value added,2 employee costs, investments, depreciation, debt levels, the cost of capital, five-year earnings- growth rates, and taxation. By early 2013, this pro-forma company was generating a return above its cost of capital in the range of 4 percent. Recently, earnings had grown by 3.8 percent a year. Although the market valued the company at 2.1 times its book capital, historical accounting data suggest that the computed ratio of equity value to book capital should be more like 1.5. Why the gap? Our thesis is that intangible capital is now creating both additional capital and greater marginal returns on it. Highly efficient financial markets recognize this and therefore credit the company with improved growth prospects. We explore this hypothesis through Company B, which matches our first pro-forma one except that we assume a different stock of and growth rate for invested intangible capital. Here we use estimates by Carol Corrado and Charles Hulten.3 As the exhibit shows, recognizing the intangible capital at work bridges much of the valuation gap. That’s true even though the return on total equity remains flat—intangible-capital returns for Company B are roughly the same as those for tangible capital— and intangible capital depreciates at an accelerated rate, over 7 rather than 20 years. Implicit in the multiple that helps to close the valuation gap is a higher prospective growth rate: 4.3 percent a year. Finally, we push the analysis to a strong digital player, Company C. Its digital-capital investment, calculated using estimates from our own research, is one-third of its total capital; two-thirds of that digital capital is intangible. As a consequence of fast-changing digital competition, assets are depreciated even more quickly, so Company C’s total net capital will be smaller than Company B’s. Yet even with a smaller capital base, the valuation gap is closed, since the shift in the asset mix toward digital capital boosts the company’s earnings-growth rate to 5.5 percent. A large part of the premium results from the higher returns (and growth prospects) flowing from digital capital. Macroeconomic studies we have done suggest that digital capital is not only growing rapidly but has also become a major contributing factor in global economic growth.3 We examined the national-accounts data of 40 countries, assigning values to tangible and intangible assets. In 2005, digital-capital investment represented barely 0.8 percent of GDP for those countries. This year, it will exceed 3.1 percent of GDP. Likewise, the accumulating global value of digital-capital investments has reached more than $6 trillion, about 8.5 percent of nominal world GDP. Globally, levels of digital intangible investment are more than half those of digital tangible investment. In more highly digitized economies, such as Israel, Japan, Sweden, the United Kingdom, and the United States, spending on intangibles represents two-thirds of digital capital’s total value. 3 See the McKinsey Global Institute report Internet matters: The Net’s sweeping impact on growth, jobs, and prosperity, May 2011, mckinsey.com.
- 4. Exhibit Treating intangible investments as assets rather than expenses acknowledges the value added by digital capital and helps explain typical market valuations. Web 2013 Digital capital Exhibit 1 of 1 Pro-forma analysis of a public enterprise that mirrors the US economy across several business variables1 yields: Differences in the price-to-book ratio for different mixes of tangible and intangible capital reflect growth assumptions associated with those capital forms.3 Yet analysis based on historical data and traditional accounting assumptions for tangible capital suggests: Adding either intangibles or digital capital to the valuation restates equity and implied growth rates, explaining the difference. Mix of tangible and intangible capital2 Mix of tangible and digital capital (2/3 of which is intangible) Company A1 Company A2 Company B Company C Book value of capital (tangible) (tangible) (tangible + intangible) (tangible + digital) 59 59 82 71 x 1.5Price-to- book ratio 89124 123 121Market value x 1.5 x 1.7x 2.1 1Based on research by Aswath Damodaran. 2Based on US estimates by Carol Corrado and Charles Hulten. 3 Numbers are approximated for simplicity of communication. Source: Aswath Damodaran, “Valuing companies with intangible assets,” New York University Stern School of Business, September 2009; Carol Corrado and Charles Hulten, “How do you measure a ‘technological revolution’?,” American Economic Review, 2010, Volume 100, Number 5, pp. 99–104; McKinsey analysis Treating intangible investments as assets rather than expenses acknowledges the value added by digital capital and helps explain typical market valuations. Web 2013 Digital capital Exhibit 1 of 1 Pro-forma analysis of a public enterprise that mirrors the US economy across several business variables1 yields: Differences in the price-to-book ratio for different mixes of tangible and intangible capital reflect growth assumptions associated with those capital forms.3 Yet analysis based on historical data and traditional accounting assumptions for tangible capital suggests: Adding either intangibles or digital capital to the valuation restates equity and implied growth rates, explaining the difference. Mix of tangible and intangible capital2 Mix of tangible and digital capital (2/3 of which is intangible) Company A1 Company A2 Company B Company C Book value of capital (tangible) (tangible) (tangible + intangible) (tangible + digital) 59 59 82 71 x 1.5Price-to- book ratio 89124 123 121Market value x 1.5 x 1.7x 2.1 1Based on research by Aswath Damodaran. 2 Based on US estimates by Carol Corrado and Charles Hulten. 3 Numbers are approximated for simplicity of communication. Source: Aswath Damodaran, “Valuing companies with intangible assets,” New York University Stern School of Business, September 2009; Carol Corrado and Charles Hulten, “How do you measure a ‘technological revolution’?,” American Economic Review, 2010, Volume 100, Number 5, pp. 99–104; McKinsey analysis Of course, this result, like all of the preceding analysis, simply confirms the core principle of corporate finance: value creation is a function of returns on capital and rates of growth.4 The scenarios and assumptions that we’ve described here in accounting terms (to illustrate the implications of thinking about digital capital in different ways) also reflect the bedrock reality that, ultimately, only improving cash flows can create value. 1 Aswath Damodaran, “Valuing companies with intangible assets,” New York University Stern School of Business, September 2009. The author has also compiled a large data set, which we used subsequently in this analysis. See “The Data Page,” on stern.nyu.edu. 2 Value added in this case is defined as revenue minus all cost of goods sold. 3 Carol Corrado and Charles Hulten, “How do you measure a ‘technological revolution’?,” American Economic Review, 2010, Volume 100, Number 5, pp. 99–104. 4 See Richard Dobbs, Bill Huyett, and Tim Koller, “The CEO’s guide to corporate finance,” McKinsey Quarterly, 2010 Number 4, mckinsey.com. 4
- 5. 5 This activity is starting to power growth. We estimate that digital capital is the source of more than one percentage point of global GDP growth (roughly one-third of total growth). Intangible capital already accounts for two-thirds of that slice, tangible investment for the rest. This growth flows from not only capital deepening but also increased labor productivity—a remarkable thing, since the digital economy has emerged in the relatively brief space of 15 years. By contrast, it took 80 years for steam engines to increase labor productivity to the same extent, about 40 for electricity, and more than 20 for conventional information and communications technologies.4 (For more on the relationship between capital formation and productivity, see sidebar “Innovation, capital, and productivity growth.”) Navigating the new terrain Intangible digital capital’s role in economic growth gives policy makers one more reason to favor investments in broadband and other forms of Internet infrastructure. Such investments correlate strongly with overall digital-capital levels. In our experience, though, the implications are even greater for executives, who often are not tuned into their organizations’ digital strengths or weakness. Few companies have gone through the internal exercise of reclassifying expenditures or segregating benefits from spending on intangibles. And of course, companies can boast a high ROE thanks to strong legacy-product margins but may nonetheless have muted growth prospects as a result of underinvesting in digital capital. To set a more effective digital course, leaders should consider the following ideas. Take stock of your assets Since identifying intangible assets is difficult, companies may be missing growth opportunities. Many have realized only recently that they can use social-media interactions with their best customers to leverage innovation efforts or that they may have unused data they could restructure into valuable big-data assets to sharpen business strategy. Similarly, companies should take stock of how digital capital they don’t own may be relevant to the business. A retailer that doesn’t have access to digital behavioral data on consumers, for example, may be at a disadvantage. So could a bank whose customers access products through a third-party platform that limits the bank’s ability to capture information. Conversely, companies may wrongly assume that their growth results from conventional capital spending and therefore compromise growth by underinvesting in digital competencies. One online company, for example, stuck to a subscriber pay model in hopes of boosting returns on tangible investments such as server farms. It wound up missing a massive social-networking opportunity that would have yielded far greater returns on advertising revenues. 4 For more details on the estimated impact of global technologies on growth, see Nicholas Crafts, “Fifty years of economic growth in Western Europe: No longer catching up but falling behind?,” World Economics, 2004, Volume 5, Number 2, pp. 131–45; and Nicholas Bloom, Mirko Draca, Tobias Kretschmer, John Van Reenen, and Raffaella Sadun, The Economic Impact of ICT, Centre for Economic Performance, London School of Economics and Political Science, 2010.
- 6. Innovation, capital, and productivity growth Digital capital is an important and growing contributor to many forms of innovation, but other factors are at work, as well. To better understand the range and value of innovation-related assets that contribute to productivity and economic growth, we developed a measure of innovation capital. The metric has three components: Physical capital refers to investments in information and communication equipment. Across the 16 economies we analyzed,1 physical capital represents 16 percent of innovation capital. These “hard” assets are counted as investments and thus elements of national GDP. Knowledge capital arises from investments that build a company’s intellectual property and brand equity. This form of innovation capital—including investments in computerized information, RD and marketing investments, and relevant research spending in universities—represents 60 percent of the total and embodies significant amounts of digital capital. Human capital is formed by investments to build individual or organizational skills that drive productivity growth. It includes public and private investments in tertiary STEM2 education, employee- based training programs, and investments to 6 Eric Hazan, Nathan Marston, and Tamara Rajah Exhibit Finland Innovation stock has a strong correlation with productivity growth. Web 2013 Innovation capital Exhibit 1 of 1 Innovation capital, % of GDP, 2007 Labor productivity growth, CAGR,1 % (1995–2007) 0 0 0.05 0.10 0.15 0.20 0.25 0.30 0.35 0.40 0.45 0.50 0.55 0.5 1.0 1.5 2.0 2.5 3.0 3.5 4.0 Sweden Finland Austria Netherlands United Kingdom United States r2 = 52% FranceDenmark SpainItaly Germany r2 is the proportion of variance that is explained by a regression. 1 2005 real prices; CAGR = compound annual growth rate. Source: Carol Corrado, Jonathan Haskel, Massimiliano Iommi, and Cecilia Jona Lasinio, “Intangible capital and growth in advanced economies: Measurement and comparative results,” Centre for Economic Policy Research working paper, Number DP9061, July 2012; McKinsey analysis
- 7. Our global research shows that the stock of intangible assets varies considerably by region. Some markets have larger numbers of strong digital contenders, others fewer. Companies could make those differences a factor in deciding which markets to enter and where to place digital bets. Face up to looming threats Assume that digital leaders in your competitive zone are relentlessly expanding their intangible assets both to attack existing markets and to create new ones. Amazon.com, for instance, won share from brick-and-mortar retailers with its ease-of-purchase model and its ability to reach long-tail customers. Now it’s launching new business models (such as Amazon Prime) to further leverage its user base and logistics capabilities. It’s also using tangible server assets to offer cloud-based labor services (Mechanical Turk) that match freelance workers with demand for their labor. A good first step is to identify which areas of your value chain are most vulnerable—for example, service delivery or weak digital brands. Competitors can slide vertically or horizontally into large gaps, so you’ll need to build digital assets quickly as a counterweight. Even companies that have a considerable stock of digital assets should understand that capturing value from them isn’t a given. Instead, such companies must define (and relentlessly innovate with) business models that can be scaled up to match those assets. One clue suggesting that a company might face emerging digital challenges is the existence of businesses that have unusually high levels of revenue per employee in adjacent market spaces. Amazon.com’s employee productivity, for example, is double that of traditional retailers. Netflix, develop organizational efficiencies—for example, the redesign of business processes or the adoption of new business models. Human capital represents 24 percent of innovation capital. The stock of innovation capital is substantial, totaling $14 trillion, or more than 40 percent of the GDP of the 16 nations in our study. (Our colleagues—the authors of the accompanying article—estimate that digital capital represents just under 30 percent of innovation capital.) Over the period we studied (1995–2008), innovation capital grew at an annual rate of 4.6 percent. We also found a strong correlation between levels of innovation capital as a proportion of gross domestic product and labor-productivity growth. 7 1 Austria, Canada, the Czech Republic, Denmark, Finland, France, Germany, Italy, Japan, the Netherlands, Russia, Slovenia, Spain, Sweden, the United Kingdom, and the United States. 2 Science, technology, engineering, and mathematics. Eric Hazan is a principal in McKinsey’s Paris office; Nathan Marston and Tamara Rajah are principals in the London office.
- 8. 8 similarly, generates more revenue per employee than traditional cable operators do, by leveraging intangibles such as its highly evolved recommendation algorithms. Unusual financial profiles are another warning sign. Since digital funding is counted as operating expenditure, digital leaders often have small capital-investment levels relative to their size and growth potential. They also borrow less, both because they may not need to (some reap sizable market rents from, for example, search licensing fees or patent income) and because banks may be less likely to lend against intangible assets. Partner with care Most companies rely on digital agencies for things like optimizing search marketing. In such cases, they may be ceding digital capital, since they never develop a full understanding of consumer segments or what inspires a customer who searches for their products. Seeing such capability building as an investment may change the logic of using third parties. Similarly, when companies look to established tech players for partnerships shoring up weaknesses, they should be cautious: some seemingly high performers may be on the wrong path and could burden you with outmoded standards and platforms. Alternatively, if you deal with strong players, you may be leaving yourself vulnerable by letting them lead. The need for growth and competitiveness will force companies to build strong digital capabilities. Viewing them as assets rather than additional areas of spending requires a new set of management and financial lenses. Embracing them is a major shift—but one worth making for companies striving to master a still-evolving landscape. Jacques Bughin is a director in McKinsey’s Brussels office. James Manyika is a director of the McKinsey Global Institute and a director in the San Francisco office. Copyright © 2013 McKinsey Company. All rights reserved. We welcome your comments on this article. Please send them to quarterly_comments@mckinsey.com.