
Recomendados
Recomendados
Mais conteúdo relacionado
Mais procurados
Mais procurados (20)
Semelhante a IJACSmajid
Semelhante a IJACSmajid (20)
IJACSmajid
- 1. International Journal of Agriculture and Crop Sciences. Available online at www.ijagcs.com IJACS/2014/7-11/853-862 ISSN 2227-670X ©2014 IJACS Journal Salinity and Nitrariaschoberi: Growth Parameters, Chlorophyll Content and Ion Accumulation Majid Ghorbani*1 , Abolfazl Ranjbar Fardoyi2 , Fatemeh Panahi3 , Javad Attarha4 , Navid Marzbani5 , Mina Mo’ases6 College of Natural Resources and Earth Sciences, University of Kashan *Correspondence author email: siroco1987@yahoo.com ABSTRACT: Salinity is one of the most important factors that cause vegetation decline and sometimes elimination in arid and semi-arid regions. This study was carried out to investigate the effects of salinity on growth parameters, chlorophyll content and ion accumulation of Nitaria schoberi. Twenty pots were used in four replications and treatments consisted of a control treatment and four treatments with different salinity levels in a completely randomized design. Salt was added to the pots at concentrations of 0, 86, 160, 204 and 246 mM NaCl. Data analysis was performed by SPSS software.The first treatment (T1, 86 mM NaCl) achieved the best growth rate and the highest chlorophyll content and also the least amount of pigment degradation. According to the results, the ion balance of N. schoberi showed specific mechanisms in the tissues, so that the concentration of sodium and chloride ions increased with increasing salinity level, and in general, the concentration of potassium, calcium and magnesium ions decreased with increasing salinity level.Best performance of Nitraria schoberi was obtained in low salinity (86 mM NaCl). Keywords: Chlorophyll content, Growth Parameters, Ion Accumulation, Nitrariaschoberi, Salinity. INTRODUCTION Deterioration of biophysical environment of land by human-induced process resulting in reduced soil productivity is called land degradation (Dregne, 2002). The main causes of land degradation are (1) intensive cultivation, (2) deforestation, (3) poor quality irrigation, (4) unbalanced fertilization and (5) industrialization(Maqsood et al., 2013). According to the land degradation assessment in drylands (LADA, 2010), project executed by FAO, apart from the increased cost of fertilizer, land degradation is costing about 40 billion US dollars annually. Soil salinity refers to the situation in which the presence of salts renders the soil to be of marginal quality. This leads to deflocculation/dispersion of soil colloids, translocated in the soil profile, blocks the conducting pores and reduces soil porosity (Vlek’s et al., 2008).Salt affected soils impact vegetation through adverse physiological effects, and high levels of sodium degrade the physical structure of soil. Soil salinity results in the direct inhibition of plant growth or function due to osmotic stress, ion toxicity, or decreased absorption of essential nutrients (Hameed et al., 2008). However, plant species differ in their sensitivity or tolerance to salts (Brady and Weil, 1996). One of the most important properties of halophytes is their salinity tolerance (Liethet al.,1999). Nitraria schoberi is a halophyte, belongs to Zygophyllaceae family and toleratethe high salt concentrations (Mojiri and Jalilian, 2011). This species grows in the desert and alluvial floodplains with deep and sedimentary salty soils that have variable textures and calcareous and gypsic materials on the limited drainage conditions (Jori and Mahdavi, 2010). Mojiri and Jalalian (2011) studied the relationship between the growth parameters of Nitraria schoberi and some soil properties. They concluded that the electrical conductivity and sodium ions had negative effects on plant growth and physiologic parameters.Panahi (2012) studied Salsolaarbuscula, S. orientalisand S. tomentosaresponses to salt stress and concluded that the rate of growth parameters increased with an increase in moderate salinity while in high salinity levels, salt stress caused all growth characteristics decline. Investigating halophytes response to salt with the aim of saline soils reclamation,Daoudet al. (2013) expressed that the salt- tolerant species survived at all salinity treatments, and the maximum growth occurred in low and moderate salinity (25 and 50% seawater).Brakez et al. (2013) studied the performance of Chenopodiumquinoa under salt stress and reported that the maximum biomass rate was recorded in 20% seawater treatment (low salinity level).
- 2. Intl J Agri Crop Sci. Vol., 7 (11), 853-862, 2014 854 However, to face the increasing demands for food production, increased attention has been given to reclaim, improve and manage saline-sodic soil to solve salinity problems and achieve optimal crop production (sallam, 2007). The objective of this research is to investigate the effects of Salt Stress on growth, ion accumulation and phyto-biochemical parameters in Nitrariaschoberi. METHODS AND MATERIALS Experiment was conducted in the greenhouse of college of Natural Resources and Earth Sciences, University of Kashan located in Aran and Bidgul city, Kashan, Isfahan, Iran. Seeds of N. schoberi, from its natural habitat at Isfahan province, were seeded in plastic pots containing sand. After germinating and developing seeds in the seed bed for 3 months, the young seedlings were transplanted into 10 kg pots for a further 10 months (July 2012 through April 2013) with a standard dose of fertilizer (NPK) application. For salinity treatments, twenty pots were used in four replications. Treatments were consisted of a control treatment and four treatments with different salinity levels in a completely randomized design. The NaCl-solutions were added to the pots at different concentrations of 0, 86, 160, 204 and 246 mM NaCl (Quiza et al., 2011). After six weeks from the beginning of salt stress in all treatments, all planted seedlings were harvested. Leaves, stems and roots were weighed individually to determine fresh weight and oven dried at 80˚C for at least 24 h. After drying, leaves, stems and roots dry weight was determined using a digital scale (AND, FX-300 GD, Japan) with an accuracy of 0.001 g. Photosynthetic pigments (chlorophyll a and b) were estimated in the fresh plant tissue, after extracting with 85% acetone by Spectrophotometry method (by Spectrophotometer, Model 2100-UV) as described by Metzner et al. (1965). Wavelengths of 453, 505, 645 and 663 nm were chosen to measure these parameters by spectrophotometer. The parameters were calculated using the following equations: (Equation 1) chlorophyll a mg 100mL = 0.999A663 − 0.0989A645 (Equation 2) chlorophyll b mg 100mL = −0.328A663 + 1.77A645 (Equation 3) Pigment degradation = 1 − ( total chl .in salt treatment total chl .in contrtol ) × 100 Ash was prepared using Wilson's (1983) method. The extract obtained was used for the measurement of mineral elements. Chlorine measurement was performed using Mohr's method (1969). This volumetric method based on two sediments with quite distinct color of silver chloride and chromate. Flame photometrywas used to measure sodium and potassium ions accumulation rate (Portlab, Model 378P, Italy). Calcium and magnesium were obtained by titration with EDTA 0.01N. Statistical analyses were doneby mean comparison of Duncan’s multiple range method using SPSS software version 16.0. RESULTS AND DISCUSSION Growth parameters According to the results of analysis of variance, root and leaf dry weight along with the fresh and dry weight of the total plant showed a significant (P<0.05) difference between different treatments (Table 1). At the end of the experiment, 75% of the forth treatment (T4) (246 mM NaCl) was almost dried. The first treatment (T1) (86 mM NaCl) with a salinity level equal to 0.1% of the pots dry weight (86 mM NaCl) had the highest rates in all obtained data from the different organs of the plant. It was confirmed with comparison of data (average dry weight of roots, stems and leaves along with a total biomass in different treatments) and it can be said that T1 has more growth in comparison to the others (Figure 1). These results coincide with those obtained by Panahi (2012) studying Salsolaorientalis, Daoud et al. (2013) in the investigation of halophytes response to salt and Brakezet al. (2013) studying Chenopodiumquinoa. They also expressed that maximum growth occurred in low and moderate salinity. As a result, the salinity decrease efficiency of the roots in providing nutrients and water to other organs declines shoot growth, reduces the organogenesis and production of dry matter, leads to reduced nutrient transport and ultimately leads to a reduction in root and stem weight (Daoudet al., 2013). The decline in growth as a result of high soil salinity is mainly attributed to osmotic inhibition of water uptake, accumulation of ions such as Na + or Cl - in pant cells and insufficient uptake of essential nutrients (Munns and Tormaat, 1986). The response of the plants to different levels of salinity was traduced at the scale of the whole plant by the simulation of biomass, expressed by production of dry matter, at low and moderate salinities and a progressive decrease of biomass weight in high salinity treatments. It is a typical reaction of halophytes to saline stress (Kelley et al., 1982; Glenn and O’Leary,
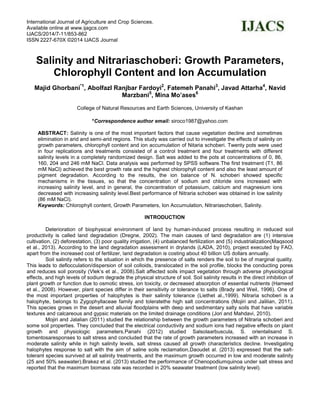
- 3. Intl J Agri Crop Sci. Vol., 7 (11), 853-862, 2014 855 1984; Munns and Termatt, 1986; Mass, 1987; Gorham, 1996; Munns, 2002; in Daoudet al., 2013). Plant’s root has importance in plants survival in the presence of salts due to the ability of the root system to control the entry of ions to shoots (Hajibagheri et al., 1989), and the lack of water uptake by plants due to high salinity causes reduced shoot and root growth(Werner and Finkelstein, 1995). Table1.Results of analysis of variance for the impact of NaCl stress on growth parameters in Nitrariaschoberi M.S dfS.O.V Dry biomass Leaf DWStem DWRoot DW Fresh biomass Leaf FWStem FWRoot FW 19.754* 0.999* 0.926ns 7.937* 91.419* 14.565ns 3.936ns 18.318* 4Salinity 5.0210.2260.5111.95126.1224.8211.5735.73615Error * Significant in P<0.05, ns non-significant Figure 1.Salinity effects on growth parameters in Nitrariaschoberi Chlorophyll content Based on the analysis of variance, chlorophyll “a” and total chlorophyll showed a very significant relationship (P<0.01) with increasing salinity (Table 2). Chlorophyll “b” also showed a significant relationship (P<0.05) with increasing salinity. Duncan test results also showed that chlorophyll “a” increased with increasing salinity levels to first treatment (T1, 86 mMNaCl) butdecreased with further increases in salinity levels (Figure 2.1). According to the analysis of variance, pigment degradation has showed a very significant relationship (P<0.01) with increasing salinity levels (Table 2). Results of Duncan test also showed that pigment degradation decreased with increasing salinity levels to first treatment (T1, 86 mMNaCl) and increased with further increases in salinity levels (Figure 2.4). These results were confirmed by Abbasi et al. (2009) studying Rubia tinctorum. They concluded that chlorophyll content increased up to 15dS.m -1 and then decreased with increasing salinity levels. Table2. Results of analysis of variance for the impact of NaCl stress on chlorophyll contents in N. schoberi. S.O.V df M.S chlorophyll a chlorophyll b total chlorophyll pigment degradation salinity 4 0.017** 0.005* 0.038** 4199.903** error 15 0.002 0.001 0.004 433.685 ** Significant in P<0.01, * Significant in P<0.05. c a ab bc abc ab a ab ab b b a b b b b a ab b b 0 2 4 6 8 10 12 0 86 160 204 246 DW(g) mM NaCl 2. Plant Dry Weight Root Stem Leaf Total biomass b a ab b b ab a b ab bb a b b b b a b b b 0 5 10 15 20 25 30 0 86 160 204 246 FW(g) mM NaCl 1. Plant Fresh Weight Root Stem Leaf Total biomass
- 4. Intl J Agri Crop Sci. Vol., 7 (11), 853-862, 2014 856 Figure 2. Effects of salinity on chlorophyll content in Nitrariaschoberi. It is possible that in high concentrations of salts, the binding of chlorophyll and chloroplast proteins are loose and chlorophyll is destroyed due to the effect of ions on proteins (Abbasi et al.,2009). Chlorophyll contentincrease can be partly attributed to leaf thickness increase in saline environments (Abbasiet al.,2009). Ion accumulation Sodium (Na + ) Analysis of variance revealed a significant effect (P<0.05) of salinity on the concentration of sodium ion in different plant organs in N.schoberi(Table 3, Figure 3). According to the comparison of different levels of salinity, it can be concluded that a strong and direct relationship exists between increasing salinity and content of sodium ions in different plant organs (Figure 3). Through various organs, leaves have the highest sodium rates and roots have the lowest rate. So that the highest concentration of sodium ions in different organs (root, stem and leaf) was observed in the highest level of salinity (T4, 246 mM NaCl) (22856.78, 25840.02 and 131250.00ppm respectively) and the lowest values were recorded in control (15797.22, 17286.12 and 67500.00ppm, respectively). Also among the measured ions, sodium had one of the highest values. With this regard, the greatest accumulation of sodium by plants at high salt concentration may be attributed to the damage of plant cells protoplasm and, as a result of the selective salt absorption, is replaced by passive absorption which causes abnormal accumulation of salts in plant organs (Kader and Lindberg, 2005). Khan et al. (2009) proved that specific ions such as sodium may have toxic effects on plants: reducing growth or causing damage to cells and membranes.These results coincide with those obtained by Daoud et al. (2013) in the investigation of halophytes response to salt, Brakezet al. (2013) studying c a ab b ab 0 0.05 0.1 0.15 0.2 0.25 0 86 180 204 246 (mg/100mL) mM NaCl 2. Chlorophyll b c a b bc bc 0 0.05 0.1 0.15 0.2 0.25 0.3 0.35 0.4 0 86 180 204 246 (mg/100mL) mM NaCl 1. Chlorophyll a c a b bc bc -100 -90 -80 -70 -60 -50 -40 -30 -20 -10 0 0 86 180 204 246 )%( mM NaCl 4. Pigment degradation c a b bc bc 0 0.1 0.2 0.3 0.4 0.5 0.6 0 86 180 204 246 (mg/100mL( mM NaCl 3. Total chlorophyll
- 5. Intl J Agri Crop Sci. Vol., 7 (11), 853-862, 2014 857 Chenopodiumquinoa and Tawfik et al. (2013) studying Leptochloafusca and Sporobolusvirginicus. They expressed that Na + concentration increased with increasing salinity levels. Table3. Results of analysis of variance for the impact of NaCl stress on ions accumulation in Nitrariaschoberi. S.O.V salinity error M.S df 4 15 Sodium Root 3.439×107* 1.117×107 Stem 4.323×107* 1.299×107 Leaf 3.160×10⁹** 8.890×10⁷ Chloride Root 3.401×10⁷** 1.136×10⁸ Stem 1.601×10⁹** 8.208×10⁶ Leaf 1.675×10⁹** 4.102×10⁶ Potassium Root 1.129×108* 3.111×107 Stem 1.695×10⁷ns 1.003×10⁷ Leaf 2.638×10⁸** 2.366×10⁷ Calcium Root 7.951×108* 2.013×107 Stem 1.636×10⁷ns 4.388×10⁷ Leaf 5.228×10⁸** 7.264×10⁸ Magnesium Root 6.688×10⁸** 1.245×10⁸ Stem 3.014×10⁷ns 1.149×10⁷ leaf 3.679×10⁸** 2.207×10⁷ ** Significant in P<0.01, * Significant in P<0.05, ns non-significant Figure 3.Effects of salinity on sodium content in Nitrariaschoberi. Chloride (Cl - ) The results well confirm the influence of salinity on chloride concentrations in various organs of N.schoberi and causes a very significant increase (P<0.01) in the concentration of chloride (Figure 4, Table 3). Statistical comparison shows that the chloride concentration of various organs increased directly with increasing salinity. Treatment 4 (246 mM NaCl) has obtained the highest rate of chloride concentration (23193.33, 66473.75 and 146881.30ppm in root, stem and leaf, respectively) and control has showed the lowest rate of chloride accumulation (16063.75, 22365.00 and 96156.19ppm, respectively) (Figure 4). The chloride accumulation of leaf was higher than other tissues. Flowers et al. (1977) and Greenway and Munns (1980) (in Koyroet al., 2008) reported that halophytes need an excess of salt for maximum growth and for maintaining low solute potentials. The accumulation of NaCl consumes much less energy than needed for the osmotic adjustment with compatible organic solutes (Yeo, 1983). These results coincide with those obtained by Daoud et al. (2013) in the investigation of halophytes response to salt stress in which Cl - concentration increased with increasing salinity levels. b b ab ab a 0 5000 10000 15000 20000 25000 0 86 160 204 246 ppm mM NaCl 1. Root Na Content b a ab a a 0 5000 10000 15000 20000 25000 30000 0 86 160 204 246 ppm mM NaCl 2. Stem Na Content b b a a a 0 20000 40000 60000 80000 100000 120000 140000 0 86 160 204 246 ppm mM NaCl 3. Leaf Na Content
- 6. Intl J Agri Crop Sci. Vol., 7 (11), 853-862, 2014 858 Figure 4.Effects of salinity on chloride content in Nitrariaschoberi. Potassium (K + ) Results indicate a significant inverse effect of salinity on potassium ions concentration in different organs of N. schoberi. Comparison results indicate that the concentrations of potassium in leaves of this species increased very significantly (P<0.01) up to the first treatment (86 mM NaCl) and then decreased with increasing salinity levels (Figure 5, Table 3). Concentrations of potassium in roots also increased significantly (P<0.05) up to first treatment (86 mM NaCl) and then decreased with increasing salinity levels (Figure 5, Table 3). Potassium concentration in the stem didn’t show a significant difference in different treatments (Table 3). Na + concentration affects K + and Ca 2+ absorption, which were in low concentrations compared to Na + (Brakezet al., 2013). Potassium is considered as one of the primary osmotic substances which contribute to osmotic adjustment in many plant species (Ashraf et al., 2001). Higher potassium levels in plants are beneficial in achieving a better plant survival with improved plant growth under saline stress (Sangakkaraet al., 2001; Umar, 2002). These results coincide with those obtained by Daoud et al. (2013) in the investigation of halophytes response to salt stress and Tawfiketal. (2013) studying Leptochloafusca and Sporobolusvirginicus. They declared that K + concentration decreased with increasing salinity levels. Figure 5.Effects of salinity on potassium content in Nitrariaschoberi. Calcium (Ca 2+ ) Results indicate a significant inverse effect of salinity on calcium ions concentration in different organs of N.schoberi. Comparison results indicate that calcium concentration in the leaves of this species increased very significantly (P<0.01) up to first treatment (86 mM NaCl) and then decreased with increasing salinity levels (Figure 6, Table 3). Calcium Concentration of roots also increased significantly (P<0.05) up to first treatment (86 mM NaCl) and then decreased with increasing salinity levels (Figure 6). Calcium concentration of stem didn’t show a significant difference in different treatments. The accumulation of calcium in root was higher than other tissues. The c bc ab a 0 5000 10000 15000 20000 25000 0 86 160 204 ppm mM NaCl 1. Root Cl content d d c b a 0 10000 20000 30000 40000 50000 60000 70000 0 86 160 204 246 ppm mM NaCl 2. Stem Cl content c b ab a a 0 20000 40000 60000 80000 100000 120000 140000 160000 0 86 160 204 246 ppm mM NaCl 3. Leaf Cl content a a b ab b 0 5000 10000 15000 20000 25000 30000 35000 0 86 160 204 246 ppm mM NaCl 1. Root K Content a a a a a 0 10000 20000 30000 40000 0 86 160 204 246 ppm mM NaCl 2. Stem K Content c a ab c bc 0 10000 20000 30000 40000 50000 0 86 160 204 246 ppm mM NaCl 3. Leaf K Content
- 7. Intl J Agri Crop Sci. Vol., 7 (11), 853-862, 2014 859 Na + ion uptake by plant limits the absorption of essential ions such as K + and Ca 2+ (Jendoubi, 1997). The Ca 2+ increased salt tolerance of Plants (Munns et al. 1983; Epstein 1998) by its function in maintaining membrane integrity and controlling the selectivity of plant ion uptake and transport under saline conditions (Lauchli and Wieneke, 1979; Lynch and Lauchli, 1985; Marschner, 1995). Calcium plays a vital role in maintaining membrane stability and permeability (Mengel and Kirkby, 1987). The Mg 2+ is an important element occupying a central position in the chlorophyll molecule, thereby affecting the concentration of chlorophylls “a” and “b” in the green plant tissues (Yasseen and Al-Thani, 2007). The results of this study coincide with those obtained by Daoud et al. (2013) in the investigation of Spartina alterniflora and Tawfik et al. (2013) studying Leptochloafusca and Sporobolusvirginicus. They expressed that Ca 2+ concentration decreased with increasing salinity levels. Figure 6.Effects of salinity on calcium content in Nitrariaschoberi. Magnesium (Mg 2+ ) Salinity levels that used in the present study affected very significantly (P<0.01) on the accumulation of magnesium in leaves and roots of N. schoberi (Table 3). Although there was no significant effect of salinity on the rate of this parameter in the stems. The Statistical comparison suggests that magnesium accumulation in leaves and roots significantly (P<0.01) increased with increasing salinity levels compared with control, however, no significant differences were observed between the different levels of salinity (Figure 7). StudyingLeptochloafusca and SporobolusvirginicusTawfiket al. (2013) noted to no effect of salinity increase in Mg 2+ concentration. The results of the statistical comparison of means shows that the effects of salinity on the magnesium ion concentration in the roots are more than stems and leaves (Figure 7).The Mg 2+ is an essential constituent of chlorophyll and some glycolysis enzymes, its concentration increased with increasing water salinity concentration in the culture medium, for this reason plants did not show any chlorosis symptoms due to Mg 2+ deficiency up to treatment 4 (246 mM NaCl). The Mg 2+ is an important element occupying a central position in the chlorophyll molecule, thereby affecting the concentration of chlorophylls “a” and “b” in the green plant tissues (Yasseen and Al-Thani, 2007). Figure 7.Effects of salinity on magnesium content in Nitrariaschoberi. b a ab ab b 0 20000 40000 60000 80000 100000 120000 140000 0 86 160 204 246 ppm mM NaCl 1. Root Ca content a a a a a 50000 51000 52000 53000 54000 55000 56000 57000 58000 0 86 160 204 246 ppm mM NaCl 2. Stem Ca content a a b b b 0 10000 20000 30000 40000 50000 60000 70000 80000 90000 0 86 160 204 246 ppm mM NaCl 3. Leaf Ca content b a a a a 0 10000 20000 30000 40000 50000 60000 70000 0 86 160 204 246 ppm mM NaCl 1. Root Mg content a b b ab b 0 5000 10000 15000 20000 0 86 160 204 246 ppm mM NaCl 2. Stem Mg content b a a a a 0 5000 10000 15000 20000 25000 30000 35000 0 86 160 204 246 ppm mM NaCl 3. Leaf Mg content
- 8. Intl J Agri Crop Sci. Vol., 7 (11), 853-862, 2014 860 Relationship between ions Increasing salinity, the ratio of potassium ions to sodium ions were significantly decreased and treatment 1 (86 mMNaCl) had the highest value (Figure 8.1, Table 4). There is no significant difference between treatment 1 and control (Figure 8.1). A similar trend is seen in the ratio of calcium ions to sodium ions (Figure 8.2, Table 4). Treatment 1 is achieved the highest ratio of magnesium ion to sodium ion (Figure 8.3). Besides the high relative water content (Ghorbaniet al., 2014), Ca 2+ /Na + ratio increase (in treatment 1, 86 mM NaCl) has supported these results (best performance of N. schoberi in the first treatment). These conditions prevent Ca 2+ deficiency induced by Na + and improve growth stimulation of plants (Marschner, 1995). The survival of halophytes in high Na + concentrations conditions depends on their capacity to maintain low Na + concentrations and high K + /Na + in the cytoplasm level (Blumwaldet al., 2000). Exclusion of Na + (in salt excluders) and/or its compartmentation in the vacuole for osmotic role (in salt includers) are strategies to maintain a high K + /Na + (Greenway and Munns, 1980; Blumwaldet al., 2000). Potassium is considered as one of the primary osmotic substances which contribute to osmotic adjustment in many plant species (Ashraf et al., 2001). Sustained K + /Na + selectivity is therefore proposed as a physiological marker for the ionic component of salt stress, providing ion homeostasis in growing roots (Muhling and Lauchli, 2001). Table 4. Results of analysis of variance for the impact of NaCl stress on ions relationships. S.O.V df M.S K/Na Ca/Na Mg/Na Salinity 4 0.205** 1.103** 0.042ns error 15 0.005 0.051 0.020 ** Significant in P<0.01, ns non-significant Figure 8.The effect of salinity on the relationship ofions in Nitrariaschoberi. In order to mediate osmotic adjustment, achieve low water potential gradient from substrate to different parts of the plants, protect subcellular structures and reduce oxidative damage caused by free radicals that are produced in response to high salinity, compatible solutes, especially in salt excluding species, and at lower degree for salt including ones, are synthesizes by plants as a metabolic response to salt stress (Hong et al., 1992; Hare et al., 1998). The synthesis of organic solutes, which can be alcohols; soluble carbohydrates or organic acids, is energy demanding (Luttge, 2002; Koyroet al., 2008) and the formation of these solutes deceases the energy status of the plant and can lead to decreases of growth in high saline condition (Koyro, 1997; Koyro and Huchzermeyer, 1999a). Lacerda et al. (2005) reported that the greatest salinity tolerance observed in plants under saline conditions was associated with higher K + /Na + ratio and greater capacity for osmotic adjustment. CONCLUSIONS Looking over the data, it is clear that the studied species is capable of tolerating salinity. Best performance of Nitraria schoberi was obtained in low salinity (86 mM NaCl). However, increasing salinity more than the optimal rate, the growth efficiency of plant decreased. Finally, it can be stated that N.schoberi is suitable for saline b a ab ab b 0 0.2 0.4 0.6 0.8 1 0 86 160 204 246 mM NaCl 3. Mg/Na a a b b b 0 0.5 1 1.5 2 2.5 0 86 160 204 246 mM NaCl 2. Ca/Na a a b b b 0 0.2 0.4 0.6 0.8 1 0 86 160 204 246 mM NaCl 1. K/Na
- 9. Intl J Agri Crop Sci. Vol., 7 (11), 853-862, 2014 861 conditions and capable of growing in such detrimental conditions, but further investigations are needed to evaluate its performance in different conditions and under multi-stress situations. ACKNOWLEDGMENT We are thankful of Kashan University, Engineer NazarZadeh and Engineer Tofighi for all their guides. REFERENCES Ashraf M, Nazir N, McNeilly T. 2001. Comparative Salt Tolerance of Amphidiploids and Diploid Brassica species. Plant Sci. 160: 683-689. Blumwald EA, Gilads A, Maris PA.2000. Sodium transport in plant cells. BiochemBiophysActa, 1465: 140-151. Brady NC, Weil RR.1996. The Nature and Properties of Soils, 11th ed. Prentice-Hall, Englewood Cliffs, NJ. Brakez M, El Brik K, Daoud S, Harrouni MCh.2013. Performance of Chenopodiumquinoa Under Salt Stress. Development in soil salinity assessment and reclamation, Springer publisher: 463-478. Daoud S, Koyro HW, Harrouni MC.2013. Salt response of halophytes with potential interest in food crops and reclamation of saline soils: Growth, water relations, mineral content and anatomical adaptation. Development in soil salinity assessment and reclamation, springer publisher: 543-560. Dregne HE.2002. Land degradation in the drylands. Arid Land Res Manage, 16: 99-132. Ghorbani M, RanjbarFardoyi A, Panahi F, Attarha J, Marzbani N. 2014. Investigation of salt stress effects on relative water content and chlorophyll content in Nitrariaschoberi. 4th international conference on Environmental Challenges and Dendrochronology, Sari Agricultural Sciences and Natural Resources University, Iran. May 2014. Greenway H, Munns R.1980. Mechanisms of salt tolerance in non-halophytes. Annu Rev Plant Physiol, 31: 149-190. In: Daoud S., Koyro H.W., Harrouni M.C., 2013. Salt response of halophytes with potential interest in food crops and reclamation of saline soils: Growth, water relations, mineral content and anatomical adaptation. Development in soil salinity assessment and reclamation, springer publisher: 543- 560. Hajibagheri MA, Yeo AR, Flowers TJ, Collins JC.1989. Salinity resistance in Zeamays. Fluxes of potassium, sodium and chloride cytoplasmic concentrations and microsomal membrane lipids. Plant Cell Environ. 12: 753-757. Hameed M, Naz N, Sajid M, Ahmad A, Din I, Riaz A. 2008. Morphological adaptation some grasses from the salt range of Pakistan. Pak J Bot. 40(4): 1571-1578. Hare PD, Cress WA, Van Sraden J.1998. Dissecting the roles of osmolyte accumulation during stress. Plant Cell Environ, 21: 535-554. Hong B, Barg R, Ho TH.1992. Development and organ specific expression of an ABA-and stress- induced protein in barley. Plant MolBiol, 18: 663-674. Jendoubi S.1997. Contribution a la caracterisationphysiologiqueetbiochimique de paroisracinaires chez 2 especes de ble: Triticumdurum (Ben Bechir) et Triticumaestivum (Tani) cultivees en milieu salin. DEA de la Faculte des Sciences de Tunis, Tunis, p 86. In: Brakez M., El Brik K., Daoud S., HarrouniM.Ch., 2013. Performance of Chenopodiumquinoa Under Salt Stress. Development in soil salinity assessment and reclamation, Springer publisher: 463-478. Jori MH, Mahdavi M.2010. Functional identification of range plants. Ayiizh publications. In Persian. Kader MA, Lindberg S.2005. Uptake of sodium in protoplasts of salt-sensitive and salt-tolerance cultivars of rice, Oryzasativa L. determined by the fluorescent dye SBFI. J Exp Bot, 56 (422): 3149-3158. In: Daoud S., Koyro H.W., Harrouni M.C., 2013. Salt response of halophytes with potential interest in food crops and reclamation of saline soils: Growth, water relations, mineral content and anatomical adaptation. Development in soil salinity assessment and reclamation, springer publisher: 543-560. Khan MA, Shirazi MU, Alikhan MA, Mujtaba SM, Islam E, Mumatz S, Shereen A, Ansarir U, Ashraf SY.2009. Role of proline, K/Na ratio and chlorophyll content in salt tolerance of wheat. Pak J Bot, 41 (2): 633-638. In: Daoud S., Koyro H.W., Harrouni M.C., 2013. Salt response of halophytes with potential interest in food crops and reclamation of saline soils: Growth, water relations, mineral content and anatomical adaptation. Development in soil salinity assessment and reclamation, springer publisher: 543-560. Koyro HW, Geisler N, Hussain S, Huchzermeyer B.2008. Survival at extreme locations: life strategies of halophytes- the long way from system ecology, whole plant physiology, cell biochemistry and molecular aspects back to sustainable utilization at field sites. Koyro HW, Huchzermeyer B.1999a. Salt and drought stress effects on metabolic regulation in maize. In: Daoud S., Koyro H.W., Harrouni M.C., 2013. Salt response of halophytes with potential interest in food crops and reclamation of saline soils: Growth, water relations, mineral content and anatomical adaptation. Development in soil salinity assessment and reclamation, springer publisher: 543-560. Koyro HW.1997. Ultrastructural and physiological changes in root cells of sorghum plants (Sorghum bicolor X S. sudanensis cv. Sweet Sioux) induced by NaCl. J Exp Bot, 48: 693-706. In: Daoud S., Koyro H.W., Harrouni M.C., 2013. Salt response of halophytes with potential interest in food crops and reclamation of saline soils: Growth, water relations, mineral content and anatomical adaptation. Development in soil salinity assessment and reclamation, springer publisher: 543-560. Lacerda CF, Cambraia J, Oliva MA, Ruiz HA.2005. Changes in growth and in solute concentrations in sorghum leaves and roots during salt stress recovery. Environ Exp Bot, 54 (1): 69-76. In:Daoud S., Koyro H.W., Harrouni M.C., 2013. Salt response of halophytes with potential interest in food crops and reclamation of saline soils: Growth, water relations, mineral content and anatomical adaptation. Development in soil salinity assessment and reclamation, springer publisher: 543-560. LADA.2010. Land degradation assessment in drylands. Online at http://www.fao.org/nr/lada/, Accessed Feb 2010. Lauchli A, Wiencke A.1979. Studies on growth and distribution of Na+ , K+ and Cl- in soybean varieties differing in salt tolerances. Z. Pflanzenernaehr. (Bd). 142: 3-13. Lieth H, Moschenko M, Lohmann M, Koyro HW, Hamdy A.1999. Halophyte Uses in Different Climates. I. Ecological and Ecophysiological Studies. Backhuys Publishers, Leiden, 258 pp. Luttge U.2002. Mangroves. In: Daoud S., Koyro H.W., Harrouni M.C., 2013. Salt response of halophytes with potential interest in food crops and reclamation of saline soils: Growth, water relations, mineral content and anatomical adaptation. Development in soil salinity assessment and reclamation, springer publisher: 543-560. Lynch J, Lauchli V.1998. Salt stress disturbs the calcium nutrition of barley (Hordeumvulgar L.). New phytol, 99: 345-354. In: Daoud S., Koyro H.W., Harrouni M.C., 2013. Salt response of halophytes with potential interest in food crops and reclamation of saline soils: Growth,
- 10. Intl J Agri Crop Sci. Vol., 7 (11), 853-862, 2014 862 water relations, mineral content and anatomical adaptation. Development in soil salinity assessment and reclamation, springer publisher: 543-560. Maqsood MA, Hussain S, Aziz T, Ashraf M.2013. Sustainable agriculture through integrated soil fertility management on degraded lands. Development in soil salinity assessment and reclamation, Springer publisher: 759-768. Marschner H. 1995. Mineral nutrition of higher plants. Academic, London/San diego/New York/Boston/Sydney/Tokyo/Toronto: p 889. Mengel K, Kirkby EV.1987. Principle of plant nutrition. International Potash Institute, Berne. In: Tachbibi N., Daoud S., Harrouni M.C., 2013. Biology and physiology of Avicennia marina in the coastal conditions of southern Morocco. Development in soil salinity assessment and reclamation, springer publisher: 561-576. Mohr E.1969. Atrexeyevquantitive analysis Mosciow. Mojiri A, Jalalian A.2011. Relationship between growth of Nitrariaschoberi and some soil properties. The Journal of Animal & Plant Sciences, 21(2), 246-250. Muhling KH, Lauchli A. 2001. Physiological traits of sodium toxicity and salt tolerance. In: 37. Munns R, Tormaat A.1986. Whole plant response to salinity. Aust J Plant Physiol, 13: 143-160. Ouiza DJ, Samia B, Moulay B.2011. Biochemical response of two Atriplex species (Atriplexhalimus L. and Atriplexcanescens (Pursh) Nutt.) under salt stress conditions. International Journal of Plant Physiology and Biochemistry, 3(10): 163-168. Panahi F. 2012. Investigation of salt tolerance in three species of Salsola in laboratory and natural conditions. PhD. thesis. Tehran University, Iran (in Persian). Sallam GAH.2007. Utilizing expert system for comprehensive management of saline sodic clay soils. In Sallam A.H., Nasralla M.R., Ragab M.A., 2013. Water use efficiency for leaching saline-sodic clayey soils: case study of Tina plain area of Egypt. Development in soil salinity assessment and reclamation, springer publisher. 736-747. Sangakara UR, Frehner M, Nosberger J.2001. Influence of soil moisture and fertilizer potassium on the vegetative growth of mung bean (Vigna radiate L. Wilczek) and cow pea (Vignaunguiculata L. Walp). J Agron Crop Sci, 186: 73-81. Tawfik MM, Thalooth AT, Zaki NM.2013. Exploring saline land improvement through testing Leptochloafusca and Sporobolusvirginicus in Egypt. Development in soil salinity assessment and reclamation, Springer publisher: 615-629. Umar SM.2002. Genotypic differences in yield and quality of groundnut as affected by potassium nutrition under erratic rainfall conditions. J Plant Nutr, 25: 1549-1562. Vlek’s PLG, Hillel D, Braimoh AK.2008. Soil degradation under irrigation. In: Hadji F., Guasmi I., Djabri L., 2013. Suitability of surface water from MouillahWadi of Algeria for irrigation purposes. Development in soil salinity assessment and reclamation, springer publisher.722-735. Werner JE, Finkelstein RR.1995. Arabidopsis mutants with reduced response to NaCl and osmotic stress, Physiol. Plant. 93: 659-666. Wilson JR.1983. Effect of water stress on invitiro dry matter digestibility and chemical composition of herbage of tropicalpasture species. Aust, J. Agric. Res. 39: 377-390. Yasseen BT, Al-Thani RF. 2007. Halophytes and associated properties of natural soils in the Doha area, Qatar. AquatEcosyst Health Manage, 10: 320-326. Yeo AR.1983. Salinity Resistance: Physiology and Prices. Physiol. Plant. 58: 214-222.