Positive psychology 2011
•
1 gostou•677 visualizações

Positive psychology 2011 Different Cultures

Recomendados
Mais conteúdo relacionado
Mais procurados
Mais procurados (12)
Destaque
Semelhante a Positive psychology 2011
Semelhante a Positive psychology 2011 (20)
Mais de Dawn Perry
Último
Último (20)
Positive psychology 2011
- 1. Emotion © 2011 American Psychological Association 2011, Vol. 11, No. 4, 994 –999 1528-3542/11/$12.00 DOI: 10.1037/a0021332 BRIEF REPORT Are Positive Emotions Just as “Positive” Across Cultures? Janxin Leu, Jennifer Wang, and Kelly Koo University of Washington Whereas positive emotions and feeling unequivocally good may be at the heart of well-being among Westerners, positive emotions often carry negative associations within many Asian cultures. Based on a review of East-West cultural differences in dialectical emotions, or co-occurring positive and negative feelings, we predicted culture to influence the association between positive emotions and depression, but not the association between negative emotions and depression. As predicted, in a survey of over 600 European-, immigrant Asian-, and Asian American college students, positive emotions were associated with depression symptoms among European Americans and Asian Amer- icans, but not immigrant Asians. Negative emotions were associated with depression symptoms among all three groups. We also found initial evidence that acculturation (i.e., nativity) may influence the role of positive emotions in depression: Asian Americans fell “in between” the two other groups. These findings suggest the importance of studying the role of culture in positive emotions and in positive psychology. The use of interventions based on promoting positive emotions in clinical psychology among Asian clients is briefly discussed. Keywords: positive emotions, culture, depression, East Asians, dialectical emotions The field of emotions is abuzz with evidence that positive (i.e., middle-class European American) positive feelings are emotions may not only benefit recovery from depression, but also associated with individual success, high self-esteem, and good contribute to mental health flourishing (Fredrickson & Cohn, health (Heine, Lehman, Markus & Kitayama, 1999; Kitayama, 2008; Lyubomirsky, King, & Diener, 2005; Richman, Kubzansky, Markus, & Kurokawa, 2000; Taylor & Brown, 1988). However, Maselko, Kawachi, Choo, & Bauer, 2005). For example, Fredrick- positive emotions like happiness are not viewed as unequivo- son and her colleagues (2003) demonstrated that positive emotions cally “good” in many Asian cultural contexts. For example, mediate the association between resilience before a crisis and the Japanese are more likely than European Americans to associate later decrease in depression symptoms. These examples of positive happiness with negative social consequences, such as jealousy psychology, along with evidence of negative emotions, strengthen in others and disharmony in social relationships (Uchida & the argument that emotions influence disease expression (Kiecolt- Kitayama, 2009). The emotional goal toward positive emotions Glaser, McGuire, Robles, & Glaser, 2002). However, they also in many Asian cultural contexts is of moderation instead of raise the question, “Are positive emotions so positive across cul- maximization, and may be informed by the Buddhist belief that tures?” Most studies of positive emotions to date include only pure pleasantness either leads to suffering or is impossible to Western samples. However, when diverse samples are included in obtain (Schimmack, Oishi, & Diener, 2002; Spencer-Rodgers, studies of emotion, there is strong evidence of cultural differences. Williams, & Peng, 2010; Uchida, Norasakkunkit, & Kitayama, For example, there is evidence of East-West cultural differences in 2004). dialectical emotions, or simultaneous reports of positive and neg- For example, in multiple studies, Asians report equal levels of ative feelings (i.e., feeling both happy and sad). We suggest that pleasant and unpleasant feelings, in contrast to North Americans positive emotions may be more beneficial in the mental health of who report more positive emotions (Mesquita & Karasawa, 2002; some Western populations than in Asian ones. Kitayama et al., 2000). In a large multinational study, researchers also find a strong negative correlation between positive and neg- Culture and Positive Emotions ative feelings in Western samples (i.e., feeling either happy or sad, but not both), but a significantly weaker association, no associa- Cross-national comparisons show cultural variation in posi- tion, or even a positive correlation among some Asian cultural tive emotions. For example, in many Western cultural contexts contexts (Schimmack et al., 2002). This article was published Online First March 28, 2011. Greater Cultural Differences in Positive Than Janxin Leu, Jennifer Wang, and Kelly Koo, Department of Psychology, Negative Emotions University of Washington. Correspondence concerning this article should be addressed to Janxin Recent experimental evidence suggests that the greater report of Leu, Department of Psychology, University of Washington, Box 351525, dialectical emotions among Asians, compared with European Seattle, WA 98105. E-mail: janleu@uw.edu Americans, may specifically be due to differences in the meaning 994
- 2. POSITIVE EMOTION CULTURE 995 of positive and not of negative emotions. Miyamoto and colleagues role of positive emotions in depression when comparing European (2010) showed that Japanese participants reported more simulta- Americans with immigrant Asians, then differences between Eu- neous positive and negative emotions than European Americans ropean Americans and Asians (in Asia) were likely to be even only in positive and not in negative situations. Similarly, Leu and more significant. colleagues (2009) demonstrated that in positive, but not negative, situations the correlation between positive and negative emotions Present Study was more negative among European Americans than among Chi- nese or Japanese. These provocative data suggest that in positive Methods situations, Asians may “find the bad in the good” more than European Americans, whereas both Asians and European Ameri- Participants. We compared 330 European American, 156 cans seem to “find the good in the bad” in negative situations. immigrant Asian, and 147 Asian American (N ϭ 633) college These data further suggest greater cultural variation in the influ- students from a public university in the US who participated for ence of positive, rather than negative, emotions on mental health. extra course credit. European American participants were at least third-generation; Asian Americans were all born in the US The Role of Acculturation to immigrant parents; and immigrant Asian participants came to the United States at an average age of 11 years (SE ϭ 0.47). The New evidence using bicultural samples suggests that cultural largest Asian ethnic groups were Chinese, Korean, and Viet- differences in emotion can also occur within a single national namese, although the sample also included South Asians. context. For example, Perunovic and her colleagues (Perunovic, Procedure. All participants completed an hour-long survey Heller, & Rafaeli, 2008) found that Asian-Canadian college on a computer on measures of perceived stress, emotions, fre- students who were shown Canadian primes reported fewer quency of depression symptoms, and demographics. dialectical emotions than those who were shown Asian primes. Measures There is also evidence that the early emotional socialization of Demographics. Socioeconomic status was measured using Asian American biculturals may mirror the emotional practices the MacArthur Scale of Subjective Social Status, which captures of immigrant Asians. Tsai and her colleagues demonstrated that relative social rank (Adler, Epel, Castallazzo, & Ickovics, 2000). young Asian American children preferred low-arousal positive Nativity was measured by participants’ country of birth (i.e., US- emotions (i.e., calmness) over high-arousal positive emotions or Asia-born); culture/ethnicity was self-identified. (i.e., excitement), compared with their European American Dependent variable. The Center for Epidemiologic Studies peers (Tsai, Louie, Chen, and Uchida, 2007). These studies Depression Scale (CES-D; Radloff, 1977) examines subclinical raise the interesting question of whether adult Asian Americans depression symptoms among general populations and was used behave emotionally like Asians in Asia or like their Western in other studies of positive emotion and depression (Fredrick- peers with regard to positive emotion expression. son et al., 2003). This measure consisted of 20 item statements focusing on frequency of depressed mood, feelings of worth- Implications for Mental Health lessness, and disturbance of appetite and sleep “in the past week,” using a scale from 1 (less than one day) to 4 (5–7 days) Thus, there is reason to predict that culture and acculturation (␣ ϭ 0.89). may influence the role of positive emotions in mental health. Are Independent variables. The Perceived Stress Scale (Cohen, positive emotions as protective among Asians as in Western sam- Kamarck, & Mermelstein, 1983) measured the global perception of ples? There is already evidence that the absence of positive self- stress “over the past month” from 1 (Never) to 5 (Very Often). Sample esteem is less predictive of depression (Heine et al., 1999) and that items included, “In the last month, how often have you been upset dialectical emotions are associated with fewer problematic physi- because of something that happened unexpectedly?” and “In the cal symptoms (Miyamoto & Ryff, in press) among Japanese than last month, how often have you felt on top of things?” (re- North Americans. However, this is the only study that directly versed) (␣ ϭ 0.86). examines the relationship between culture, positive emotions, and The Positive and Negative Emotions Schedule–X (PANAS–X; depression among European Americans and a diverse group of Watson, Clark, & Tellegen, 1998) measured how participants feel Asians. “on average” by rating the intensity of positive and negative emotions on a 5-point scale, where 1 ϭ “not at all,” 3 ϭ “mod- Predictions erately,” and 5 ϭ “extremely.” In addition, the measure examined specific positive emo- We predicted that (1) positive emotions would be significant tions such as serenity (i.e., “calm,” “relaxed,” and “at ease”; predictors of depression symptom frequency for European Amer- ␣ ϭ 0.76), joviality (i.e., “happy,” “joyful,” “delighted,” icans, but not for immigrant Asians. On the other hand, we “cheerful,” “excited,” “enthusiastic,” “lively,” and “ener- expected (2) negative emotions to be significantly associated with getic”); ␣ ϭ 0.93); self-assurance (i.e., “proud,” “strong,” “con- depression for all cultural groups. Lastly, we explored the question fident,” “bold,” “daring,” and “fearless”); ␣ ϭ 0.80), and atten- of whether US-born Asian American participants looked more like tiveness (i.e., “alert,” “attentive,” “concentrating,” “determined”, European Americans or foreign-born immigrant Asians. Using ␣ ϭ 0.71). immigrant Asian samples provided us with the additional advan- Importantly, positive emotion ratings were reliable when calcu- tage of serving as a conservative test of cultural variation. We lated only among immigrant Asians and Asian Americans (␣s ϭ reasoned that if we could demonstrate cultural differences in the 0.72 to 0.79). The two-factor structure of positive and negative
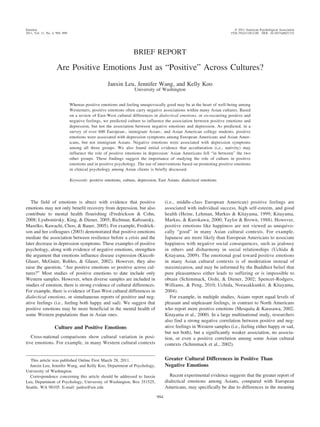
- 3. 996 LEU, WANG, AND KOO emotions was replicated among all of our samples, consistent with Culture Moderates the Influence of Positive Emotions past studies including diverse samples (Watson et al., 1988; on Depression Thompson, 2007). We used a generalized linear regression model to test our hypothesis that culture moderates the effect of positive, but not Results negative, emotions on depression. Specifically, we simultaneously regressed positive emotions, negative emotions, the interaction of Descriptives culture and emotion variables, and demographics onto the fre- quency of depression symptoms. Increases in negative emotions One-way analyses of variance (ANOVAs) with post hoc Bon- (b ϭ 0.44, SE ϭ 0.05, p Ͻ .001) and decreases in positive ferroni corrections revealed that immigrant Asians (M ϭ 0.86, emotions (b ϭ Ϫ0.33, SE ϭ 0.05, p Ͻ .001) were associated with SE ϭ .04) and Asian Americans (M ϭ 0.72, SE ϭ .04) reported greater depression symptoms. As predicted, an interaction between more frequent depression symptoms than European Americans positive emotions and culture was significant (b ϭ 0.001, SE ϭ (M ϭ 0.63, SE ϭ .03), F(2, 629) ϭ 10.94, p Ͻ .001. Consistent 0.001, p Ͻ .01), whereas there was no significant interaction with past studies, European Americans (M ϭ 3.59, SE ϭ .03) between negative emotions and culture (b ϭ 0.0001, SE ϭ 0.001, reported greater positive emotion intensity than immigrant Asians p Ͼ .05). To understand the significant culture x positive emotion (M ϭ 3.29, SE ϭ .05) or Asian Americans (M ϭ 3.30, SE ϭ .05), interaction, regression outputs were split by cultural group. As F(2, 630) ϭ 17.01, p Ͻ .001. Except for depression symptoms, for seen in Table 1, positive emotions were negatively associated with which the means were relatively close to the low end of the scale, frequency of depression symptoms among European Americans none of the variables suffered from ceiling or floor effects. and Asian Americans, but not among immigrant Asians. As seen in Figure 1, the intensity of positive emotion and Does culture moderate positive emotion mediation? To frequency of depression symptoms were negatively correlated compare our data with other models of stress and depression that among European Americans (r ϭ Ϫ0.46, p Ͻ .001) and Asian have demonstrated positive emotion mediation (Fredrickson et al., Americans (r ϭ Ϫ0.26, p Ͻ .01), but not among immigrant Asians 2003; Kiecolt-Glaser et al., 2002), we assumed a causal relation- (r ϭ Ϫ0.03, p Ͼ .05). Negative emotion intensity and depression ship between stress and emotions and between emotions and were positively correlated for all groups (rEA ϭ 0.57, p Ͻ .001; depression in our data despite the obvious limitations of using rIA ϭ 0.43, p Ͻ .001; rAA ϭ 0.52, p Ͻ .001). Evidence of a cross-sectional data. We found that positive emotion mediated dialectical relationship between positive and negative emotions stress and frequency of depression symptoms only among Euro- was found among immigrant Asians but not Asian Americans pean Americans and not immigrant Asians. On the other hand, we (rIA ϭ 0.24, p Ͻ .01; rAA ϭ 0.11, p Ͼ .05). found that negative emotions mediated stress and frequency of European Americans Asian Americans Immigrant Asians Figure 1. Scatter plots of the correlation between positive emotions and frequency of depression symptoms among European Americans (r ϭ Ϫ.46 ,)ءءءAsian Americans (r ϭ Ϫ.26 ,)ءءand Immigrant Asians (r ϭ Ϫ.03) ( ءp Ͻ .05, ءءp Ͻ .01, ءءءp Ͻ .001).
- 4. POSITIVE EMOTION CULTURE 997 Table 1 Exploring an Alternative Explanation Regression of Demographics, Positive, and Negative Emotions Tsai (2007) suggests that low-arousal positive emotions (e.g., on Mean Frequency of Depression Symptoms serenity) are preferred by East Asians, whereas high-arousal pos- Model 1 Model 2 Model 3 itive emotions (e.g., joviality, self-assurance, attentiveness, and surprise) are preferred by European Americans. Therefore, by European Asian Immigrant using a summary positive affect variable that conflated both high- American American Asian and low-arousal positive emotions, we may have overlooked the Variables B (SE) B (SE) B (SE) possibility that low-arousal positive emotions predict depression among our Asian samples. ء Intercept 0.66 (0.41) 1.05 (0.43) 0.27 (0.55) To test this alternative hypothesis, we reran the original regres- Sex 0.04 (0.04) 0.001 (0.06) Ϫ0.07 (0.09) sion analysis, replacing the summary positive affect variable with Age Ϫ0.01 (0.02) Ϫ0.02 (0.02) 0.01 (0.02) SES 0.03ء (0.01) Ϫ0.01 (0.02) 0.02 (0.03) high- or low-arousal positive affect subscales in separate models. Negative Emotion 0.40ءءء (0.04) 0.45ءءء (0.05) 0.35ءءء (0.06) We simultaneously regressed high-/low-arousal positive emotions, Positive Emotion Ϫ0.26ءءء (0.04) Ϫ0.22ءءء (0.05) Ϫ0.10 (0.06) negative emotions, the interaction of culture and emotion vari- ء ءءء ables, and demographics onto the frequency of depression symp- p Ͻ .05. p Ͻ .001. toms. We found a significant interaction effect between culture and the high-arousal subscale (b ϭ 0.001, SE ϭ 0.001, p Ͻ .01) on depression symptoms for all groups. Although not our main pre- depression symptoms. However, there was no interaction between diction, these analyses (reported in detail below) complement the culture and the low-arousal subscale (serenity). For both analyses, regression analyses reported in Table 1 in suggesting that culture there was no interaction between culture and negative affect. may moderate the role of positive, but not negative, emotions in Therefore, inconsistent with ideal affect theory, there was no depression symptom expression. evidence that culture moderated the association between low- Using a common four-step criteria test for mediation (Baron & arousal positive emotions and depression symptoms. Consistent Kenny, 1986), we found evidence that positive emotions mediated with ideal affect theory, however, when we split the regression the relationship between perceived stress and depression symp- outputs for the high-arousal subscale by cultural group, we found toms only among European Americans and not among either Asian evidence that increases in high-arousal positive emotions (i.e., group. For example, among European Americans, perceived stress joviality, self-assurance, attentiveness, and surprise) were as- was correlated with positive emotions (b ϭ Ϫ0.31, SE ϭ .05,  ϭ sociated with decreases in depression symptoms among Euro- Ϫ0.33, p Ͻ .001). Perceived stress was then correlated with pean Americans (b ϭ Ϫ0.31, SE ϭ 0.04, p Ͻ .001), but not frequency of depression symptoms (b ϭ 0.48, SE ϭ .03,  ϭ 0.63, immigrant Asians (b ϭ Ϫ0.12, SE ϭ 0.04, p Ͼ .05). Interest- p Ͻ .001). Positive emotions (b ϭ Ϫ0.23, SE ϭ 0.04,  ϭ Ϫ0.28, ingly, Asian Americans looked more similar to European Amer- p Ͻ .001) were significantly correlated with frequency of depres- icans than immigrant Asians (b ϭ Ϫ0.25, SE ϭ 0.05, p Ͻ .001). sion symptoms when controlling for perceived stress. The Sobel test was significant (Z ϭ 4.55, p Ͻ .001), indicating partial mediation by positive emotions. For immigrant Asians, although General Discussion perceived stress and frequency of depression symptoms were In a large survey of college students, we found evidence that correlated (bIA ϭ 0.52, SE ϭ 0.06,  ϭ 0.59, p Ͻ .001), perceived culture may moderate the role of positive emotions on depression. stress and positive emotions were not significantly correlated We used two kinds of analyses to demonstrate this. First, we (bIA ϭ Ϫ0.12, SE ϭ 0.09,  ϭ Ϫ0.10, p Ͼ .05) and mediation was showed that increased positive emotions were directly related to not run. For Asian Americans, perceived stress and frequency of decreases in depression symptoms among European Americans, depression symptoms were correlated (bAA ϭ 0.50, SE ϭ 0.04, but not among immigrant Asians. Also as predicted, increased  ϭ 0.69, p Ͻ .001). Positive emotions were not significantly negative emotions were associated with increases in depression correlated with frequency of depressive symptoms when control- symptoms across all groups. These findings are consistent with ling for perceived stress (b ϭ Ϫ0.002, SE ϭ 0.05,  ϭ Ϫ0.003, research on dialectical emotions, where cultural differences are p Ͼ .05). greater in positive than negative situations. Also as predicted, we found evidence that negative emotions Next, we tested whether positive feelings explained the influ- mediated the relationship between perceived stress and depression ence of stress on depression among both European Americans and symptoms among all three cultural groups. Perceived stress was Asians. There are limitations of assuming causality in data that correlated with negative emotions (bEA ϭ 0.59, SE ϭ .04,  ϭ only measures one point in time, so we need be cautious of 0.65, p Ͻ .001; bIA ϭ 0.62, SE ϭ .08,  ϭ 0.53, p Ͻ .001; bAA ϭ generalizing this evidence. Still, we found more evidence that 0.45, SE ϭ .07,  ϭ 0.48, p Ͻ .001). Perceived stress and culture influences the role of positive feelings in depression. The frequency of depression symptoms were significantly correlated influence of stress on depression was partially explained by the (see positive emotion mediation results). Negative emotions intensity of positive feelings for only European Americans. How- (bEA ϭ 0.23, SE ϭ 0.05,  ϭ 0.27, p Ͻ .001; bIA ϭ 0.13, SE ϭ ever, negative emotions partially explained the effect of stress on 0.06,  ϭ 0.17, p Ͻ .05; bAA ϭ 0.19, SE ϭ 0.05,  ϭ 0.25, p Ͻ depression for all groups. Altogether, these findings suggest that .001) were significantly correlated with frequency of depression culture may moderate the role that positive emotions play in symptoms when controlling for perceived stress. A significant mental health. Sobel test (ZEA ϭ 4.82, p Ͻ .001; ZIA ϭ 2.08, p Ͻ .05; ZAA ϭ 3.26, One may wonder if our findings are the result of positive p Ͻ .001) indicated partial mediation by negative emotions. emotions being correlated with negative emotions, such that the
- 5. 998 LEU, WANG, AND KOO association between positive emotions and depression symptoms is sality. We used subclinical depression symptoms, which have an “epiphenomon” of the correlation between negative emotion previously been used to demonstrate the protective role of positive and depression. However, the regression analyses (see Table 1) emotions among Western samples (Fredrickson et al., 2003). Pre- show that this is not the case. We also know that the positive sumably, cultural differences among clinical samples may be even emotion ratings from both Asian samples were reliable, so the more pronounced, although a clinical sample is ultimately needed. validity of the PANAS–X scale is not the reason for failing to find Despite these limitations, our findings raise the question of evidence for the effects of positive emotions among Asians. We whether positive psychology interventions (i.e., optimistic think- further ruled out the possibility that low-arousal positive emotions ing or replaying positive experiences) which typically alleviate would be significantly predictive of depression among immigrant depression symptoms for Westerners (Sin & Lyubomirsky, 2009), Asians but not European Americans (Tsai, 2007). will be similarly effective for Asians to practice. Instead, therapies We suggest that one reason why positive emotions may not be which encourage individuals to embrace both positive and nega- as “positive” for Asians as for European Americans is because of tive emotions may be more effective with Asian clients (e.g., cultural differences in the meaning assigned to positive, but not Hayes, Strosahl, & Wilson, 1999). Future longitudinal data and negative, emotions. At least two experimental studies (Leu et al., experimental studies with diverse clinical samples will contribute 2009; Miyamoto et al., 2010) have previously shown that East- to a needed body of research that addresses how culture influences West differences in emotion reports are greatest in positive, and the “good” of positive emotions, and more broadly, the role of not negative, situations. While maximizing positive emotions may culture and positive psychology in mental health. be a cultural goal in Western contexts, emotion moderation through balancing positive emotions with negative ones may be a References cultural goal in Asian contexts. Adler, N. E., Epel, E., Castallazzo, G., & Ickovics, J. (2000). Relationship of subjective and objective social status with psychological and physi- Significance of Acculturation ological functioning in preliminary data in healthy white women. Health Psychology, 19, 586 –592. The inclusion of two Asian samples (American-born and immi- Baron, R. M., & Kenny, D. A. (1986). The moderator–mediator variable grant) was important to explore whether acculturation (i.e., nativ- distinction in social psychological research: Conceptual, strategic, and ity) influences the role of positive emotions in depression. In the statistical considerations. Journal of Personality and Social Psychology, current study, there was some evidence that Asian Americans were 51, 1173–1182. similar to both European Americans and immigrant Asians, de- Cohen, S., Kamarck, T., & Mermelstein, R. (1983). A global measure of pending on the analysis. Greater positive emotions were associated perceived stress. Journal of Health and Social Behavior, 24, 385–396. with fewer depression symptoms among Asian Americans, similar Fredrickson, B. L., & Cohn, M. A. (2008). Positive emotions. In M. Lewis, to European Americans. Also, the correlation between positive J. M. Haviland-Jones, & L. Feldman Barrett (Eds.), Handbook of emo- emotions and depression was significantly negative among Asian tions (pp. 777–796). New York: Guilford Press. Americans, although the size of the correlation was smaller for Fredrickson, B. L., Tugade, M. M., Waugh, C. E., & Larkin, G. R. (2003). What good are positive emotions in crisis? A prospective study of Asian Americans than for European Americans. However, there resilience and emotions following the terrorist attacks on the United was a lack of evidence for positive emotion mediation of stress and States on September 11th, 2001. Journal of Personality and Social depression among Asian Americans, similar to immigrant Asians. Psychology, 84, 365–376. Further studies need to be conducted to better understand the role Hayes, S. C., Strosahl, K., & Wilson, K. G. (1999). Acceptance and of acculturation in the emotional behavior of biculturals. commitment therapy: An experiential approach to behavior change. New York: Guilford Press. Heine, S. J., Lehman, D. R., Markus, H. R., & Kitayama, S. (1999). Is there Practical Significance, Limitations, and Future a universal need for positive self-regard? Psychological Review, 106, Directions 766 –794. This study directly examined the relationship between culture, Kiecolt-Glaser, J., McGuire, L., Robles, T., & Glaser, R. (2002). Emotions, morbidity, and mortality: New perspectives from psychoneuroimmunol- positive emotions, and depression among European Americans and ogy. Annual Review of Psychology, 53, 83–107. a diverse group of Asians. Our immigrant Asian sample suggests Kitayama, S., Markus, H. R., & Kurokawa, M. (2000). Culture, emotion, that positive emotions may play a limited role in the mental health and well-being: Good feelings in Japan and the United States. Cognition of Asians in Asia compared with Western samples. With Asians and emotion, 14, 93–124. comprising more than 60% of the global population, these findings Leu, J., Mesquita, B., Ellsworth, P. C., Zhang, Z., Huijuan, Y., Buchtel, E., suggest the need to proceed with some caution in our claims about Karasawa, M., & Masuda, T. (2009). Situational differences in dialec- the benefits of positive emotions for everyone. Incorporating more tical emotions: Boundary conditions in a cultural comparison of North culturally diverse samples in our research on positive emotions not Americans and East Asians. Cognition & Emotion, 24, 419 – 435. only addresses concerns about generalizability, but may potentially Lyubomirsky, S., King, L. A., & Diener, E. (2005). The benefits of reveal the cultural and structural nature of positive emotions them- frequent positive affect: Does happiness lead to success? Psychological Bulletin, 131, 803– 855. selves. For example, these findings add to the literature suggesting Mesquita, B., & Karasawa, M. (2002). Different emotional lives. Cognition that positive and negative emotions are not simply bipolar oppo- and Emotion, 16, 127–141. sites and often have different predictors and consequences. Miyamoto, Y., & Ryff, C. (in press). Cultural differences in the dialectical Our data were cross-sectional, limiting our ability to interpret and non-dialectical emotional styles and their implications for health. the meditational analyses. Future studies should include a longi- Cognition and Emotion. tudinal design to gain greater confidence in the direction of cau- Miyamoto, Y., Uchida, Y., & Ellsworth, P. C. (2010). Culture and mixed
- 6. POSITIVE EMOTION CULTURE 999 emotions: Co-occurrence of positive and negative emotions in Japan and psychological perspective on mental-health. Psychological Bulletin, the United States. Emotion, 10, 404 – 415. 103, 193–210. Perunovic, W. Q. E., Heller, D., & Rafaeli, E. (2007). Within-person Thompson, E. R. (2007). Development of an internationally reliable short- changes in the structure of emotion: The role of cultural identification form of the Positive and Negative Affect Schedule (PANAS). Journal of and language. Psychological Science, 18, 607– 613. Cross-Cultural Psychology, 38, 227–242. Radloff, L. S. (1977). The CES–D scale: A self report depression scale for Tsai, J. L. (2007). Ideal affect: Cultural causes and behavioral conse- research in the general population. Applied Psychological Measurement, quences. Perspectives on Psychological Science, 2, 242–259. 1, 385– 401. Tsai, J. L., Louie, J. Y., Chen, E. E., & Uchida, Y. (2007). Learning what Richman, L. S., Kubzansky, L. K., Maselko, J., Kawachi, I., Choo, P., & feelings to desire: Socialization of ideal affect through children’s story- Bauer, M. (2005). Positive emotion and health: Going beyond the books. Personality and Social Psychology Bulletin, 33, 17–30. negative. Health Psychology, 24, 422– 429. Uchida, Y., & Kitayama, S. (2009). Happiness and unhappiness in east and Schimmack, U., Oishi, S., & Diener, E. (2002). Cultural influences on the west: Themes and variations. Emotion, 9, 441– 456. relation between pleasant emotions and unpleasant emotions: Asian Uchida, Y., Norasakkunkit, V., & Kitayama, S. (2004). Cultural construc- dialectic philosophies or individualism-collectivism? Cognition and tions of happiness: Theory and empirical evidence. Journal of Happiness Emotion, 16, 705–719. Studies, 5, 223–239. Sin, N. L., & Lyubomirsky, S. (2009). Enhancing well-being and allevi- Watson, D., Clark, L. A., & Tellegen, A. (1988). Development and ating depressive symptoms with positive psychology interventions: A validation of brief measures of Positive and Negative Affect: The practice-friendly meta-analysis Journal of Clinical Psychology: In Ses- PANAS scales. Journal of Personality and Social Psychology, 54, sion, 65, 467– 487. 1063–1070. Spencer-Rodgers, J., Williams, M. J., & Peng, K. (2010). Cultural differ- ences in expectations of change and tolerance for contradiction: A decade of empirical research. Personality and Social Psychology Re- Received April 5, 2010 view, 14, 296 –312. Revision received June 18, 2010 Taylor, S. E., & Brown, J. D. (1988). Illusion and well-being—A social Accepted June 28, 2010 Ⅲ