SlideShare uma empresa Scribd logo
1 de 4
Baixar para ler offline
Pricing Research in the Retailer Category
  Properly setting price is the most direct way to ensure optimal profitability. Improper pricing, either
  pricing too low (wherein per-unit revenue decreases faster than demand increases) or pricing too
  high (wherein demand decreases faster than per-unit revenue increases), leaves money on the table.
  The key to optimizing price is accurately measuring price-demand relationships, the functions that
  quantify how much demand will be garnered at each possible price. With accurate price-demand
  curves, basic economics 1 can be used to identify pricing that maximizes revenue or profit.

  A simple price-demand curve and its associated price-revenue curve are shown below.

                                         Price-Demand                                                                                          Price-Revenue
         75%
                                                                                                                $93.0


         65%                                                                                                    $92.5
                                                                                          Revenue (million $)


                                                                                                                $92.0
         55%
Demand


                                                                                                                $91.5                         $11.60 =
         45%
                                                                                                                                              the price that
                                                                                                                $91.0                         will maximize
         35%                                                                                                                                  revenue
                                                                                                                $90.5


         25%                                                                                                    $90.0
           $10.00 $10.50 $11.00 $11.50 $12.00 $12.50 $13.00 $13.50 $14.00 $14.50 $15.00                            $10.00 $10.50 $11.00 $11.50 $12.00 $12.50 $13.00 $13.50 $14.00 $14.50 $15.00

                                              Price                                                                                                  Price


  M/A/R/C believes the most appropriate methodology for pricing analysis—for accurately identifying
  price-demand relationships—in the retailer category is alternative-specific discrete choice analysis
  (DCA). In DCA, all relevant retailers are studied as separate alternatives in a competitive context that
  mimics the real-life options that shoppers face. DCA is highly customizable with the ability to study
  many types of effects and/or numerous prices simultaneously. As such, a final DCA model can be
  used to set multiple prices (e.g. grocery prices, household products prices, electronics prices, etc.)
  simultaneously such that overall store profit is maximized. And so the above example charts for the
  retailer optimizing numerous prices simultaneously would be multidimensional and not merely two-
  dimensional. For example, below are three-dimensional charts involving the simultaneous
  optimization of two prices.


  1 Revenue = Price * Demand; Profit = Revenue – Costs.
Price-Demand Function (2 prices)                                                                                                   Price-Revenue Function (2 prices)


           50%

           45%

           40%

           35%

           30%

           25%

% Demand   20%                                                                                                                         Revenue

            15%

            10%

             5%

             0%
                  $2

                       $6


                                                                                                                                                 $2
                            $10


                                                                                                                                                      $6
                                  $14


                                                                                                                                                           $10
                                          $18


                                                                                                                                                                 $14
                                                  $22


                                                                                                                                                                         $18
                                                         $26


                                                                                                                                                                               $22
                                                               $30


                                                                                                                       $10


                                                                                                                                                                                     $26
                                                                                                                             Price B
                                                                     $34


                                                                                                                 $20


                                                                                                                                                                                            $30
                                                                                                                                                                                                                                                    $10
                                                                           $38


                                                                                                                                                                                                  $34
                                                                                                           $30                                                                                                                                            Price B
                                                                                 $42


                                                                                                                                                                                                                                              $20


                                                                                                                                                                                                        $38
                                                                                                     $40
                                                                                       $46

                                                                                                                                                                                                                                        $30


                                                                                                                                                                                                              $42
                                                                                             $50
                                                                                               $50
                                        Price A                                                                                                                                                                                   $40


                                                                                                                                                                                                                    $46

                                                                                                                                                                                                                          $50
                                                                                                                                                                                                                            $50
                                                                                                                                                                       Price A


 A DCA model culminates in a simulator wherein prices can be set at any price along the entire
continuum of price ranges studied and not simply at the discrete price points studied as test stimuli.
Further, M/A/R/C overlays years of experience in calibrating DCA-model simulators to adjust for any
survey biases, so that predicted demand estimates are as close to true market share as possible. This
precise calibration is accomplished by using DCA in concert with M/A/R/C’s Assessor® product
forecasting methodology.

M/A/R/C’s Assessor, a proprietary forecasting methodology originally developed at MIT and proven
successful in thousands of practical applications, is one of only a few widely recognized, validated,
research-based forecasting models in existence.

Below are some highlights of the DCA methodology in the retailer category.

» The Discrete Choice Exercise for Respondents (Shoppers)
      1. Expose survey respondents to a variety of scenarios that include retailer brands that well
         represent the category and vary the average prices for relevant categories (e.g. grocery,
         clothing, electronics, etc.).
      2. Optionally, also vary other attributes of interest besides prices, such as availability of
         offerings, product features (sizes, package configuration), store features, etc.
      3. Ask survey respondents to allocate purchases across the retailers shown.

» Benefits
      1. Experimental design is utilized to select realistic combinations of levels of attributes – but also
         ensuring attributes are studied with statistical rigor (balanced and orthogonal) and then
         unique blocks of scenarios are shown to each respondent.
      2. Respondents are allowed to allocate purchases in categories where alternative options are or
         will be available in-market.
3. The test provides a realistic competitive context (multiple retailer brands in each choice
      scenario; price and other attributes customized to the brand) and influences the respondent
      to provide realistic responses to price.
   4. Gaming is not likely, due to the even-handed treatment of alternative brands.
   5. Any “over focus” on Price can be diffused by presence of other attributes.

» Potential issues
   1. DCA is more costly than other forms of pricing analysis.


In the retailer space, in addition to DCA, it can be helpful to conduct as a supplemental component to
the overall pricing assessment what is known as van Westendorp pricing analysis. For a retailer it
would be conducted for each of the category prices – again, such as grocery, clothing, electronics, etc.
– as the average of typical item’s or typical basket of goods price. The van Westendorp technique is
easy to implement, involving four questions wherein respondents directly state their expectations
regarding price levels. As such, being based on simple, direct “stated” measures, the results of van
Westendorp have high face validity; respondents are merely stating where they expect pricing to be.

While some researchers extend the basic van Westendorp method to include the identification of
what they believe to be an optimal price point, we at M/A/R/C do not believe the simple “stated”
data of the van Westendorp method can be used for such and do not use van Westendorp as a
surrogate for rigorous price-demand estimation. Instead we use the van Westendorp method only to
form a range – a window – of prices within which shoppers expect pricing to fall. For identifying
optimal pricing we rely on DCA-based price-demand relationships. However, the results from DCA are
enhanced by comparing them to the information from van Westendorp, where we can answer such
things as:

   n Does the optimal price as identified from the DCA fall within the van Westendorp acceptable
     range?
   n How wide is the range of expected pricing?
   n How sharply does acceptance fall off if price goes beyond the acceptable range?

Below is an example chart that represents the final deliverable of a van Westendorp pricing analysis
(e.g. for a given category within the retailer brand) – the green highlight area represents the range of
acceptable pricing, where here “Acceptable” does not have anything to do with maximizing revenue
or profit but is simply referring to being acceptable in the eyes of shoppers.
100%
                                                                  Range of                  Too Cheap
                      90%                                     Acceptable Pricing            NOT Bargain
                                                               ["acceptable" = in           NOT Premium
                      80%                                     minds of purchasers,          Too Expensive
                                                              not necessarily from
                      70%                                        a rev or profit
       Cumulative %


                                                                  standpoint]
                      60%

                      50%

                      40%

                      30%

                      20%

                      10%

                       0%
                         $6   $7    $8         $9       $10       $11        $12     $13         $14    $15       $16

                                                                  Price

                                                                 Low=$10.50
                                                                 High=$12.25


Beyond the basic technical aspects of estimating a good price-demand relationship, pricing analysis
always also involves knowing and properly modeling all the category-specific, extenuating, and/or
complicating nuances of the market within which the product or service being priced will be sold.
Current competitor prices and positionings should be a strong consideration in setting price.
Knowledge about government regulations regarding pricing in the category or otherwise how prices
are negotiated is important.

Given the high importance of pricing and the many complicating facets that must be considered,
M/A/R/C Research has devoted extensive effort in building deep expertise in pricing analysis. With
many years of experience spanning all industry categories, we’re able to leverage our well-known
Assessor® methodology to ensure an accurate estimation of the price-demand relationship, offer a
wide array of modeling and simulation capabilities to custom fit most any set of market dynamics,
and to deliver a truly optimized pricing strategy for the retailer category.


M/A/R/C® Research (http://marcresearch.com/) is a custom marketing research firm dedicated to helping clients create, evaluate and
strengthen their brands. M/A/R/C’s teams design and execute qualitative and quantitative, traditional and online solutions while
adhering to a client-service ethic built on being easy to work with and delivering what is promised. Our core competency is measuring
attitudes and behaviors to accurately explain and predict market share, revenue and bottom-line impact of a client’s actions. M/A/R/C
has been successfully designing, executing and analyzing studies to help clients across a range of industries since 1965. We deliver
research answers with a business perspective in the language of decision-makers.

For more information about M/A/R/C Research contact your Account Manager, or send inquires to Marketing@MARCresearch.com.

                                         Strong brands start with smart research. 800.884.6272

Mais conteúdo relacionado

Mais de M/A/R/C Research

Measuring What Matters in Social Media
Measuring What Matters in Social MediaMeasuring What Matters in Social Media
Measuring What Matters in Social MediaM/A/R/C Research
 
Navigating Qualitative Research: New & Different Ideas
Navigating Qualitative Research: New & Different IdeasNavigating Qualitative Research: New & Different Ideas
Navigating Qualitative Research: New & Different IdeasM/A/R/C Research
 
Trends InView (December 2010)
Trends InView (December 2010)Trends InView (December 2010)
Trends InView (December 2010)M/A/R/C Research
 
Social Media and Your Business’ Future
Social Media and Your Business’ FutureSocial Media and Your Business’ Future
Social Media and Your Business’ FutureM/A/R/C Research
 
Social Networking InView (March 2011)
Social Networking InView (March 2011)Social Networking InView (March 2011)
Social Networking InView (March 2011)M/A/R/C Research
 
Beverage InView (September 2010)
Beverage InView (September 2010)Beverage InView (September 2010)
Beverage InView (September 2010)M/A/R/C Research
 
Social Networking InView (September 2010)
Social Networking InView (September 2010)Social Networking InView (September 2010)
Social Networking InView (September 2010)M/A/R/C Research
 
Trends InView (September 2010)
Trends InView (September 2010)Trends InView (September 2010)
Trends InView (September 2010)M/A/R/C Research
 
A M/A/R/C Case Study - Developing Customer Relevant Concepts
A M/A/R/C Case Study - Developing Customer Relevant ConceptsA M/A/R/C Case Study - Developing Customer Relevant Concepts
A M/A/R/C Case Study - Developing Customer Relevant ConceptsM/A/R/C Research
 
Best Practices in Forecasting & Optimization
Best Practices in Forecasting & OptimizationBest Practices in Forecasting & Optimization
Best Practices in Forecasting & OptimizationM/A/R/C Research
 
The Future of Market Research
The Future of Market ResearchThe Future of Market Research
The Future of Market ResearchM/A/R/C Research
 

Mais de M/A/R/C Research (13)

Assessor AIM/VIP Webinar
Assessor AIM/VIP WebinarAssessor AIM/VIP Webinar
Assessor AIM/VIP Webinar
 
Making Social Data Sing
Making Social Data SingMaking Social Data Sing
Making Social Data Sing
 
Measuring What Matters in Social Media
Measuring What Matters in Social MediaMeasuring What Matters in Social Media
Measuring What Matters in Social Media
 
Navigating Qualitative Research: New & Different Ideas
Navigating Qualitative Research: New & Different IdeasNavigating Qualitative Research: New & Different Ideas
Navigating Qualitative Research: New & Different Ideas
 
Trends InView (December 2010)
Trends InView (December 2010)Trends InView (December 2010)
Trends InView (December 2010)
 
Social Media and Your Business’ Future
Social Media and Your Business’ FutureSocial Media and Your Business’ Future
Social Media and Your Business’ Future
 
Social Networking InView (March 2011)
Social Networking InView (March 2011)Social Networking InView (March 2011)
Social Networking InView (March 2011)
 
Beverage InView (September 2010)
Beverage InView (September 2010)Beverage InView (September 2010)
Beverage InView (September 2010)
 
Social Networking InView (September 2010)
Social Networking InView (September 2010)Social Networking InView (September 2010)
Social Networking InView (September 2010)
 
Trends InView (September 2010)
Trends InView (September 2010)Trends InView (September 2010)
Trends InView (September 2010)
 
A M/A/R/C Case Study - Developing Customer Relevant Concepts
A M/A/R/C Case Study - Developing Customer Relevant ConceptsA M/A/R/C Case Study - Developing Customer Relevant Concepts
A M/A/R/C Case Study - Developing Customer Relevant Concepts
 
Best Practices in Forecasting & Optimization
Best Practices in Forecasting & OptimizationBest Practices in Forecasting & Optimization
Best Practices in Forecasting & Optimization
 
The Future of Market Research
The Future of Market ResearchThe Future of Market Research
The Future of Market Research
 

Último

Go for Rakhi Bazaar and Pick the Latest Bhaiya Bhabhi Rakhi.pptx
Go for Rakhi Bazaar and Pick the Latest Bhaiya Bhabhi Rakhi.pptxGo for Rakhi Bazaar and Pick the Latest Bhaiya Bhabhi Rakhi.pptx
Go for Rakhi Bazaar and Pick the Latest Bhaiya Bhabhi Rakhi.pptxRakhi Bazaar
 
How To Simplify Your Scheduling with AI Calendarfly The Hassle-Free Online Bo...
How To Simplify Your Scheduling with AI Calendarfly The Hassle-Free Online Bo...How To Simplify Your Scheduling with AI Calendarfly The Hassle-Free Online Bo...
How To Simplify Your Scheduling with AI Calendarfly The Hassle-Free Online Bo...SOFTTECHHUB
 
Cybersecurity Awareness Training Presentation v2024.03
Cybersecurity Awareness Training Presentation v2024.03Cybersecurity Awareness Training Presentation v2024.03
Cybersecurity Awareness Training Presentation v2024.03DallasHaselhorst
 
Welding Electrode Making Machine By Deccan Dynamics
Welding Electrode Making Machine By Deccan DynamicsWelding Electrode Making Machine By Deccan Dynamics
Welding Electrode Making Machine By Deccan DynamicsIndiaMART InterMESH Limited
 
BAILMENT & PLEDGE business law notes.pptx
BAILMENT & PLEDGE business law notes.pptxBAILMENT & PLEDGE business law notes.pptx
BAILMENT & PLEDGE business law notes.pptxran17april2001
 
Pitch Deck Teardown: Xpanceo's $40M Seed deck
Pitch Deck Teardown: Xpanceo's $40M Seed deckPitch Deck Teardown: Xpanceo's $40M Seed deck
Pitch Deck Teardown: Xpanceo's $40M Seed deckHajeJanKamps
 
1911 Gold Corporate Presentation Apr 2024.pdf
1911 Gold Corporate Presentation Apr 2024.pdf1911 Gold Corporate Presentation Apr 2024.pdf
1911 Gold Corporate Presentation Apr 2024.pdfShaun Heinrichs
 
Onemonitar Android Spy App Features: Explore Advanced Monitoring Capabilities
Onemonitar Android Spy App Features: Explore Advanced Monitoring CapabilitiesOnemonitar Android Spy App Features: Explore Advanced Monitoring Capabilities
Onemonitar Android Spy App Features: Explore Advanced Monitoring CapabilitiesOne Monitar
 
NAB Show Exhibitor List 2024 - Exhibitors Data
NAB Show Exhibitor List 2024 - Exhibitors DataNAB Show Exhibitor List 2024 - Exhibitors Data
NAB Show Exhibitor List 2024 - Exhibitors DataExhibitors Data
 
Driving Business Impact for PMs with Jon Harmer
Driving Business Impact for PMs with Jon HarmerDriving Business Impact for PMs with Jon Harmer
Driving Business Impact for PMs with Jon HarmerAggregage
 
EUDR Info Meeting Ethiopian coffee exporters
EUDR Info Meeting Ethiopian coffee exportersEUDR Info Meeting Ethiopian coffee exporters
EUDR Info Meeting Ethiopian coffee exportersPeter Horsten
 
Lucia Ferretti, Lead Business Designer; Matteo Meschini, Business Designer @T...
Lucia Ferretti, Lead Business Designer; Matteo Meschini, Business Designer @T...Lucia Ferretti, Lead Business Designer; Matteo Meschini, Business Designer @T...
Lucia Ferretti, Lead Business Designer; Matteo Meschini, Business Designer @T...Associazione Digital Days
 
Guide Complete Set of Residential Architectural Drawings PDF
Guide Complete Set of Residential Architectural Drawings PDFGuide Complete Set of Residential Architectural Drawings PDF
Guide Complete Set of Residential Architectural Drawings PDFChandresh Chudasama
 
How Generative AI Is Transforming Your Business | Byond Growth Insights | Apr...
How Generative AI Is Transforming Your Business | Byond Growth Insights | Apr...How Generative AI Is Transforming Your Business | Byond Growth Insights | Apr...
How Generative AI Is Transforming Your Business | Byond Growth Insights | Apr...Hector Del Castillo, CPM, CPMM
 
Entrepreneurship lessons in Philippines
Entrepreneurship lessons in  PhilippinesEntrepreneurship lessons in  Philippines
Entrepreneurship lessons in PhilippinesDavidSamuel525586
 
WSMM Media and Entertainment Feb_March_Final.pdf
WSMM Media and Entertainment Feb_March_Final.pdfWSMM Media and Entertainment Feb_March_Final.pdf
WSMM Media and Entertainment Feb_March_Final.pdfJamesConcepcion7
 
Supercharge Your eCommerce Stores-acowebs
Supercharge Your eCommerce Stores-acowebsSupercharge Your eCommerce Stores-acowebs
Supercharge Your eCommerce Stores-acowebsGOKUL JS
 
Introducing the Analogic framework for business planning applications
Introducing the Analogic framework for business planning applicationsIntroducing the Analogic framework for business planning applications
Introducing the Analogic framework for business planning applicationsKnowledgeSeed
 

Último (20)

Go for Rakhi Bazaar and Pick the Latest Bhaiya Bhabhi Rakhi.pptx
Go for Rakhi Bazaar and Pick the Latest Bhaiya Bhabhi Rakhi.pptxGo for Rakhi Bazaar and Pick the Latest Bhaiya Bhabhi Rakhi.pptx
Go for Rakhi Bazaar and Pick the Latest Bhaiya Bhabhi Rakhi.pptx
 
How To Simplify Your Scheduling with AI Calendarfly The Hassle-Free Online Bo...
How To Simplify Your Scheduling with AI Calendarfly The Hassle-Free Online Bo...How To Simplify Your Scheduling with AI Calendarfly The Hassle-Free Online Bo...
How To Simplify Your Scheduling with AI Calendarfly The Hassle-Free Online Bo...
 
Cybersecurity Awareness Training Presentation v2024.03
Cybersecurity Awareness Training Presentation v2024.03Cybersecurity Awareness Training Presentation v2024.03
Cybersecurity Awareness Training Presentation v2024.03
 
WAM Corporate Presentation April 12 2024.pdf
WAM Corporate Presentation April 12 2024.pdfWAM Corporate Presentation April 12 2024.pdf
WAM Corporate Presentation April 12 2024.pdf
 
Welding Electrode Making Machine By Deccan Dynamics
Welding Electrode Making Machine By Deccan DynamicsWelding Electrode Making Machine By Deccan Dynamics
Welding Electrode Making Machine By Deccan Dynamics
 
BAILMENT & PLEDGE business law notes.pptx
BAILMENT & PLEDGE business law notes.pptxBAILMENT & PLEDGE business law notes.pptx
BAILMENT & PLEDGE business law notes.pptx
 
Pitch Deck Teardown: Xpanceo's $40M Seed deck
Pitch Deck Teardown: Xpanceo's $40M Seed deckPitch Deck Teardown: Xpanceo's $40M Seed deck
Pitch Deck Teardown: Xpanceo's $40M Seed deck
 
1911 Gold Corporate Presentation Apr 2024.pdf
1911 Gold Corporate Presentation Apr 2024.pdf1911 Gold Corporate Presentation Apr 2024.pdf
1911 Gold Corporate Presentation Apr 2024.pdf
 
Onemonitar Android Spy App Features: Explore Advanced Monitoring Capabilities
Onemonitar Android Spy App Features: Explore Advanced Monitoring CapabilitiesOnemonitar Android Spy App Features: Explore Advanced Monitoring Capabilities
Onemonitar Android Spy App Features: Explore Advanced Monitoring Capabilities
 
NAB Show Exhibitor List 2024 - Exhibitors Data
NAB Show Exhibitor List 2024 - Exhibitors DataNAB Show Exhibitor List 2024 - Exhibitors Data
NAB Show Exhibitor List 2024 - Exhibitors Data
 
Driving Business Impact for PMs with Jon Harmer
Driving Business Impact for PMs with Jon HarmerDriving Business Impact for PMs with Jon Harmer
Driving Business Impact for PMs with Jon Harmer
 
EUDR Info Meeting Ethiopian coffee exporters
EUDR Info Meeting Ethiopian coffee exportersEUDR Info Meeting Ethiopian coffee exporters
EUDR Info Meeting Ethiopian coffee exporters
 
Lucia Ferretti, Lead Business Designer; Matteo Meschini, Business Designer @T...
Lucia Ferretti, Lead Business Designer; Matteo Meschini, Business Designer @T...Lucia Ferretti, Lead Business Designer; Matteo Meschini, Business Designer @T...
Lucia Ferretti, Lead Business Designer; Matteo Meschini, Business Designer @T...
 
Guide Complete Set of Residential Architectural Drawings PDF
Guide Complete Set of Residential Architectural Drawings PDFGuide Complete Set of Residential Architectural Drawings PDF
Guide Complete Set of Residential Architectural Drawings PDF
 
How Generative AI Is Transforming Your Business | Byond Growth Insights | Apr...
How Generative AI Is Transforming Your Business | Byond Growth Insights | Apr...How Generative AI Is Transforming Your Business | Byond Growth Insights | Apr...
How Generative AI Is Transforming Your Business | Byond Growth Insights | Apr...
 
Entrepreneurship lessons in Philippines
Entrepreneurship lessons in  PhilippinesEntrepreneurship lessons in  Philippines
Entrepreneurship lessons in Philippines
 
WSMM Media and Entertainment Feb_March_Final.pdf
WSMM Media and Entertainment Feb_March_Final.pdfWSMM Media and Entertainment Feb_March_Final.pdf
WSMM Media and Entertainment Feb_March_Final.pdf
 
The Bizz Quiz-E-Summit-E-Cell-IITPatna.pptx
The Bizz Quiz-E-Summit-E-Cell-IITPatna.pptxThe Bizz Quiz-E-Summit-E-Cell-IITPatna.pptx
The Bizz Quiz-E-Summit-E-Cell-IITPatna.pptx
 
Supercharge Your eCommerce Stores-acowebs
Supercharge Your eCommerce Stores-acowebsSupercharge Your eCommerce Stores-acowebs
Supercharge Your eCommerce Stores-acowebs
 
Introducing the Analogic framework for business planning applications
Introducing the Analogic framework for business planning applicationsIntroducing the Analogic framework for business planning applications
Introducing the Analogic framework for business planning applications
 

Pricing Research in the Retailer Category

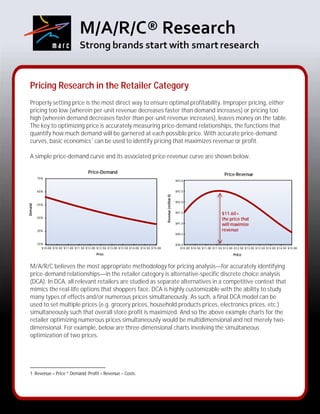
  • 1. Pricing Research in the Retailer Category Properly setting price is the most direct way to ensure optimal profitability. Improper pricing, either pricing too low (wherein per-unit revenue decreases faster than demand increases) or pricing too high (wherein demand decreases faster than per-unit revenue increases), leaves money on the table. The key to optimizing price is accurately measuring price-demand relationships, the functions that quantify how much demand will be garnered at each possible price. With accurate price-demand curves, basic economics 1 can be used to identify pricing that maximizes revenue or profit. A simple price-demand curve and its associated price-revenue curve are shown below. Price-Demand Price-Revenue 75% $93.0 65% $92.5 Revenue (million $) $92.0 55% Demand $91.5 $11.60 = 45% the price that $91.0 will maximize 35% revenue $90.5 25% $90.0 $10.00 $10.50 $11.00 $11.50 $12.00 $12.50 $13.00 $13.50 $14.00 $14.50 $15.00 $10.00 $10.50 $11.00 $11.50 $12.00 $12.50 $13.00 $13.50 $14.00 $14.50 $15.00 Price Price M/A/R/C believes the most appropriate methodology for pricing analysis—for accurately identifying price-demand relationships—in the retailer category is alternative-specific discrete choice analysis (DCA). In DCA, all relevant retailers are studied as separate alternatives in a competitive context that mimics the real-life options that shoppers face. DCA is highly customizable with the ability to study many types of effects and/or numerous prices simultaneously. As such, a final DCA model can be used to set multiple prices (e.g. grocery prices, household products prices, electronics prices, etc.) simultaneously such that overall store profit is maximized. And so the above example charts for the retailer optimizing numerous prices simultaneously would be multidimensional and not merely two- dimensional. For example, below are three-dimensional charts involving the simultaneous optimization of two prices. 1 Revenue = Price * Demand; Profit = Revenue – Costs.
  • 2. Price-Demand Function (2 prices) Price-Revenue Function (2 prices) 50% 45% 40% 35% 30% 25% % Demand 20% Revenue 15% 10% 5% 0% $2 $6 $2 $10 $6 $14 $10 $18 $14 $22 $18 $26 $22 $30 $10 $26 Price B $34 $20 $30 $10 $38 $34 $30 Price B $42 $20 $38 $40 $46 $30 $42 $50 $50 Price A $40 $46 $50 $50 Price A A DCA model culminates in a simulator wherein prices can be set at any price along the entire continuum of price ranges studied and not simply at the discrete price points studied as test stimuli. Further, M/A/R/C overlays years of experience in calibrating DCA-model simulators to adjust for any survey biases, so that predicted demand estimates are as close to true market share as possible. This precise calibration is accomplished by using DCA in concert with M/A/R/C’s Assessor® product forecasting methodology. M/A/R/C’s Assessor, a proprietary forecasting methodology originally developed at MIT and proven successful in thousands of practical applications, is one of only a few widely recognized, validated, research-based forecasting models in existence. Below are some highlights of the DCA methodology in the retailer category. » The Discrete Choice Exercise for Respondents (Shoppers) 1. Expose survey respondents to a variety of scenarios that include retailer brands that well represent the category and vary the average prices for relevant categories (e.g. grocery, clothing, electronics, etc.). 2. Optionally, also vary other attributes of interest besides prices, such as availability of offerings, product features (sizes, package configuration), store features, etc. 3. Ask survey respondents to allocate purchases across the retailers shown. » Benefits 1. Experimental design is utilized to select realistic combinations of levels of attributes – but also ensuring attributes are studied with statistical rigor (balanced and orthogonal) and then unique blocks of scenarios are shown to each respondent. 2. Respondents are allowed to allocate purchases in categories where alternative options are or will be available in-market.
  • 3. 3. The test provides a realistic competitive context (multiple retailer brands in each choice scenario; price and other attributes customized to the brand) and influences the respondent to provide realistic responses to price. 4. Gaming is not likely, due to the even-handed treatment of alternative brands. 5. Any “over focus” on Price can be diffused by presence of other attributes. » Potential issues 1. DCA is more costly than other forms of pricing analysis. In the retailer space, in addition to DCA, it can be helpful to conduct as a supplemental component to the overall pricing assessment what is known as van Westendorp pricing analysis. For a retailer it would be conducted for each of the category prices – again, such as grocery, clothing, electronics, etc. – as the average of typical item’s or typical basket of goods price. The van Westendorp technique is easy to implement, involving four questions wherein respondents directly state their expectations regarding price levels. As such, being based on simple, direct “stated” measures, the results of van Westendorp have high face validity; respondents are merely stating where they expect pricing to be. While some researchers extend the basic van Westendorp method to include the identification of what they believe to be an optimal price point, we at M/A/R/C do not believe the simple “stated” data of the van Westendorp method can be used for such and do not use van Westendorp as a surrogate for rigorous price-demand estimation. Instead we use the van Westendorp method only to form a range – a window – of prices within which shoppers expect pricing to fall. For identifying optimal pricing we rely on DCA-based price-demand relationships. However, the results from DCA are enhanced by comparing them to the information from van Westendorp, where we can answer such things as: n Does the optimal price as identified from the DCA fall within the van Westendorp acceptable range? n How wide is the range of expected pricing? n How sharply does acceptance fall off if price goes beyond the acceptable range? Below is an example chart that represents the final deliverable of a van Westendorp pricing analysis (e.g. for a given category within the retailer brand) – the green highlight area represents the range of acceptable pricing, where here “Acceptable” does not have anything to do with maximizing revenue or profit but is simply referring to being acceptable in the eyes of shoppers.
  • 4. 100% Range of Too Cheap 90% Acceptable Pricing NOT Bargain ["acceptable" = in NOT Premium 80% minds of purchasers, Too Expensive not necessarily from 70% a rev or profit Cumulative % standpoint] 60% 50% 40% 30% 20% 10% 0% $6 $7 $8 $9 $10 $11 $12 $13 $14 $15 $16 Price Low=$10.50 High=$12.25 Beyond the basic technical aspects of estimating a good price-demand relationship, pricing analysis always also involves knowing and properly modeling all the category-specific, extenuating, and/or complicating nuances of the market within which the product or service being priced will be sold. Current competitor prices and positionings should be a strong consideration in setting price. Knowledge about government regulations regarding pricing in the category or otherwise how prices are negotiated is important. Given the high importance of pricing and the many complicating facets that must be considered, M/A/R/C Research has devoted extensive effort in building deep expertise in pricing analysis. With many years of experience spanning all industry categories, we’re able to leverage our well-known Assessor® methodology to ensure an accurate estimation of the price-demand relationship, offer a wide array of modeling and simulation capabilities to custom fit most any set of market dynamics, and to deliver a truly optimized pricing strategy for the retailer category. M/A/R/C® Research (http://marcresearch.com/) is a custom marketing research firm dedicated to helping clients create, evaluate and strengthen their brands. M/A/R/C’s teams design and execute qualitative and quantitative, traditional and online solutions while adhering to a client-service ethic built on being easy to work with and delivering what is promised. Our core competency is measuring attitudes and behaviors to accurately explain and predict market share, revenue and bottom-line impact of a client’s actions. M/A/R/C has been successfully designing, executing and analyzing studies to help clients across a range of industries since 1965. We deliver research answers with a business perspective in the language of decision-makers. For more information about M/A/R/C Research contact your Account Manager, or send inquires to Marketing@MARCresearch.com. Strong brands start with smart research. 800.884.6272