
Recomendados
Mais conteúdo relacionado
Mais procurados
Mais procurados (20)
Destaque
Destaque (20)
Semelhante a Stats 7 12-10
Semelhante a Stats 7 12-10 (15)
Mais de Linda Twining
Mais de Linda Twining (20)
Último
Último (20)
Stats 7 12-10
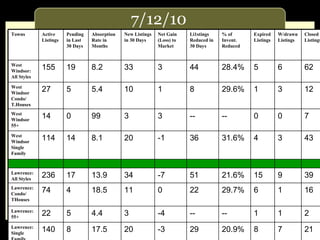
- 1. 7/12/10 Towns Active Listings Pending in Last 30 Days Absorption Rate in Months New Listings in 30 Days Net Gain (Loss) to Market Li1stings Reduced in 30 Days % of Invent. Reduced Expired Listings W/drawn Listings Closed Listings West Windsor: All Styles 155 19 8.2 33 3 44 28.4% 5 6 62 West Windsor Condo/ T.Houses 27 5 5.4 10 1 8 29.6% 1 3 12 West Windsor 55+ 14 0 99 3 3 -- -- 0 0 7 West Windsor Single Family 114 14 8.1 20 -1 36 31.6% 4 3 43 Lawrence: All Styles 236 17 13.9 34 -7 51 21.6% 15 9 39 Lawrence: Condo/ THouses 74 4 18.5 11 0 22 29.7% 6 1 16 Lawrence: 55+ 22 5 4.4 3 -4 -- -- 1 1 2 Lawrence: Single Family 140 8 17.5 20 -3 29 20.9% 8 7 21
- 2. 7/12/10 Towns Active Listings Pending in Last 30 Days Absorption Rate in Months New Listings in 30 Days Net Gain (Loss) to Market Listings Reduced in 30 Days % of Invent. Reduced Expired Listings W/drawn Listings Closed Listings PlainsboroAll Styles 79 10 7.9 21 9 22 28% 2 0 29 Plainsboro Condo/ THouses 37 8 4.6 11 2 9 24% 1 0 13 Plainsboro 55+ 13 0 13 0 0 5 38% 0 0 1 Plainsboro Single Family 29 2 14.5 10 7 8 27% 1 0 15 Cranbury: All Styles 25 1 25 3 1 6 24% 1 0 5 Cranbury: 55+ 1 0 1 0 0 1 100% 0 0 1 Cranbury: Single Family 24 1 24 3 1 5 20% 1 0 4
- 3. 7/12/10 Towns Active Listings Pending in Last 30 Days Absorption Rate in Months New Listings in 30 Days Net Gain (Loss) to Market Listings Reduced in 30 Days % of Invent. Reduced Expired Listings W/drawn Listings Closed Listings Ewing: All Styles 296 10 29.6 55 17 69 23.3% 21 7 22 Ewing : Condo/ T.Houses 45 2 22.5 9 1 10 22.2% 4 2 2 Ewing 55+: 9 0 99 0 0 -- -- 0 0 0 Ewing: Single Family 242 8 30.3 46 16 59 24.4% 17 5 20 East Windsor: All Styles 247 7 35.3 52 27 47 19% 10 8 27 East Windsor: Condo/ THouses 130 3 43.4 30 15 27 20.8% 9 3 10 East Windsor: 55+ 22 0 99 3 0 -- -- 1 2 1 East Windsor: Single Family 95 4 23.8 19 12 20 21.1% 0 3 16
- 4. 7/12/10 Towns Active Listings Pending in Last 30 Days Absorption Rate in Months New Listings in 30 Days Net Gain (Loss) to Market Listings Reduced in 30 Days % of Invent. Reduced Expired Listings W/drawn Listings Closed Listings Hopewell Twp. All Styles 186 22 8 25 3 28 15% 4 6 25 Hopewell Twp. Condo/ T.Houses 17 3 6 2 (1) 7 41% 0 1 8 Hopewell Twp.: 55+ 11 0 99 - - - - - - - Hopewell Twp Single Family 158 19 8 23 4 21 13% 4 5 17 Hamilton: All Styles 631 65 10 119 54 148 23% 48 27 79 Hamilton: Condo/ THouses 112 16 7 26 10 27 24% 12 8 24 Hamilton: Single Family 476 46 10 93 44 121 25% 36 19 55 Hamilton: 55+ 41 3 13 - - - - - - -
- 5. 7/12/10 Towns Active Listings Pending in Last 30 Days Absorption Rate in Months New Listings in 30 Days Net Gain (Loss) to Market Listings Reduced in 30 Days % of Invent. Reduced Expired Listings W/drawn Listings Closed Listings Robbinsville All Styles 149 10 15 28 18 37 25% 4 6 17 Robbinsville Condo/ T.Houses 78 6 13 16 10 19 24% 3 1 8 Single Family 71 4 18 12 8 18 25% 1 5 9 Hightstown Boro: All Styles 70 6 12 11 5 14 20% 11 1 2 Pennington 23 4 6 0 (4) 6 26% 1 1 7 Hopewell Boro 23 1 23 4 3 4 17% 0 6 3
- 6. 7/12/10 Towns Active Listings Pending in Last 30 Days Absorption Rate in Months New Listings in 30 Days Net Gain (Loss) to Market Listings Reduced in 30 Days % of Invent. Reduced Expired Listings W/drawn Listings Closed Listings Princeton Boro: All Styles 53 2 26.5 9 3 14 26.4% 1 3 13 Pton -Boro Condo/ Thouses 20 1 20 4 0 6 30% 1 2 4 Pton-Boro Single Family 33 1 33 5 3 8 24.2% 0 1 9 Pton Twp: All Styles 141 3 47 20 4 21 14.9% 6 7 27 Pton Twp: Condo/ Thouses 12 1 12 4 1 2 16.7% 2 0 4 Pton Twp: Single Family 129 2 64.5 16 3 19 14.7% 4 7 23
- 7. 7/12/10 Towns Active Listings Pending in Last 30 Days Absorption Rate in Months New Listings in 30 Days Net Gain (Loss) to Market Listings Reduced in 30 Days % of Invent. Reduced Expired Listings W/drawn Listings Closed Listings South Brunswick All Styles 234 27 9 63 36 37 15% 18 6 49 South BrunswickCondo/ T.Houses 64 15 4 21 6 17 26% 3 3 19 South Brunswick 55+ 36 4 9 5 1` 3 8% 1 0 1 South Brunswick Single Family 134 8 17 37 29 17 13% 14 3 29 Monroe: All Styles 492 42 12 107 64 12 2% 47 4 61 Monroe: 55+ 313 27 12 64 37 61 19% 22 3 35 Monroe: Single Family 179 15 12 43 28 30 17% 25 1 26
- 8. 7/12/10 Towns Active Listings Pending in Last 30 Days Absorption Rate in Months New Listings in 30 Days Net Gain (Loss) to Market Listings Reduced in 30 Days % of Invent. Reduced Expired Listings W/drawn Listings Closed Listings Montgomery All Styles 167 13 13 38 -20 41 25% 7 10 41 Montgomery Condo/Twnhms 23 0 - 8 -6 4 17% 0 6 8 Single Family 144 13 11 30 -14 37 26% 7 4 33 Hillsborough All Styles 255 24 11 48 -11 54 21% 9 9 41 Hillsborough Condo/Twnhms 98 6 16 22 3 15 15% 4 2 13 Hillsborough Single Family 157 18 9 26 -14 39 25% 5 7 28
Notas do Editor
- Populate this table to show the local absorption rate in the various price ranges that are appropriate for your market area. Please add or delete rows as necessary to adequately reflect local conditions.
- Populate this table to show the local absorption rate in the various price ranges that are appropriate for your market area. Please add or delete rows as necessary to adequately reflect local conditions.
- Populate this table to show the local absorption rate in the various price ranges that are appropriate for your market area. Please add or delete rows as necessary to adequately reflect local conditions.
- Populate this table to show the local absorption rate in the various price ranges that are appropriate for your market area. Please add or delete rows as necessary to adequately reflect local conditions.
- Populate this table to show the local absorption rate in the various price ranges that are appropriate for your market area. Please add or delete rows as necessary to adequately reflect local conditions.
- Populate this table to show the local absorption rate in the various price ranges that are appropriate for your market area. Please add or delete rows as necessary to adequately reflect local conditions.
- Populate this table to show the local absorption rate in the various price ranges that are appropriate for your market area. Please add or delete rows as necessary to adequately reflect local conditions.
- Populate this table to show the local absorption rate in the various price ranges that are appropriate for your market area. Please add or delete rows as necessary to adequately reflect local conditions.