SlideShare uma empresa Scribd logo
1 de 33
A) less dense, more mafic, and thinner
B) less dense, more felsic, and thicker
C) more dense, more mafic, and thinner
D) more dense, more felsic, and thicker
1. Compared to continental crust, oceanic crust is
A) thinner and more dense
B) thinner and less dense
C) thicker and more dense
D) thicker and less dense
2. Compared to Earth’s continental crust, Earth’s oceanic
crust is
A) thinner and composed of granite
B) thinner and composed of basalt
C) thicker and composed of granite
D) thicker and composed of basalt
3. Compared to Earth's oceanic crust, Earth's continental
crust is
A) thicker B) more dense
C) more granitic D) more felsic
4. Compared to the continental crust, the oceanic crust is
5. Base your answer to the following question on
the cross section below, which shows the boundary between two lithospheric plates. Point X is a location in
the continental lithosphere. The depth below Earth's surface is labeled in kilometers.
A) less dense and thinner B) less dense and thicker
C) more dense and thinner D) more dense and thicker
Compared to the continental crust, the oceanic crust is
A) low density and is mafic
B) low density and is felsic
C) high density and is mafic
D) high density and is felsic
6. When two tectonic plates collide, oceanic crust usually
subducts beneath continental crust because oceanic crust
is primarily composed of igneous rock that has
A) continental crust B) oceanic crust
C) plastic mantle D) rigid mantle
7. In which part of the Earth are felsic rocks most likely to
be found?
A) nitrogen B) oxygen
C) silicon D) iron
8. Which element is most abundant by mass in the Earth's
crust?
A) oxygen, potassium, sodium, and calcium
B) hydrogen, oxygen, nitrogen, and potassium
C) aluminum, iron, silicon, and magnesium
D) aluminum, calcium, hydrogen, and iron
9. What are the four most abundant elements, by volume, in
the Earth's crust?
10. The diagram below represents a cross section of a
portion of the Earth's crust where no overturning of the
rock layers has occurred. Two rock layers are labeled A
and B.
A) Deposition occurred before folding or faulting.
B) Faulting occurred before folding of the rock layers.
C) Faulting occurred before the formation of rock
layer A.
D) Folding occurred before the formation of rock
layer B.
Which statement describes the most likely sequence of
events?
11. Base your answer on the geologic cross section below.
A) folding at A
B) the intrusion at B
C) faulting at C
D) the unconformity at D
Which geologic event occurred most recently?
12. The diagram below shows a cross section of a portion of
Earth's crust.
A) bedrock folding B) bedrock faulting
C) stream erosion D) volcanic activity
The hills of this area were formed primarily by
13. The diagram below shows the bedrock structure beneath
a series of hills.
A) folding B) faulting
C) deposition D) vulcanism
Which process was primarily responsible for forming
the hills?
14. The diagram below represents a geologic cross section
of a portion of Earth's crust.
A) Gayle shale
B) Freeport sandstone
C) Erie coal, but before formation of Freeport
sandstone
D) Dunbar limestone, but before formation of Erie
coal
Folding and erosion occurred after the formation of the
15. Base your answer to the following question on the geologic cross section below in which overturning has
not occurred. Letters A through H represent rock layers.
A) folding ® uplift ® erosion ® deposition
B) intrusion ® erosion ® folding ® uplift
C) erosion ® folding ® deposition ® intrusion
D) deposition ® uplift ® erosion ® folding
Which sequence of events most likely caused the unconformity shown at the bottom of rock layer B?
16. The block diagram below shows a part of the eastern coastline of North America. Points A, B, and C are
reference points along the coast.
A) A — folding; B — subduction; C — crosscutting
B) A — weathering; B — erosion; C — deposition
C) A — faulting; B — conduction; C — mass movement
D) A — precipitation; B — infiltration; C — evaporation
Which list best represents the primary processes occurring along the coastline at
points A, B, and C?
17. The diagram below shows a cross section of the Earth's crust. Line XY is a fault.
A) B)
C) D)
Which sequence of events, from oldest to youngest, has occurred in this outcrop?
18. The diagrams below show geologic cross sections of the
same part of the Earth's crust at different times in the
geologic past.
A) A ® B ® C ® D B) C ® D ® A ® B
C) C ® A ® D ® B D) A ® C ® B ® D
Which sequence shows the order in which this part of
the crust probably formed?
19. Base your answer to the following question on the
diagrams below which represent two rock outcrops
found several miles apart in New York State. Individual
rock layers are lettered, and fossils and rock types are
indicated.
A) F, B, E, D B) C, A, F, D
C) F, E, C, A D) C, E, D, A
In which sequence are the rock layers listed in order
from oldest to youngest?
A) shale schist phyllite slate gneiss
B) shale slate phyllite schist gneiss
C) shale gneiss phyllite slate schist
D) shale gneiss phyllite schist slate
20. Which sequence of change in rock type occurs as shale
is subjected to increasing heat and pressure?
21. Base your answer to the following question on The
diagram below shows a geologic cross section. Letters
A through D represent different rock units.
A) A ® B ® C ®D B) C ® D ® A ®B
C) D ® B ®A ®C D) D ® C ® B ®A
Which sequence correctly shows the age of the lettered
rock units, from oldest to youngest?
22. Base your answer to the following question on The
cross section below shows rock layers A, B, C, D, and
fault F. The rock layers have not been overturned.
A) D C B A F
B) A B C D F
C) F D C B A
D) F A B C D
Which sequence places the rock layers and fault in
order from oldest to youngest?
23. Base your answer to the following question on The
cross section below shows a rock sequence that has not
been overturned.
A) Shale was deposited.
B) Glacial till was deposited.
C) Basaltic lava flows solidified.
D) Glossopteris flourished and then became extinct.
Which event occurred last at this location?
24. Base your answer to the following question on the example of a seismogram and set of instructions for
determining the Richter magnitude of an earthquake below. The example shows the Richter magnitude of
an earthquake 210 kilometers from a seismic station.
Instructions for determining Richter magnitude:
• Determine the distance to the epicenter of the earthquake. (The distance in the example is 210
kilometers.)
• Measure the maximum wave height of the S-wave recorded on the seismogram. (The height in the
example is 23 millimeters.)
• Place a straightedge between the distance to the epicenter (210 kilometers) and the height of the largest S
-wave (23 millimeters) on the appropriate scales. Draw a line connecting these two points. The magnitude
of the earthquake is determined by where the line intersects the Richter magnitude scale. (The magnitude
of this example is 5.0.)
Using the set of instructions and the seismogram and scales below, determine
the Richter magnitude of an earthquake that was located 500 kilometers from this
seismic station.
25. Base your answer to the following question on The
seismogram below shows P-wave and S-wave arrival
times at a seismic station following an earthquake.
A) 1,600 km B) 3,200 km
C) 4,400 km D) 5,600 km
The distance from this seismic station to the epicenter
of teh earthquake is approximately
26. The seismogram below shows the arrival times of an earthquake's P-wave and S-wave recorded at a
seismic station in Portland, Oregon.
A) 1800 km B) 2500 km C) 3200 km D) 4100 km
What was the distance from Portland to the earthquake's epicenter?
27. An earthquake recorded by seismic stations around the
world created the pattern of seismic wave recordings
shown in the diagram below
A) Some seismic waves cannot travel through oceans
to reach every location on Earth.
B) S-waves are too weak to travel very far from the
earthquake focus.
C) Mountain ranges and tectonic plate boundaries
absorb or bend seismic waves.
D) Layers with different properties inside Earth
absorb or bend seismic waves.
Which statement best explains this pattern of wave
recordings?
28. The seismogram below shows the time that an
earthquake P-wave arrived at a seismic station.
A) 1,900 km B) 3,200 km
C) 4,000 km D) 5,200 km
If the earthquake occurred at exactly 10:00 p.m.,
approximately how far from the earthquake epicenter
from the seismic station?
29. Base your answer to question 43 on the seismogram below. The seismogram was recorded at a seismic
station and shows the arrival times of the first P-wave and S-wave from an earthquake.
A) P-wave arrival time, only
B) S-wave arrival time, only
C) difference in the arrival time of the P-wave and S-wave
D) difference in the height of the P-wave and S-wave
Which part of this seismogram is used to find the distance to the epicenter of the earthquake?
30. Base your answer to the following question on The diagram below represents three seismograms showing
the same earthquake as it was recorded at three different seismic stations, A, B, and C.
A) A is closest to the epicenter, and C is farthest from the epicenter.
B) B is closest to the epicenter, and C is farthest from the epicenter.
C) C is closest to the epicenter, and A is farthest from the epicenter.
D) A is the closest to the epicenter, and B is the farthest from the epicenter.
Which statement correctly describes the distance between the earthquake epicenter and these seismic
stations?
A) 7 minutes 20 seconds
B) 5 minutes 10 seconds
C) 3 minutes 20 seconds
D) 4 minutes 10 seconds
31. A seismic station is 2,000 kilometers from an
earthquake epicenter. How long does it take an S-wave
to travel from the epicenter to the station?
A) 4:24 p.m. B) 4:29 p.m.
C) 4:36 p.m. D) 4:56 p.m.
32. If a seismograph recording station located 5,700
kilometers from an epicenter receives a P-wave at 4:45
p.m., at which time did the earthquake actually occur at
the epicenter?
33. Base your answer to the following question on
the map below which shows epicenters of some of the earthquakes that occurred in North America during a
2-week period. Five epicenters are labeled A through E. Denver and New York City are also indicated.
A) 1 min 20 sec B) 5 min 40 sec C) 7 min 30 sec D) 10 min 00 sec
The distance from epicenter E to New York City is 3,000 kilometers. What was the approximate travel
time for the P-waves from this epicenter to New York City?
A) 11 min 15 sec B) 9 min 35 sec
C) 5 min 20 sec D) 4 min 20 sec
34. The epicenter of an earthquake is located 2,800
kilometers from a seismic station. Approximately how
long did the S-wave take to travel from the epicenter to
the station?
A) 6 mm 40 sec B) 9 mm 40 sec
C) 15 mm 00 sec D) 19 mm 00 sec
35. A P-wave takes 8 minutes and 20 seconds to travel
from the epicenter of an earthquake to a seismic station.
Approximately how long will an S-wave take to travel
from the epicenter of the same earthquake to this
seismic station?
A) When the P-waves and S-waves are near the
epicenter, they both travel at the same speed.
B) The velocity of P-waves and S-waves is constant,
regardless of the distance traveled.
C) P-waves always travel faster than S-waves,
regardless of the distance traveled.
D) S-waves always travel about twice as fast as P
-waves.
36. Which generalization about earthquake S-waves and P
-waves is correct?
37. The seismogram below shows the arrival times of
P- and S-waves at a seismic station in hours, minutes,
and seconds.
A) 1,650 km B) 1,900 km
C) 2,200 km D) 4,100 km
Approximately how far from the earthquake epicenter is
this seismic station?
38. Base your answer to the following question on the
diagram of the Earth below showing the observed
pattern of waves recorded after an earthquake.
A) crust in zone 1 B) mantle in zone 2
C) crust in zone 3 D) core of the Earth
The location of the epicenter of the earthquake that
produced the observed wave pattern most likely is in the
39. Base your answer to the following question on the data table below, which gives information collected at
seismic stations W, X, Y, and Z for the same earthquake. Some of the data have been omitted.
A) W B) X C) Y D) Z
Which seismic station was farthest from the earthquake epicenter?
A) 1,000 km B) 1,500 km
C) 2,000 km D) 2,500 km
40. A seismograph indicates the difference between the
arrival of S-waves and P-waves to be 4 minutes. The
distance of the seismograph station from the
earthquake's epicenter is about
A) 5:04:30 a.m. B) 5:05:40 a.m.
C) 5:10:12 a.m. D) 6:15:00 a. m.
41. An earthquake occurred at 5:00:00 a.m. At what time
would the P-wave reach a seismic station 3,000
kilometers from the epicenter?
A) an iron-rich solid B) an iron-rich liquid
C) a silicate-rich solid D) a silicate-rich liquid
42. The rock between 2,900 kilometers and 5,200
kilometers below the Earth's surface is inferred to be
A) 6,500ºC B) 4,200ºC
C) 3,500ºC D) 1,800ºC
43. At a depth of 2,000 kilometers, the temperature of the
stiffer mantle is inferred to be
A) analyzing worldwide seismic data
B) measuring crustal temperature ranges
C) determining crustal density differences
D) observing rock samples from surface bedrock
44. The structure of the Earth's interior is best inferred by
A) an iron-rich solid B) an iron-rich liquid
C) a silicate-rich solid D) a silicate-rich liquid
45. The rock between 2,900 kilometers and 5,200
kilometers below the Earth's surface is inferred to be
46. Base your answer to the following question on the
diagram below, which shows a cutaway view of Earth
in which the interior layers are visible. The paths of
earthquake waves generated at point X are shown. A, B,
C, and D are locations of seismic stations on Earth's
surface, and point E is located in Earth's interior.
A) 1,500ºC B) 2,900ºC
C) 5,000ºC D) 6,200ºC
The actual rock temperature at point E is inferred to be
approximately
A) liquid, with an average density of approximately
4 g/cm3
B) liquid, with an average density of approximately
11 g/cm3
C) solid, with an average density of approximately
4 g/cm3
D) solid, with an average density of approximately
11 g/cm3
47. Earth’s outer core is best inferred to be
A) liquid
B) solid
C) composed of a high percentage of iron
D) under the same pressure
48. Earth’s outer core and inner core are both inferred to be
A) the Moon’s interior
B) the Moon’s composition
C) Earth’s surface features
D) Earth’s seismic data
49. Scientists have inferred the structure of Earth’s interior
mainly by analyzing
A) seismic waves
B) crustal rocks
C) radioactive decay rates
D) magnetic pole reversals
50. Earth’s inner core is inferred to be solid based on the
analysis of
A) 1000°C B) 2500°C
C) 4500°C D) 5000°C
51. The inferred temperature at the interface between the
stiffer mantle and the asthenosphere is closest to
A) 3500°C and 0.4 million atmospheres
B) 3500°C and 2.0 million atmospheres
C) 5500°C and 0.4 million atmospheres
D) 5500°C and 2.0 million atmospheres
52. Which combination of temperature and pressure is
inferred to occur within Earth’s stiffer mantle?
A) crust B) mantle
C) outer core D) inner core
53. A part of which zone of the Earth's interior is inferred
to have a density of 10.0 grams per cubic centimeter?
A) 1 million atmospheres
B) 2 million atmospheres
C) 3 million atmospheres
D) 4 million atmospheres
54. The pressure at the interface between the inner core and
outer core of the Earth is inferred to be approximately
55. Base your answer to the following question on the
diagram below which represents Earth's interior zones.
A) crust B) mantle
C) outer core D) inner core
In which layer of Earth's interior is the inferred
temperature 6,000°C?
A) continents moved due to changes in the Earth's
orbital velocity
B) continents moved due to the Coriolis effect caused
by the Earth's rotation
C) present-day continents of South America and
Africa are moving toward each other
D) present-day continents of South America and
Africa once fit together like puzzle parts
56. The theory of continental drift suggests that the
A) Basaltic rock is found to be progressively younger
at increasing distances from a mid-ocean ridge.
B) Marine fossils are often found in deep-well drill
cores.
C) The present continents appear to fit together as
pieces of a larger landmass.
D) Areas of shallow-water seas tend to accumulate
sediment, which gradually sinks.
57. Which statement best supports the theory of continental
drift?
A) the seafloor is spreading
B) the ocean basins are older than the continents
C) the mid-ocean ridges are higher than the nearby
plains
D) Earth's rate of rotation has changed
58. Magnetic readings taken across mid-ocean ridges
provide evidence that
A) African plate and Antarctic plate
B) Nazca plate and South American plate
C) China plate and Philippine plate
D) Australian plate and Eurasian plate
59. Seafloor spreading is occurring at the boundary
between the
A) The bedrock of the ridge and nearby seafloor is
igneous rock.
B) The ridge is the location of irregular volcanic
eruptions.
C) Several faults cut across the ridge and nearby
seafloor.
D) Seafloor bedrock is younger near the ridge and
older farther away.
60. Which observation about the Mid-Atlantic Ridge region
provides the best evidence that the seafloor has been
spreading for millions of years?
A) crust B) asthenosphere
C) outer core D) inner core
61. In which Earth layer are most convection currents that
cause seafloor spreading thought to be located?
Base your answers to questions 62 through 64 on the
diagram below which shows the magnetic orientation
of igneous rock on the seafloor on the east (right) side
of a mid-ocean ridge. The pattern on the west (left) side
of the ridge has been omitted. The age of the igneous
rock and its distance from the ridge center are shown.
A) The orientation of the Earth's magnetic field has
reversed with time.
B) The size of the continents has changed with time.
C) The elevation of sea level has changed with time.
D) The amount of fossil material preserved in the
igneous rock has changed with time.
62. Which inference can best be made from the diagram?
A) B)
C) D)
63. Which diagram below best represents the pattern of
magnetic orientation in the seafloor on the west (left)
side of the ocean ridge?
A) destruction of oceanic crust
B) destruction of continental crust
C) existence of ancestral mountains
D) existence of rising mantle convection currents
64. The occurrence of high-heat floors at the ridge center
provides evidence of the
65. Base your answer to the following question on The
diagram below shows the interaction of two tectonic
plates.
A) Antarctic Plate and the African Plate
B) Antarctic Plate and the Indian-Australian Plate
C) South American Plate and the Nazca Plate
D) South American Plate and the African Plate
The type of plate boundary represented in the diagram
most likely exists between the
A) at a convergent plate boundary
B) above a mantle hot spot
C) above a mid-ocean ridge
D) near the center of a large plate
66. According to tectonic plate maps, New York State is
presently located
67. Base your answer to the following question on The block diagram below shows the boundary between two
tectonic plates.
A) divergent B) convergent C) transform D) complex
Which type of plate boundary is shown?
68. Base your answer to the following question on the diagram below, which shows an incomplete concept
map identifying the types of plate boundaries. Information in the boxes labeled A, B, C, D,and E has been
deliberately omitted.
On the geographic map shown above, write the letters D and E on the plate boundary locations where the
indicated movements are occurring. Write the letters approximately the same size as shown on the concept
map and locate the letters directly on the plate boundary.
69. Base your answer to the following question on the world map shown below. Letters A through H represent
locations on Earth’s surface.
Explain why location A has a greater probability of experiencing a major earthquake than location D.
A) the mid-Atlantic ridge
B) the Aleutian trench
C) the Atlantic-Indian ridge
D) the Pacific/North American plate boundary
70. Which of the following locations is the site of a
convergent plate boundary?
A) B)
C) D)
71. Which diagram best shows the type of plate boundary
found between the China Plate and the Philippine Plate?
A) Southwest Indian Ridge
B) Iceland Hotspot
C) Marianas Trench
D) Sandwich Plate
72. Which of the following is located at a converging plate
boundary?
A) convergent B) transform
C) divergent D) complex
73. What type of plate boundary exists between the African
Plate and the Antartic Plate?
74. Base your answer to the following question on The map
below shows the northern section of the boundary
between the Arabian Plate and theAfrican Plate.
Arrows show the relative direction of plate motion.
A) divergent B) subduction
C) convergent D) transform
Which type of plate boundary is located at the Jordan
Fault?
A) Nazca Plate and Antarctic Plate
B) Pacific Plate and Indian-Australian Plate
C) Indian-Australian Plate and Antarctic Plate
D) Nazca Plate and Pacific Plate
75. At which plate boundary is one lithospheric plate
sliding under another?
76. Base your answer to the following question on Arrows in the block diagram below show the relative
movement along a tectonic plate boundary.
A) Nazca Plate and South American Plate B) Eurasian Plate and Indian-Australian Plate
C) North American Plate and Eurasian Plate D) Pacific Plate and North American Plate
Between which two tectonic plates does this type of plate boundary exist?
Base your answers to questions 77 and 78 on the world map in your answer booklet and on your
knowledge of Earth science. The map shows major earthquakes and volcanic activity occurring from 1996
through 2000. Letter A represents a volcano on a crustal plate boundary.
77. Identify the type of plate movement responsible for the presence of the volcano at location A.
78. Place an X on the map to show the location of the Nazca Plate.
79. The diagram below shows a tectonic plate boundary.
A) Hawaii Hot Spot
B) Yellowstone Hot Spot
C) Galapagos Hot Spot
D) Canary Hot Spot
Which mantle hot spot is at a plate boundary like the
one shown in this diagram?
80. Base your answer to the following question on The block diagram below shows a tectonic plate boundary.
Points A and B represent locations on Earth’s surface.
A) B)
C) D)
Which graph best shows the depths of most major earthquakes whose epicenters lie between A and B?
81. Base your answer to the following question on the map below, which shows the depths of selected
earthquakes along the crustal plate boundary near the west coast of South America. Letters A, B, C, and D
are epicenter locations along a west-to-east line at the surface. The relative depth of each earthquake is
indicated.
A) B)
C) D)
Which graph best shows the depth of earthquakes beneath epicenters A, B, C, and D?
82. Base your answer to the following question on the block diagram below. The diagram shows the tectonic
plate boundary between Africa and North America 300 million years ago, as these two continents united
into a single landmass. The arrows at letters A, B, C, and D represent relative crustal movements. Letter X
shows the eruption of a volcano at that time.
Identify the type of tectonic plate motion represented by the arrow shown at D.
A) Mid-Atlantic Ridge
B) Yellowstone Hot Spot
C) San Andreas Fault
D) Peru-Chile Trench
83. Alternating parallel bands of normal and reversed
magnetic polarity are found in the basaltic bedrock on
either side of the
A) Parallel strips of igneous rocks on each side of the
ridge show matching reversals of magnetic
polarity.
B) The fossils found on one side of the ridge are
younger than the fossils found on the other side.
C) The age of the rocks decreases as the distance
from the ridge increases.
D) Seafloor temperatures increase as the distance
from the ridge increases.
84. Which statement provides evidence that the seafloor is
spreading out from both sides of the Mid-Atlantic
Ridge?
A) younger B) thicker
C) less dense D) more felsic
85. Compared to the continental crust of central North
America, the oceanic crust of the Mid-Atlantic Ridge is
86. Which map best represents the general pattern of
magnetism in the oceanic bedrock near the mid-Atlantic
Ridge?
A) B)
C) D)
87. Base your answer to the following question on The diagram below represents the pattern of normal and
reversed magnetic polarity and the relative age of the igneous bedrock composing the ocean floor on the
east side of the Mid-Atlantic Ridge. The magnetic polarity of the bedrock on the west side of the ridge has
been deliberately left blank.
A) B)
C) D)
Which diagram best shows the magnetic pattern and relative age of the igneous bedrock on the west side of
the ridge?
88. The scale below shows the age of rocks in relation to
their distance from the Mid-Atlantic Ridge.
A) 1.8 million years ago
B) 2.0 million years ago
C) 3.0 million years ago
D) 45.0 million years ago
Some igneous rocks that originally formed at the
Mid-Atlantic Ridge are now 37 kilometers from the
ridge. Approximately how long ago did these rocks
form?
89. Base your answer to the following question on the map of the Mid-Atlantic Ridge shown below. Points A
through D are locations on the ocean floor. Line XY connects locations in North America and Africa.
A) B)
C) D)
In which cross section do the arrows best show the convection occurring within the asthenosphere beneath
line XY?
90. Base your answer to the following question on table below, which lists the location of some earthquakes,
their Richter magnitude, and their year of occurrence.
Identify the process in Earth’s asthenosphere that is inferred to be the cause of tectonic plate motion.
Base your answers to questions 91 through 93 on the
Earth Science Reference Tables and the diagram below.
The diagram is a model which represents one possible
interpretation of the movements of the Earth's rock
surfaces according to the theory of plate tectonics
(continental drift and sea floor spreading). According to
this interpretation, the Earth's lithosphere consists of
several large "plates" which are moving in relationship
to one another. The arrows in the diagram show some of
this relative motion of the "plates." The diagram shows
the age of formation of the igneous rocks that make up
the oceanic crust of the northern section of the Pacific
Plate.
A) North America and South America are moving
toward each other.
B) The India Plate is moving away from the Eurasia
Plate.
C) The Africa Plate and Eurasia Plate are moving
away from the America Plate.
D) The Antarctica Plate is moving away from the
America Plate.
91. Which statement is best supported by the relative
movement shown by the arrows in the diagram?
A) thick continental crust
B) thick layers of sediment
C) mid-ocean ridge
D) granitic igneous rock
92. Which geologic structure is represented by the double
line separating the America Plate from the Africa and
Eurasia Plates?
A) convection currents in the mantle
B) faulting of the lithosphere
C) the spin of the Earth on its axis
D) prevailing wind belts of the troposphere
93. Which provides the best explanation of the mechanism
that causes these "plates" to move across the Earth's
surface?
A) convection currents exist in the asthenosphere
B) meteor craters are found beneath the oceans
C) climate change has melted huge glaciers
D) marine fossils have been uplifted to high
elevations
94. Hot springs on the ocean floor near the midocean ridges
provide evidence that
A) differences in densities of earth materials
B) subsidence of the crust
C) occurrence of earthquakes
D) rotation of the Earth
95. The primary cause of convection currents in the Earth's
mantle is believed to be the
96. Base your answer to the following question on the
information below.
A camper takes a 100-gram piece of basalt rock from a
campfire and places it in a cup holding 250 milliliters of
water. The temperature of the rock is 300ºC and the
temperature of the water is 20ºC. Air temperature also
is 20ºC.
A) B)
C) D)
Which diagram best represents the convection currents
in the cup of water after the warm piece of basalt was
placed in it?
A) B)
C) D)
97. Which diagram best represents the convection currents
in a container of water when the bottom of the
container is heated at the center?
A) B)
C) D)
98. Which diagram best represents the direction of
convection currents around the burning wood of a
campfire?
A) rigid mantle B) asthenosphere
C) outer core D) inner core
99. Which part of Earth’s interior is inferred to have
convection currents that cause tectonic plates to move?
A) B)
C) D)
100. Which cross-sectional diagram of Earth’s
asthenosphere best shows the convection currents that
would cause crustal plate X to drift away from crustal
plate Y?
101. Which cross-sectional diagram of a portion of the crust
and mantle best shows the pattern of mantle
convection currents that are believed to cause the
formation of a mid-ocean ridge?
A)
B)
C)
D)
A) 50° N, 120° W B) 25° N, 158° E
C) 25° N, 158° W D) 25° S, 158° E
102. Approximately what are the coordinates of the Hawaii
Hot Spot?
A) 32° S 18° W B) 32° S 18° E
C) 32° N 18° W D) 32° N 18° E
103. What is the approximate location of the Canary
Islands hot spot?
A) South American B) Antarctic
C) Nazca D) Pacific
104. On which plate is the Hawaii Hot Spot located?
105. The cross section below shows the direction of
movement of an oceanic plate over a mantle hot spot,
resulting in the formation of a chain of volcanoes
labeled A, B, C, and D. The geologic age of volcano C
is shown.
A) B is 5 million years old and D is 12 million years
old.
B) B is 2 million years old and D is 6 million years
old.
C) B is 9 million years old and D is 9 million years
old.
D) B is 10 million years old and D is 4 million years
old.
What are the most likely geologic ages of volcanoes B
and D?
106. Base your answer to the following question on The block diagram below shows the bedrock age as
measured by radioactive dating and the present location of part of the Hawaiian Island chain. These
volcanic islands may have formed as the Pacific Plate moved over a mantle hot spot.
A) south B) east C) southwest D) northwest
This diagram provides evidence that the Pacific Crustal Plate was moving toward the

Mais conteúdo relacionado

Mais procurados

02 chapter: Earthquake: Strong Motion and Estimation of Seismic Hazard
02 chapter: Earthquake: Strong Motion and Estimation of Seismic Hazard02 chapter: Earthquake: Strong Motion and Estimation of Seismic Hazard
02 chapter: Earthquake: Strong Motion and Estimation of Seismic HazardPriodeep Chowdhury
 
1_ Introduction to Optical Mineralogy, Light & Theories-converted.pdf
1_ Introduction to Optical Mineralogy, Light & Theories-converted.pdf1_ Introduction to Optical Mineralogy, Light & Theories-converted.pdf
1_ Introduction to Optical Mineralogy, Light & Theories-converted.pdfAdnanKhan153072
 
EARTHQUAKE
EARTHQUAKEEARTHQUAKE
EARTHQUAKEsuchi4
 
The Thrust fault architecture in the External Sierras (new)
The Thrust fault architecture in the External Sierras (new)The Thrust fault architecture in the External Sierras (new)
The Thrust fault architecture in the External Sierras (new)Isaac Kenyon
 
Stereographic projection
Stereographic projection Stereographic projection
Stereographic projection PurvaPandey3
 
Tectono-magmatic Development of Accreted West Burma Block from Gondwana Land-...
Tectono-magmatic Development of Accreted West Burma Block from Gondwana Land-...Tectono-magmatic Development of Accreted West Burma Block from Gondwana Land-...
Tectono-magmatic Development of Accreted West Burma Block from Gondwana Land-...MYO AUNG Myanmar
 
Fundamentals of Seismic Refraction
Fundamentals of Seismic RefractionFundamentals of Seismic Refraction
Fundamentals of Seismic RefractionAli Osman Öncel
 
Calculating the magnitude of an Earthquake
Calculating the magnitude of an Earthquake  Calculating the magnitude of an Earthquake
Calculating the magnitude of an Earthquake Anju Soman
 
Seismic refraction method lecture 21
Seismic refraction method lecture 21Seismic refraction method lecture 21
Seismic refraction method lecture 21Amin khalil
 
Introduction to electromagnetic exploration method
Introduction to electromagnetic exploration methodIntroduction to electromagnetic exploration method
Introduction to electromagnetic exploration methodoilandgas24
 
Layersof earthppt mj_krech
Layersof earthppt mj_krechLayersof earthppt mj_krech
Layersof earthppt mj_krechParkScienceMs74
 
Isostasy and Flexure Of Lithosphere: Estimation Of Effective Elastic Thickness
Isostasy and Flexure Of Lithosphere: Estimation Of Effective Elastic ThicknessIsostasy and Flexure Of Lithosphere: Estimation Of Effective Elastic Thickness
Isostasy and Flexure Of Lithosphere: Estimation Of Effective Elastic ThicknessAvadhesh Shukla
 
Gravity, Expl.ravity
 Gravity, Expl.ravity Gravity, Expl.ravity
Gravity, Expl.ravityahmadraza05
 

Mais procurados (20)

Seismic waves
Seismic wavesSeismic waves
Seismic waves
 
02 chapter: Earthquake: Strong Motion and Estimation of Seismic Hazard
02 chapter: Earthquake: Strong Motion and Estimation of Seismic Hazard02 chapter: Earthquake: Strong Motion and Estimation of Seismic Hazard
02 chapter: Earthquake: Strong Motion and Estimation of Seismic Hazard
 
Shearwaves2
Shearwaves2Shearwaves2
Shearwaves2
 
1_ Introduction to Optical Mineralogy, Light & Theories-converted.pdf
1_ Introduction to Optical Mineralogy, Light & Theories-converted.pdf1_ Introduction to Optical Mineralogy, Light & Theories-converted.pdf
1_ Introduction to Optical Mineralogy, Light & Theories-converted.pdf
 
EARTHQUAKE
EARTHQUAKEEARTHQUAKE
EARTHQUAKE
 
The Thrust fault architecture in the External Sierras (new)
The Thrust fault architecture in the External Sierras (new)The Thrust fault architecture in the External Sierras (new)
The Thrust fault architecture in the External Sierras (new)
 
Density log and its uses
Density log and its usesDensity log and its uses
Density log and its uses
 
Stereographic projection
Stereographic projection Stereographic projection
Stereographic projection
 
Tectono-magmatic Development of Accreted West Burma Block from Gondwana Land-...
Tectono-magmatic Development of Accreted West Burma Block from Gondwana Land-...Tectono-magmatic Development of Accreted West Burma Block from Gondwana Land-...
Tectono-magmatic Development of Accreted West Burma Block from Gondwana Land-...
 
Fundamentals of Seismic Refraction
Fundamentals of Seismic RefractionFundamentals of Seismic Refraction
Fundamentals of Seismic Refraction
 
Calculating the magnitude of an Earthquake
Calculating the magnitude of an Earthquake  Calculating the magnitude of an Earthquake
Calculating the magnitude of an Earthquake
 
Seismic refraction method lecture 21
Seismic refraction method lecture 21Seismic refraction method lecture 21
Seismic refraction method lecture 21
 
Introduction to electromagnetic exploration method
Introduction to electromagnetic exploration methodIntroduction to electromagnetic exploration method
Introduction to electromagnetic exploration method
 
Earthquake seismology
Earthquake seismologyEarthquake seismology
Earthquake seismology
 
Layersof earthppt mj_krech
Layersof earthppt mj_krechLayersof earthppt mj_krech
Layersof earthppt mj_krech
 
Isostasy and Flexure Of Lithosphere: Estimation Of Effective Elastic Thickness
Isostasy and Flexure Of Lithosphere: Estimation Of Effective Elastic ThicknessIsostasy and Flexure Of Lithosphere: Estimation Of Effective Elastic Thickness
Isostasy and Flexure Of Lithosphere: Estimation Of Effective Elastic Thickness
 
Gravity Method
Gravity MethodGravity Method
Gravity Method
 
Graphiclogs
GraphiclogsGraphiclogs
Graphiclogs
 
Unit 5
Unit 5Unit 5
Unit 5
 
Gravity, Expl.ravity
 Gravity, Expl.ravity Gravity, Expl.ravity
Gravity, Expl.ravity
 

Semelhante a Review 6 _earthquakes___crustal_activity_sc

Review 7 weathering__erosion__deposition_sc
Review 7 weathering__erosion__deposition_scReview 7 weathering__erosion__deposition_sc
Review 7 weathering__erosion__deposition_scLexume1
 
Assignment 3.Please review the course web site for access dates.docx
Assignment 3.Please review the course web site for access dates.docxAssignment 3.Please review the course web site for access dates.docx
Assignment 3.Please review the course web site for access dates.docxdanielfoster65629
 
Review 8 landscapes_sc
Review 8 landscapes_scReview 8 landscapes_sc
Review 8 landscapes_scLexume1
 
Weathering and erosion regents practice
Weathering and erosion regents practiceWeathering and erosion regents practice
Weathering and erosion regents practiceRichard Coleman
 
117 ways regents_review_1of_2_sc
117 ways regents_review_1of_2_sc117 ways regents_review_1of_2_sc
117 ways regents_review_1of_2_scLexume1
 
Weathering And Erosion Exam
Weathering And Erosion ExamWeathering And Erosion Exam
Weathering And Erosion Examguest4823242
 
UMC Final -1st Term 2012----Solution
UMC   Final -1st Term 2012----SolutionUMC   Final -1st Term 2012----Solution
UMC Final -1st Term 2012----SolutionEhab AL-Timimi
 
Name ______________________ Class _________________ Date .docx
Name ______________________  Class _________________  Date .docxName ______________________  Class _________________  Date .docx
Name ______________________ Class _________________ Date .docxrosemarybdodson23141
 
STUDENT’S NAME _________________________Multiple Choice – Hi.docx
STUDENT’S   NAME  _________________________Multiple Choice – Hi.docxSTUDENT’S   NAME  _________________________Multiple Choice – Hi.docx
STUDENT’S NAME _________________________Multiple Choice – Hi.docxhanneloremccaffery
 
QUESTION 1 – Of the following, which problem would a geologist NOT.docx
QUESTION 1 – Of the following, which problem would a geologist NOT.docxQUESTION 1 – Of the following, which problem would a geologist NOT.docx
QUESTION 1 – Of the following, which problem would a geologist NOT.docxmakdul
 
Ch07 Tutorial
Ch07 TutorialCh07 Tutorial
Ch07 TutorialJT T
 
Always pick the BEST answer. Please indicate your answer clearly..docx
Always pick the BEST answer.  Please indicate your answer clearly..docxAlways pick the BEST answer.  Please indicate your answer clearly..docx
Always pick the BEST answer. Please indicate your answer clearly..docxgalerussel59292
 
Mass movementChoose oneA.  happens only when the slope .docx
Mass movementChoose oneA.  happens only when the slope .docxMass movementChoose oneA.  happens only when the slope .docx
Mass movementChoose oneA.  happens only when the slope .docxtienboileau
 
Gate 2018 GG Solution (Geology Option)
Gate 2018 GG Solution (Geology Option)Gate 2018 GG Solution (Geology Option)
Gate 2018 GG Solution (Geology Option)Lawrence Kanyan
 
Review 9 earth_s_history_sc
Review 9 earth_s_history_scReview 9 earth_s_history_sc
Review 9 earth_s_history_scLexume1
 
Review 9 earth_s_history_sc
Review 9 earth_s_history_scReview 9 earth_s_history_sc
Review 9 earth_s_history_scLexume1
 

Semelhante a Review 6 _earthquakes___crustal_activity_sc (20)

Review 7 weathering__erosion__deposition_sc
Review 7 weathering__erosion__deposition_scReview 7 weathering__erosion__deposition_sc
Review 7 weathering__erosion__deposition_sc
 
Assignment 3.Please review the course web site for access dates.docx
Assignment 3.Please review the course web site for access dates.docxAssignment 3.Please review the course web site for access dates.docx
Assignment 3.Please review the course web site for access dates.docx
 
Ieso 2012-wr-geosphere
Ieso 2012-wr-geosphereIeso 2012-wr-geosphere
Ieso 2012-wr-geosphere
 
Review 8 landscapes_sc
Review 8 landscapes_scReview 8 landscapes_sc
Review 8 landscapes_sc
 
Weathering and erosion regents practice
Weathering and erosion regents practiceWeathering and erosion regents practice
Weathering and erosion regents practice
 
earth sci.pptx
earth sci.pptxearth sci.pptx
earth sci.pptx
 
117 ways regents_review_1of_2_sc
117 ways regents_review_1of_2_sc117 ways regents_review_1of_2_sc
117 ways regents_review_1of_2_sc
 
Weathering And Erosion Exam
Weathering And Erosion ExamWeathering And Erosion Exam
Weathering And Erosion Exam
 
UMC Final -1st Term 2012----Solution
UMC   Final -1st Term 2012----SolutionUMC   Final -1st Term 2012----Solution
UMC Final -1st Term 2012----Solution
 
09 review clickers
09 review clickers09 review clickers
09 review clickers
 
Unit Test Study Guide
Unit Test Study GuideUnit Test Study Guide
Unit Test Study Guide
 
Name ______________________ Class _________________ Date .docx
Name ______________________  Class _________________  Date .docxName ______________________  Class _________________  Date .docx
Name ______________________ Class _________________ Date .docx
 
STUDENT’S NAME _________________________Multiple Choice – Hi.docx
STUDENT’S   NAME  _________________________Multiple Choice – Hi.docxSTUDENT’S   NAME  _________________________Multiple Choice – Hi.docx
STUDENT’S NAME _________________________Multiple Choice – Hi.docx
 
QUESTION 1 – Of the following, which problem would a geologist NOT.docx
QUESTION 1 – Of the following, which problem would a geologist NOT.docxQUESTION 1 – Of the following, which problem would a geologist NOT.docx
QUESTION 1 – Of the following, which problem would a geologist NOT.docx
 
Ch07 Tutorial
Ch07 TutorialCh07 Tutorial
Ch07 Tutorial
 
Always pick the BEST answer. Please indicate your answer clearly..docx
Always pick the BEST answer.  Please indicate your answer clearly..docxAlways pick the BEST answer.  Please indicate your answer clearly..docx
Always pick the BEST answer. Please indicate your answer clearly..docx
 
Mass movementChoose oneA.  happens only when the slope .docx
Mass movementChoose oneA.  happens only when the slope .docxMass movementChoose oneA.  happens only when the slope .docx
Mass movementChoose oneA.  happens only when the slope .docx
 
Gate 2018 GG Solution (Geology Option)
Gate 2018 GG Solution (Geology Option)Gate 2018 GG Solution (Geology Option)
Gate 2018 GG Solution (Geology Option)
 
Review 9 earth_s_history_sc
Review 9 earth_s_history_scReview 9 earth_s_history_sc
Review 9 earth_s_history_sc
 
Review 9 earth_s_history_sc
Review 9 earth_s_history_scReview 9 earth_s_history_sc
Review 9 earth_s_history_sc
 

Mais de Lexume1

Lesson flow charts 2
Lesson flow charts 2Lesson flow charts 2
Lesson flow charts 2Lexume1
 
Lesson flow charts 1
Lesson flow charts 1Lesson flow charts 1
Lesson flow charts 1Lexume1
 
Ap exam big idea 7 global impact
Ap exam big idea 7 global impactAp exam big idea 7 global impact
Ap exam big idea 7 global impactLexume1
 
Lesson pseudocode
Lesson  pseudocodeLesson  pseudocode
Lesson pseudocodeLexume1
 
Ap exam big idea 6 the internet
Ap exam big idea 6 the internetAp exam big idea 6 the internet
Ap exam big idea 6 the internetLexume1
 
Ap exam big idea 5 programming
Ap exam big idea 5 programmingAp exam big idea 5 programming
Ap exam big idea 5 programmingLexume1
 
Ap exam big idea 4 algorithms
Ap exam big idea 4 algorithmsAp exam big idea 4 algorithms
Ap exam big idea 4 algorithmsLexume1
 
Ap exam big idea 3 data and information
Ap exam big idea 3 data and informationAp exam big idea 3 data and information
Ap exam big idea 3 data and informationLexume1
 
Ap exam big idea 2 abstraction
Ap exam big idea 2 abstractionAp exam big idea 2 abstraction
Ap exam big idea 2 abstractionLexume1
 
Lesson4.4 u4 l1 using hex
Lesson4.4 u4 l1 using hexLesson4.4 u4 l1 using hex
Lesson4.4 u4 l1 using hexLexume1
 
Lesson4.3 u4 l1 hexadecimal representation
Lesson4.3 u4 l1 hexadecimal representationLesson4.3 u4 l1 hexadecimal representation
Lesson4.3 u4 l1 hexadecimal representationLexume1
 
Lesson4.2 u4 l1 binary squences
Lesson4.2 u4 l1 binary squencesLesson4.2 u4 l1 binary squences
Lesson4.2 u4 l1 binary squencesLexume1
 
Lesson4.1 u4 l1 binary representation
Lesson4.1 u4 l1 binary representationLesson4.1 u4 l1 binary representation
Lesson4.1 u4 l1 binary representationLexume1
 
Lesson4.0 unit 4 the internet and global impact
Lesson4.0 unit 4  the internet and global impactLesson4.0 unit 4  the internet and global impact
Lesson4.0 unit 4 the internet and global impactLexume1
 
Lesson4.9 d u4l3 hierarchy of open protocols
Lesson4.9 d u4l3 hierarchy of open protocolsLesson4.9 d u4l3 hierarchy of open protocols
Lesson4.9 d u4l3 hierarchy of open protocolsLexume1
 
Lesson4.9 c u4l3 tcp (transmission control protocol)
Lesson4.9 c u4l3 tcp (transmission control protocol)Lesson4.9 c u4l3 tcp (transmission control protocol)
Lesson4.9 c u4l3 tcp (transmission control protocol)Lexume1
 
Lesson4.9 b u4l3 ip addresses
Lesson4.9 b u4l3 ip addressesLesson4.9 b u4l3 ip addresses
Lesson4.9 b u4l3 ip addressesLexume1
 
Lesson4.9 a u4l2 html
Lesson4.9 a u4l2 htmlLesson4.9 a u4l2 html
Lesson4.9 a u4l2 htmlLexume1
 
Lesson4.8 u4 l2 address hierarchy
Lesson4.8 u4 l2 address hierarchyLesson4.8 u4 l2 address hierarchy
Lesson4.8 u4 l2 address hierarchyLexume1
 
Lesson4.7 u4 l2 network redundancy
Lesson4.7 u4 l2 network redundancyLesson4.7 u4 l2 network redundancy
Lesson4.7 u4 l2 network redundancyLexume1
 

Mais de Lexume1 (20)

Lesson flow charts 2
Lesson flow charts 2Lesson flow charts 2
Lesson flow charts 2
 
Lesson flow charts 1
Lesson flow charts 1Lesson flow charts 1
Lesson flow charts 1
 
Ap exam big idea 7 global impact
Ap exam big idea 7 global impactAp exam big idea 7 global impact
Ap exam big idea 7 global impact
 
Lesson pseudocode
Lesson  pseudocodeLesson  pseudocode
Lesson pseudocode
 
Ap exam big idea 6 the internet
Ap exam big idea 6 the internetAp exam big idea 6 the internet
Ap exam big idea 6 the internet
 
Ap exam big idea 5 programming
Ap exam big idea 5 programmingAp exam big idea 5 programming
Ap exam big idea 5 programming
 
Ap exam big idea 4 algorithms
Ap exam big idea 4 algorithmsAp exam big idea 4 algorithms
Ap exam big idea 4 algorithms
 
Ap exam big idea 3 data and information
Ap exam big idea 3 data and informationAp exam big idea 3 data and information
Ap exam big idea 3 data and information
 
Ap exam big idea 2 abstraction
Ap exam big idea 2 abstractionAp exam big idea 2 abstraction
Ap exam big idea 2 abstraction
 
Lesson4.4 u4 l1 using hex
Lesson4.4 u4 l1 using hexLesson4.4 u4 l1 using hex
Lesson4.4 u4 l1 using hex
 
Lesson4.3 u4 l1 hexadecimal representation
Lesson4.3 u4 l1 hexadecimal representationLesson4.3 u4 l1 hexadecimal representation
Lesson4.3 u4 l1 hexadecimal representation
 
Lesson4.2 u4 l1 binary squences
Lesson4.2 u4 l1 binary squencesLesson4.2 u4 l1 binary squences
Lesson4.2 u4 l1 binary squences
 
Lesson4.1 u4 l1 binary representation
Lesson4.1 u4 l1 binary representationLesson4.1 u4 l1 binary representation
Lesson4.1 u4 l1 binary representation
 
Lesson4.0 unit 4 the internet and global impact
Lesson4.0 unit 4  the internet and global impactLesson4.0 unit 4  the internet and global impact
Lesson4.0 unit 4 the internet and global impact
 
Lesson4.9 d u4l3 hierarchy of open protocols
Lesson4.9 d u4l3 hierarchy of open protocolsLesson4.9 d u4l3 hierarchy of open protocols
Lesson4.9 d u4l3 hierarchy of open protocols
 
Lesson4.9 c u4l3 tcp (transmission control protocol)
Lesson4.9 c u4l3 tcp (transmission control protocol)Lesson4.9 c u4l3 tcp (transmission control protocol)
Lesson4.9 c u4l3 tcp (transmission control protocol)
 
Lesson4.9 b u4l3 ip addresses
Lesson4.9 b u4l3 ip addressesLesson4.9 b u4l3 ip addresses
Lesson4.9 b u4l3 ip addresses
 
Lesson4.9 a u4l2 html
Lesson4.9 a u4l2 htmlLesson4.9 a u4l2 html
Lesson4.9 a u4l2 html
 
Lesson4.8 u4 l2 address hierarchy
Lesson4.8 u4 l2 address hierarchyLesson4.8 u4 l2 address hierarchy
Lesson4.8 u4 l2 address hierarchy
 
Lesson4.7 u4 l2 network redundancy
Lesson4.7 u4 l2 network redundancyLesson4.7 u4 l2 network redundancy
Lesson4.7 u4 l2 network redundancy
 

Último

Ensuring Technical Readiness For Copilot in Microsoft 365
Ensuring Technical Readiness For Copilot in Microsoft 365Ensuring Technical Readiness For Copilot in Microsoft 365
Ensuring Technical Readiness For Copilot in Microsoft 3652toLead Limited
 
New from BookNet Canada for 2024: BNC CataList - Tech Forum 2024
New from BookNet Canada for 2024: BNC CataList - Tech Forum 2024New from BookNet Canada for 2024: BNC CataList - Tech Forum 2024
New from BookNet Canada for 2024: BNC CataList - Tech Forum 2024BookNet Canada
 
Developer Data Modeling Mistakes: From Postgres to NoSQL
Developer Data Modeling Mistakes: From Postgres to NoSQLDeveloper Data Modeling Mistakes: From Postgres to NoSQL
Developer Data Modeling Mistakes: From Postgres to NoSQLScyllaDB
 
Vertex AI Gemini Prompt Engineering Tips
Vertex AI Gemini Prompt Engineering TipsVertex AI Gemini Prompt Engineering Tips
Vertex AI Gemini Prompt Engineering TipsMiki Katsuragi
 
Human Factors of XR: Using Human Factors to Design XR Systems
Human Factors of XR: Using Human Factors to Design XR SystemsHuman Factors of XR: Using Human Factors to Design XR Systems
Human Factors of XR: Using Human Factors to Design XR SystemsMark Billinghurst
 
DevEX - reference for building teams, processes, and platforms
DevEX - reference for building teams, processes, and platformsDevEX - reference for building teams, processes, and platforms
DevEX - reference for building teams, processes, and platformsSergiu Bodiu
 
Search Engine Optimization SEO PDF for 2024.pdf
Search Engine Optimization SEO PDF for 2024.pdfSearch Engine Optimization SEO PDF for 2024.pdf
Search Engine Optimization SEO PDF for 2024.pdfRankYa
 
WordPress Websites for Engineers: Elevate Your Brand
WordPress Websites for Engineers: Elevate Your BrandWordPress Websites for Engineers: Elevate Your Brand
WordPress Websites for Engineers: Elevate Your Brandgvaughan
 
Advanced Computer Architecture – An Introduction
Advanced Computer Architecture – An IntroductionAdvanced Computer Architecture – An Introduction
Advanced Computer Architecture – An IntroductionDilum Bandara
 
Artificial intelligence in cctv survelliance.pptx
Artificial intelligence in cctv survelliance.pptxArtificial intelligence in cctv survelliance.pptx
Artificial intelligence in cctv survelliance.pptxhariprasad279825
 
Dev Dives: Streamline document processing with UiPath Studio Web
Dev Dives: Streamline document processing with UiPath Studio WebDev Dives: Streamline document processing with UiPath Studio Web
Dev Dives: Streamline document processing with UiPath Studio WebUiPathCommunity
 
Take control of your SAP testing with UiPath Test Suite
Take control of your SAP testing with UiPath Test SuiteTake control of your SAP testing with UiPath Test Suite
Take control of your SAP testing with UiPath Test SuiteDianaGray10
 
Unleash Your Potential - Namagunga Girls Coding Club
Unleash Your Potential - Namagunga Girls Coding ClubUnleash Your Potential - Namagunga Girls Coding Club
Unleash Your Potential - Namagunga Girls Coding ClubKalema Edgar
 
Designing IA for AI - Information Architecture Conference 2024
Designing IA for AI - Information Architecture Conference 2024Designing IA for AI - Information Architecture Conference 2024
Designing IA for AI - Information Architecture Conference 2024Enterprise Knowledge
 
"LLMs for Python Engineers: Advanced Data Analysis and Semantic Kernel",Oleks...
"LLMs for Python Engineers: Advanced Data Analysis and Semantic Kernel",Oleks..."LLMs for Python Engineers: Advanced Data Analysis and Semantic Kernel",Oleks...
"LLMs for Python Engineers: Advanced Data Analysis and Semantic Kernel",Oleks...Fwdays
 
TeamStation AI System Report LATAM IT Salaries 2024
TeamStation AI System Report LATAM IT Salaries 2024TeamStation AI System Report LATAM IT Salaries 2024
TeamStation AI System Report LATAM IT Salaries 2024Lonnie McRorey
 
"Debugging python applications inside k8s environment", Andrii Soldatenko
"Debugging python applications inside k8s environment", Andrii Soldatenko"Debugging python applications inside k8s environment", Andrii Soldatenko
"Debugging python applications inside k8s environment", Andrii SoldatenkoFwdays
 
Unraveling Multimodality with Large Language Models.pdf
Unraveling Multimodality with Large Language Models.pdfUnraveling Multimodality with Large Language Models.pdf
Unraveling Multimodality with Large Language Models.pdfAlex Barbosa Coqueiro
 
What's New in Teams Calling, Meetings and Devices March 2024
What's New in Teams Calling, Meetings and Devices March 2024What's New in Teams Calling, Meetings and Devices March 2024
What's New in Teams Calling, Meetings and Devices March 2024Stephanie Beckett
 

Último (20)

Ensuring Technical Readiness For Copilot in Microsoft 365
Ensuring Technical Readiness For Copilot in Microsoft 365Ensuring Technical Readiness For Copilot in Microsoft 365
Ensuring Technical Readiness For Copilot in Microsoft 365
 
New from BookNet Canada for 2024: BNC CataList - Tech Forum 2024
New from BookNet Canada for 2024: BNC CataList - Tech Forum 2024New from BookNet Canada for 2024: BNC CataList - Tech Forum 2024
New from BookNet Canada for 2024: BNC CataList - Tech Forum 2024
 
Developer Data Modeling Mistakes: From Postgres to NoSQL
Developer Data Modeling Mistakes: From Postgres to NoSQLDeveloper Data Modeling Mistakes: From Postgres to NoSQL
Developer Data Modeling Mistakes: From Postgres to NoSQL
 
Vertex AI Gemini Prompt Engineering Tips
Vertex AI Gemini Prompt Engineering TipsVertex AI Gemini Prompt Engineering Tips
Vertex AI Gemini Prompt Engineering Tips
 
Human Factors of XR: Using Human Factors to Design XR Systems
Human Factors of XR: Using Human Factors to Design XR SystemsHuman Factors of XR: Using Human Factors to Design XR Systems
Human Factors of XR: Using Human Factors to Design XR Systems
 
E-Vehicle_Hacking_by_Parul Sharma_null_owasp.pptx
E-Vehicle_Hacking_by_Parul Sharma_null_owasp.pptxE-Vehicle_Hacking_by_Parul Sharma_null_owasp.pptx
E-Vehicle_Hacking_by_Parul Sharma_null_owasp.pptx
 
DevEX - reference for building teams, processes, and platforms
DevEX - reference for building teams, processes, and platformsDevEX - reference for building teams, processes, and platforms
DevEX - reference for building teams, processes, and platforms
 
Search Engine Optimization SEO PDF for 2024.pdf
Search Engine Optimization SEO PDF for 2024.pdfSearch Engine Optimization SEO PDF for 2024.pdf
Search Engine Optimization SEO PDF for 2024.pdf
 
WordPress Websites for Engineers: Elevate Your Brand
WordPress Websites for Engineers: Elevate Your BrandWordPress Websites for Engineers: Elevate Your Brand
WordPress Websites for Engineers: Elevate Your Brand
 
Advanced Computer Architecture – An Introduction
Advanced Computer Architecture – An IntroductionAdvanced Computer Architecture – An Introduction
Advanced Computer Architecture – An Introduction
 
Artificial intelligence in cctv survelliance.pptx
Artificial intelligence in cctv survelliance.pptxArtificial intelligence in cctv survelliance.pptx
Artificial intelligence in cctv survelliance.pptx
 
Dev Dives: Streamline document processing with UiPath Studio Web
Dev Dives: Streamline document processing with UiPath Studio WebDev Dives: Streamline document processing with UiPath Studio Web
Dev Dives: Streamline document processing with UiPath Studio Web
 
Take control of your SAP testing with UiPath Test Suite
Take control of your SAP testing with UiPath Test SuiteTake control of your SAP testing with UiPath Test Suite
Take control of your SAP testing with UiPath Test Suite
 
Unleash Your Potential - Namagunga Girls Coding Club
Unleash Your Potential - Namagunga Girls Coding ClubUnleash Your Potential - Namagunga Girls Coding Club
Unleash Your Potential - Namagunga Girls Coding Club
 
Designing IA for AI - Information Architecture Conference 2024
Designing IA for AI - Information Architecture Conference 2024Designing IA for AI - Information Architecture Conference 2024
Designing IA for AI - Information Architecture Conference 2024
 
"LLMs for Python Engineers: Advanced Data Analysis and Semantic Kernel",Oleks...
"LLMs for Python Engineers: Advanced Data Analysis and Semantic Kernel",Oleks..."LLMs for Python Engineers: Advanced Data Analysis and Semantic Kernel",Oleks...
"LLMs for Python Engineers: Advanced Data Analysis and Semantic Kernel",Oleks...
 
TeamStation AI System Report LATAM IT Salaries 2024
TeamStation AI System Report LATAM IT Salaries 2024TeamStation AI System Report LATAM IT Salaries 2024
TeamStation AI System Report LATAM IT Salaries 2024
 
"Debugging python applications inside k8s environment", Andrii Soldatenko
"Debugging python applications inside k8s environment", Andrii Soldatenko"Debugging python applications inside k8s environment", Andrii Soldatenko
"Debugging python applications inside k8s environment", Andrii Soldatenko
 
Unraveling Multimodality with Large Language Models.pdf
Unraveling Multimodality with Large Language Models.pdfUnraveling Multimodality with Large Language Models.pdf
Unraveling Multimodality with Large Language Models.pdf
 
What's New in Teams Calling, Meetings and Devices March 2024
What's New in Teams Calling, Meetings and Devices March 2024What's New in Teams Calling, Meetings and Devices March 2024
What's New in Teams Calling, Meetings and Devices March 2024
 

Review 6 _earthquakes___crustal_activity_sc

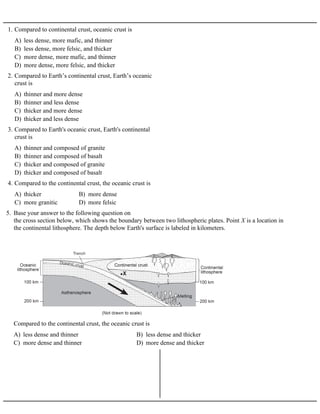
  • 1. A) less dense, more mafic, and thinner B) less dense, more felsic, and thicker C) more dense, more mafic, and thinner D) more dense, more felsic, and thicker 1. Compared to continental crust, oceanic crust is A) thinner and more dense B) thinner and less dense C) thicker and more dense D) thicker and less dense 2. Compared to Earth’s continental crust, Earth’s oceanic crust is A) thinner and composed of granite B) thinner and composed of basalt C) thicker and composed of granite D) thicker and composed of basalt 3. Compared to Earth's oceanic crust, Earth's continental crust is A) thicker B) more dense C) more granitic D) more felsic 4. Compared to the continental crust, the oceanic crust is 5. Base your answer to the following question on the cross section below, which shows the boundary between two lithospheric plates. Point X is a location in the continental lithosphere. The depth below Earth's surface is labeled in kilometers. A) less dense and thinner B) less dense and thicker C) more dense and thinner D) more dense and thicker Compared to the continental crust, the oceanic crust is
  • 2. A) low density and is mafic B) low density and is felsic C) high density and is mafic D) high density and is felsic 6. When two tectonic plates collide, oceanic crust usually subducts beneath continental crust because oceanic crust is primarily composed of igneous rock that has A) continental crust B) oceanic crust C) plastic mantle D) rigid mantle 7. In which part of the Earth are felsic rocks most likely to be found? A) nitrogen B) oxygen C) silicon D) iron 8. Which element is most abundant by mass in the Earth's crust? A) oxygen, potassium, sodium, and calcium B) hydrogen, oxygen, nitrogen, and potassium C) aluminum, iron, silicon, and magnesium D) aluminum, calcium, hydrogen, and iron 9. What are the four most abundant elements, by volume, in the Earth's crust? 10. The diagram below represents a cross section of a portion of the Earth's crust where no overturning of the rock layers has occurred. Two rock layers are labeled A and B. A) Deposition occurred before folding or faulting. B) Faulting occurred before folding of the rock layers. C) Faulting occurred before the formation of rock layer A. D) Folding occurred before the formation of rock layer B. Which statement describes the most likely sequence of events? 11. Base your answer on the geologic cross section below. A) folding at A B) the intrusion at B C) faulting at C D) the unconformity at D Which geologic event occurred most recently? 12. The diagram below shows a cross section of a portion of Earth's crust. A) bedrock folding B) bedrock faulting C) stream erosion D) volcanic activity The hills of this area were formed primarily by 13. The diagram below shows the bedrock structure beneath a series of hills. A) folding B) faulting C) deposition D) vulcanism Which process was primarily responsible for forming the hills?
  • 3. 14. The diagram below represents a geologic cross section of a portion of Earth's crust. A) Gayle shale B) Freeport sandstone C) Erie coal, but before formation of Freeport sandstone D) Dunbar limestone, but before formation of Erie coal Folding and erosion occurred after the formation of the 15. Base your answer to the following question on the geologic cross section below in which overturning has not occurred. Letters A through H represent rock layers. A) folding ® uplift ® erosion ® deposition B) intrusion ® erosion ® folding ® uplift C) erosion ® folding ® deposition ® intrusion D) deposition ® uplift ® erosion ® folding Which sequence of events most likely caused the unconformity shown at the bottom of rock layer B?
  • 4. 16. The block diagram below shows a part of the eastern coastline of North America. Points A, B, and C are reference points along the coast. A) A — folding; B — subduction; C — crosscutting B) A — weathering; B — erosion; C — deposition C) A — faulting; B — conduction; C — mass movement D) A — precipitation; B — infiltration; C — evaporation Which list best represents the primary processes occurring along the coastline at points A, B, and C? 17. The diagram below shows a cross section of the Earth's crust. Line XY is a fault. A) B) C) D) Which sequence of events, from oldest to youngest, has occurred in this outcrop?
  • 5. 18. The diagrams below show geologic cross sections of the same part of the Earth's crust at different times in the geologic past. A) A ® B ® C ® D B) C ® D ® A ® B C) C ® A ® D ® B D) A ® C ® B ® D Which sequence shows the order in which this part of the crust probably formed? 19. Base your answer to the following question on the diagrams below which represent two rock outcrops found several miles apart in New York State. Individual rock layers are lettered, and fossils and rock types are indicated. A) F, B, E, D B) C, A, F, D C) F, E, C, A D) C, E, D, A In which sequence are the rock layers listed in order from oldest to youngest? A) shale schist phyllite slate gneiss B) shale slate phyllite schist gneiss C) shale gneiss phyllite slate schist D) shale gneiss phyllite schist slate 20. Which sequence of change in rock type occurs as shale is subjected to increasing heat and pressure? 21. Base your answer to the following question on The diagram below shows a geologic cross section. Letters A through D represent different rock units. A) A ® B ® C ®D B) C ® D ® A ®B C) D ® B ®A ®C D) D ® C ® B ®A Which sequence correctly shows the age of the lettered rock units, from oldest to youngest?
  • 6. 22. Base your answer to the following question on The cross section below shows rock layers A, B, C, D, and fault F. The rock layers have not been overturned. A) D C B A F B) A B C D F C) F D C B A D) F A B C D Which sequence places the rock layers and fault in order from oldest to youngest? 23. Base your answer to the following question on The cross section below shows a rock sequence that has not been overturned. A) Shale was deposited. B) Glacial till was deposited. C) Basaltic lava flows solidified. D) Glossopteris flourished and then became extinct. Which event occurred last at this location?
  • 7. 24. Base your answer to the following question on the example of a seismogram and set of instructions for determining the Richter magnitude of an earthquake below. The example shows the Richter magnitude of an earthquake 210 kilometers from a seismic station. Instructions for determining Richter magnitude: • Determine the distance to the epicenter of the earthquake. (The distance in the example is 210 kilometers.) • Measure the maximum wave height of the S-wave recorded on the seismogram. (The height in the example is 23 millimeters.) • Place a straightedge between the distance to the epicenter (210 kilometers) and the height of the largest S -wave (23 millimeters) on the appropriate scales. Draw a line connecting these two points. The magnitude of the earthquake is determined by where the line intersects the Richter magnitude scale. (The magnitude of this example is 5.0.)
  • 8. Using the set of instructions and the seismogram and scales below, determine the Richter magnitude of an earthquake that was located 500 kilometers from this seismic station.
  • 9. 25. Base your answer to the following question on The seismogram below shows P-wave and S-wave arrival times at a seismic station following an earthquake. A) 1,600 km B) 3,200 km C) 4,400 km D) 5,600 km The distance from this seismic station to the epicenter of teh earthquake is approximately 26. The seismogram below shows the arrival times of an earthquake's P-wave and S-wave recorded at a seismic station in Portland, Oregon. A) 1800 km B) 2500 km C) 3200 km D) 4100 km What was the distance from Portland to the earthquake's epicenter?
  • 10. 27. An earthquake recorded by seismic stations around the world created the pattern of seismic wave recordings shown in the diagram below A) Some seismic waves cannot travel through oceans to reach every location on Earth. B) S-waves are too weak to travel very far from the earthquake focus. C) Mountain ranges and tectonic plate boundaries absorb or bend seismic waves. D) Layers with different properties inside Earth absorb or bend seismic waves. Which statement best explains this pattern of wave recordings? 28. The seismogram below shows the time that an earthquake P-wave arrived at a seismic station. A) 1,900 km B) 3,200 km C) 4,000 km D) 5,200 km If the earthquake occurred at exactly 10:00 p.m., approximately how far from the earthquake epicenter from the seismic station?
  • 11. 29. Base your answer to question 43 on the seismogram below. The seismogram was recorded at a seismic station and shows the arrival times of the first P-wave and S-wave from an earthquake. A) P-wave arrival time, only B) S-wave arrival time, only C) difference in the arrival time of the P-wave and S-wave D) difference in the height of the P-wave and S-wave Which part of this seismogram is used to find the distance to the epicenter of the earthquake? 30. Base your answer to the following question on The diagram below represents three seismograms showing the same earthquake as it was recorded at three different seismic stations, A, B, and C. A) A is closest to the epicenter, and C is farthest from the epicenter. B) B is closest to the epicenter, and C is farthest from the epicenter. C) C is closest to the epicenter, and A is farthest from the epicenter. D) A is the closest to the epicenter, and B is the farthest from the epicenter. Which statement correctly describes the distance between the earthquake epicenter and these seismic stations?
  • 12. A) 7 minutes 20 seconds B) 5 minutes 10 seconds C) 3 minutes 20 seconds D) 4 minutes 10 seconds 31. A seismic station is 2,000 kilometers from an earthquake epicenter. How long does it take an S-wave to travel from the epicenter to the station? A) 4:24 p.m. B) 4:29 p.m. C) 4:36 p.m. D) 4:56 p.m. 32. If a seismograph recording station located 5,700 kilometers from an epicenter receives a P-wave at 4:45 p.m., at which time did the earthquake actually occur at the epicenter? 33. Base your answer to the following question on the map below which shows epicenters of some of the earthquakes that occurred in North America during a 2-week period. Five epicenters are labeled A through E. Denver and New York City are also indicated. A) 1 min 20 sec B) 5 min 40 sec C) 7 min 30 sec D) 10 min 00 sec The distance from epicenter E to New York City is 3,000 kilometers. What was the approximate travel time for the P-waves from this epicenter to New York City?
  • 13. A) 11 min 15 sec B) 9 min 35 sec C) 5 min 20 sec D) 4 min 20 sec 34. The epicenter of an earthquake is located 2,800 kilometers from a seismic station. Approximately how long did the S-wave take to travel from the epicenter to the station? A) 6 mm 40 sec B) 9 mm 40 sec C) 15 mm 00 sec D) 19 mm 00 sec 35. A P-wave takes 8 minutes and 20 seconds to travel from the epicenter of an earthquake to a seismic station. Approximately how long will an S-wave take to travel from the epicenter of the same earthquake to this seismic station? A) When the P-waves and S-waves are near the epicenter, they both travel at the same speed. B) The velocity of P-waves and S-waves is constant, regardless of the distance traveled. C) P-waves always travel faster than S-waves, regardless of the distance traveled. D) S-waves always travel about twice as fast as P -waves. 36. Which generalization about earthquake S-waves and P -waves is correct? 37. The seismogram below shows the arrival times of P- and S-waves at a seismic station in hours, minutes, and seconds. A) 1,650 km B) 1,900 km C) 2,200 km D) 4,100 km Approximately how far from the earthquake epicenter is this seismic station? 38. Base your answer to the following question on the diagram of the Earth below showing the observed pattern of waves recorded after an earthquake. A) crust in zone 1 B) mantle in zone 2 C) crust in zone 3 D) core of the Earth The location of the epicenter of the earthquake that produced the observed wave pattern most likely is in the
  • 14. 39. Base your answer to the following question on the data table below, which gives information collected at seismic stations W, X, Y, and Z for the same earthquake. Some of the data have been omitted. A) W B) X C) Y D) Z Which seismic station was farthest from the earthquake epicenter? A) 1,000 km B) 1,500 km C) 2,000 km D) 2,500 km 40. A seismograph indicates the difference between the arrival of S-waves and P-waves to be 4 minutes. The distance of the seismograph station from the earthquake's epicenter is about A) 5:04:30 a.m. B) 5:05:40 a.m. C) 5:10:12 a.m. D) 6:15:00 a. m. 41. An earthquake occurred at 5:00:00 a.m. At what time would the P-wave reach a seismic station 3,000 kilometers from the epicenter? A) an iron-rich solid B) an iron-rich liquid C) a silicate-rich solid D) a silicate-rich liquid 42. The rock between 2,900 kilometers and 5,200 kilometers below the Earth's surface is inferred to be A) 6,500ºC B) 4,200ºC C) 3,500ºC D) 1,800ºC 43. At a depth of 2,000 kilometers, the temperature of the stiffer mantle is inferred to be A) analyzing worldwide seismic data B) measuring crustal temperature ranges C) determining crustal density differences D) observing rock samples from surface bedrock 44. The structure of the Earth's interior is best inferred by A) an iron-rich solid B) an iron-rich liquid C) a silicate-rich solid D) a silicate-rich liquid 45. The rock between 2,900 kilometers and 5,200 kilometers below the Earth's surface is inferred to be 46. Base your answer to the following question on the diagram below, which shows a cutaway view of Earth in which the interior layers are visible. The paths of earthquake waves generated at point X are shown. A, B, C, and D are locations of seismic stations on Earth's surface, and point E is located in Earth's interior. A) 1,500ºC B) 2,900ºC C) 5,000ºC D) 6,200ºC The actual rock temperature at point E is inferred to be approximately
  • 15. A) liquid, with an average density of approximately 4 g/cm3 B) liquid, with an average density of approximately 11 g/cm3 C) solid, with an average density of approximately 4 g/cm3 D) solid, with an average density of approximately 11 g/cm3 47. Earth’s outer core is best inferred to be A) liquid B) solid C) composed of a high percentage of iron D) under the same pressure 48. Earth’s outer core and inner core are both inferred to be A) the Moon’s interior B) the Moon’s composition C) Earth’s surface features D) Earth’s seismic data 49. Scientists have inferred the structure of Earth’s interior mainly by analyzing A) seismic waves B) crustal rocks C) radioactive decay rates D) magnetic pole reversals 50. Earth’s inner core is inferred to be solid based on the analysis of A) 1000°C B) 2500°C C) 4500°C D) 5000°C 51. The inferred temperature at the interface between the stiffer mantle and the asthenosphere is closest to A) 3500°C and 0.4 million atmospheres B) 3500°C and 2.0 million atmospheres C) 5500°C and 0.4 million atmospheres D) 5500°C and 2.0 million atmospheres 52. Which combination of temperature and pressure is inferred to occur within Earth’s stiffer mantle? A) crust B) mantle C) outer core D) inner core 53. A part of which zone of the Earth's interior is inferred to have a density of 10.0 grams per cubic centimeter? A) 1 million atmospheres B) 2 million atmospheres C) 3 million atmospheres D) 4 million atmospheres 54. The pressure at the interface between the inner core and outer core of the Earth is inferred to be approximately 55. Base your answer to the following question on the diagram below which represents Earth's interior zones. A) crust B) mantle C) outer core D) inner core In which layer of Earth's interior is the inferred temperature 6,000°C? A) continents moved due to changes in the Earth's orbital velocity B) continents moved due to the Coriolis effect caused by the Earth's rotation C) present-day continents of South America and Africa are moving toward each other D) present-day continents of South America and Africa once fit together like puzzle parts 56. The theory of continental drift suggests that the A) Basaltic rock is found to be progressively younger at increasing distances from a mid-ocean ridge. B) Marine fossils are often found in deep-well drill cores. C) The present continents appear to fit together as pieces of a larger landmass. D) Areas of shallow-water seas tend to accumulate sediment, which gradually sinks. 57. Which statement best supports the theory of continental drift?
  • 16. A) the seafloor is spreading B) the ocean basins are older than the continents C) the mid-ocean ridges are higher than the nearby plains D) Earth's rate of rotation has changed 58. Magnetic readings taken across mid-ocean ridges provide evidence that A) African plate and Antarctic plate B) Nazca plate and South American plate C) China plate and Philippine plate D) Australian plate and Eurasian plate 59. Seafloor spreading is occurring at the boundary between the A) The bedrock of the ridge and nearby seafloor is igneous rock. B) The ridge is the location of irregular volcanic eruptions. C) Several faults cut across the ridge and nearby seafloor. D) Seafloor bedrock is younger near the ridge and older farther away. 60. Which observation about the Mid-Atlantic Ridge region provides the best evidence that the seafloor has been spreading for millions of years? A) crust B) asthenosphere C) outer core D) inner core 61. In which Earth layer are most convection currents that cause seafloor spreading thought to be located? Base your answers to questions 62 through 64 on the diagram below which shows the magnetic orientation of igneous rock on the seafloor on the east (right) side of a mid-ocean ridge. The pattern on the west (left) side of the ridge has been omitted. The age of the igneous rock and its distance from the ridge center are shown. A) The orientation of the Earth's magnetic field has reversed with time. B) The size of the continents has changed with time. C) The elevation of sea level has changed with time. D) The amount of fossil material preserved in the igneous rock has changed with time. 62. Which inference can best be made from the diagram? A) B) C) D) 63. Which diagram below best represents the pattern of magnetic orientation in the seafloor on the west (left) side of the ocean ridge? A) destruction of oceanic crust B) destruction of continental crust C) existence of ancestral mountains D) existence of rising mantle convection currents 64. The occurrence of high-heat floors at the ridge center provides evidence of the
  • 17. 65. Base your answer to the following question on The diagram below shows the interaction of two tectonic plates. A) Antarctic Plate and the African Plate B) Antarctic Plate and the Indian-Australian Plate C) South American Plate and the Nazca Plate D) South American Plate and the African Plate The type of plate boundary represented in the diagram most likely exists between the A) at a convergent plate boundary B) above a mantle hot spot C) above a mid-ocean ridge D) near the center of a large plate 66. According to tectonic plate maps, New York State is presently located 67. Base your answer to the following question on The block diagram below shows the boundary between two tectonic plates. A) divergent B) convergent C) transform D) complex Which type of plate boundary is shown?
  • 18. 68. Base your answer to the following question on the diagram below, which shows an incomplete concept map identifying the types of plate boundaries. Information in the boxes labeled A, B, C, D,and E has been deliberately omitted. On the geographic map shown above, write the letters D and E on the plate boundary locations where the indicated movements are occurring. Write the letters approximately the same size as shown on the concept map and locate the letters directly on the plate boundary.
  • 19. 69. Base your answer to the following question on the world map shown below. Letters A through H represent locations on Earth’s surface. Explain why location A has a greater probability of experiencing a major earthquake than location D. A) the mid-Atlantic ridge B) the Aleutian trench C) the Atlantic-Indian ridge D) the Pacific/North American plate boundary 70. Which of the following locations is the site of a convergent plate boundary? A) B) C) D) 71. Which diagram best shows the type of plate boundary found between the China Plate and the Philippine Plate? A) Southwest Indian Ridge B) Iceland Hotspot C) Marianas Trench D) Sandwich Plate 72. Which of the following is located at a converging plate boundary? A) convergent B) transform C) divergent D) complex 73. What type of plate boundary exists between the African Plate and the Antartic Plate?
  • 20. 74. Base your answer to the following question on The map below shows the northern section of the boundary between the Arabian Plate and theAfrican Plate. Arrows show the relative direction of plate motion. A) divergent B) subduction C) convergent D) transform Which type of plate boundary is located at the Jordan Fault? A) Nazca Plate and Antarctic Plate B) Pacific Plate and Indian-Australian Plate C) Indian-Australian Plate and Antarctic Plate D) Nazca Plate and Pacific Plate 75. At which plate boundary is one lithospheric plate sliding under another?
  • 21. 76. Base your answer to the following question on Arrows in the block diagram below show the relative movement along a tectonic plate boundary. A) Nazca Plate and South American Plate B) Eurasian Plate and Indian-Australian Plate C) North American Plate and Eurasian Plate D) Pacific Plate and North American Plate Between which two tectonic plates does this type of plate boundary exist?
  • 22. Base your answers to questions 77 and 78 on the world map in your answer booklet and on your knowledge of Earth science. The map shows major earthquakes and volcanic activity occurring from 1996 through 2000. Letter A represents a volcano on a crustal plate boundary. 77. Identify the type of plate movement responsible for the presence of the volcano at location A. 78. Place an X on the map to show the location of the Nazca Plate.
  • 23. 79. The diagram below shows a tectonic plate boundary. A) Hawaii Hot Spot B) Yellowstone Hot Spot C) Galapagos Hot Spot D) Canary Hot Spot Which mantle hot spot is at a plate boundary like the one shown in this diagram?
  • 24. 80. Base your answer to the following question on The block diagram below shows a tectonic plate boundary. Points A and B represent locations on Earth’s surface. A) B) C) D) Which graph best shows the depths of most major earthquakes whose epicenters lie between A and B?
  • 25. 81. Base your answer to the following question on the map below, which shows the depths of selected earthquakes along the crustal plate boundary near the west coast of South America. Letters A, B, C, and D are epicenter locations along a west-to-east line at the surface. The relative depth of each earthquake is indicated. A) B) C) D) Which graph best shows the depth of earthquakes beneath epicenters A, B, C, and D?
  • 26. 82. Base your answer to the following question on the block diagram below. The diagram shows the tectonic plate boundary between Africa and North America 300 million years ago, as these two continents united into a single landmass. The arrows at letters A, B, C, and D represent relative crustal movements. Letter X shows the eruption of a volcano at that time. Identify the type of tectonic plate motion represented by the arrow shown at D. A) Mid-Atlantic Ridge B) Yellowstone Hot Spot C) San Andreas Fault D) Peru-Chile Trench 83. Alternating parallel bands of normal and reversed magnetic polarity are found in the basaltic bedrock on either side of the A) Parallel strips of igneous rocks on each side of the ridge show matching reversals of magnetic polarity. B) The fossils found on one side of the ridge are younger than the fossils found on the other side. C) The age of the rocks decreases as the distance from the ridge increases. D) Seafloor temperatures increase as the distance from the ridge increases. 84. Which statement provides evidence that the seafloor is spreading out from both sides of the Mid-Atlantic Ridge? A) younger B) thicker C) less dense D) more felsic 85. Compared to the continental crust of central North America, the oceanic crust of the Mid-Atlantic Ridge is 86. Which map best represents the general pattern of magnetism in the oceanic bedrock near the mid-Atlantic Ridge? A) B) C) D)
  • 27. 87. Base your answer to the following question on The diagram below represents the pattern of normal and reversed magnetic polarity and the relative age of the igneous bedrock composing the ocean floor on the east side of the Mid-Atlantic Ridge. The magnetic polarity of the bedrock on the west side of the ridge has been deliberately left blank. A) B) C) D) Which diagram best shows the magnetic pattern and relative age of the igneous bedrock on the west side of the ridge?
  • 28. 88. The scale below shows the age of rocks in relation to their distance from the Mid-Atlantic Ridge. A) 1.8 million years ago B) 2.0 million years ago C) 3.0 million years ago D) 45.0 million years ago Some igneous rocks that originally formed at the Mid-Atlantic Ridge are now 37 kilometers from the ridge. Approximately how long ago did these rocks form? 89. Base your answer to the following question on the map of the Mid-Atlantic Ridge shown below. Points A through D are locations on the ocean floor. Line XY connects locations in North America and Africa. A) B) C) D) In which cross section do the arrows best show the convection occurring within the asthenosphere beneath line XY?
  • 29. 90. Base your answer to the following question on table below, which lists the location of some earthquakes, their Richter magnitude, and their year of occurrence. Identify the process in Earth’s asthenosphere that is inferred to be the cause of tectonic plate motion.
  • 30. Base your answers to questions 91 through 93 on the Earth Science Reference Tables and the diagram below. The diagram is a model which represents one possible interpretation of the movements of the Earth's rock surfaces according to the theory of plate tectonics (continental drift and sea floor spreading). According to this interpretation, the Earth's lithosphere consists of several large "plates" which are moving in relationship to one another. The arrows in the diagram show some of this relative motion of the "plates." The diagram shows the age of formation of the igneous rocks that make up the oceanic crust of the northern section of the Pacific Plate. A) North America and South America are moving toward each other. B) The India Plate is moving away from the Eurasia Plate. C) The Africa Plate and Eurasia Plate are moving away from the America Plate. D) The Antarctica Plate is moving away from the America Plate. 91. Which statement is best supported by the relative movement shown by the arrows in the diagram? A) thick continental crust B) thick layers of sediment C) mid-ocean ridge D) granitic igneous rock 92. Which geologic structure is represented by the double line separating the America Plate from the Africa and Eurasia Plates? A) convection currents in the mantle B) faulting of the lithosphere C) the spin of the Earth on its axis D) prevailing wind belts of the troposphere 93. Which provides the best explanation of the mechanism that causes these "plates" to move across the Earth's surface? A) convection currents exist in the asthenosphere B) meteor craters are found beneath the oceans C) climate change has melted huge glaciers D) marine fossils have been uplifted to high elevations 94. Hot springs on the ocean floor near the midocean ridges provide evidence that A) differences in densities of earth materials B) subsidence of the crust C) occurrence of earthquakes D) rotation of the Earth 95. The primary cause of convection currents in the Earth's mantle is believed to be the
  • 31. 96. Base your answer to the following question on the information below. A camper takes a 100-gram piece of basalt rock from a campfire and places it in a cup holding 250 milliliters of water. The temperature of the rock is 300ºC and the temperature of the water is 20ºC. Air temperature also is 20ºC. A) B) C) D) Which diagram best represents the convection currents in the cup of water after the warm piece of basalt was placed in it? A) B) C) D) 97. Which diagram best represents the convection currents in a container of water when the bottom of the container is heated at the center? A) B) C) D) 98. Which diagram best represents the direction of convection currents around the burning wood of a campfire? A) rigid mantle B) asthenosphere C) outer core D) inner core 99. Which part of Earth’s interior is inferred to have convection currents that cause tectonic plates to move? A) B) C) D) 100. Which cross-sectional diagram of Earth’s asthenosphere best shows the convection currents that would cause crustal plate X to drift away from crustal plate Y? 101. Which cross-sectional diagram of a portion of the crust and mantle best shows the pattern of mantle convection currents that are believed to cause the formation of a mid-ocean ridge? A) B) C) D) A) 50° N, 120° W B) 25° N, 158° E C) 25° N, 158° W D) 25° S, 158° E 102. Approximately what are the coordinates of the Hawaii Hot Spot? A) 32° S 18° W B) 32° S 18° E C) 32° N 18° W D) 32° N 18° E 103. What is the approximate location of the Canary Islands hot spot? A) South American B) Antarctic C) Nazca D) Pacific 104. On which plate is the Hawaii Hot Spot located?
  • 32. 105. The cross section below shows the direction of movement of an oceanic plate over a mantle hot spot, resulting in the formation of a chain of volcanoes labeled A, B, C, and D. The geologic age of volcano C is shown. A) B is 5 million years old and D is 12 million years old. B) B is 2 million years old and D is 6 million years old. C) B is 9 million years old and D is 9 million years old. D) B is 10 million years old and D is 4 million years old. What are the most likely geologic ages of volcanoes B and D?
  • 33. 106. Base your answer to the following question on The block diagram below shows the bedrock age as measured by radioactive dating and the present location of part of the Hawaiian Island chain. These volcanic islands may have formed as the Pacific Plate moved over a mantle hot spot. A) south B) east C) southwest D) northwest This diagram provides evidence that the Pacific Crustal Plate was moving toward the