2. immunologic response. Developmental effects include changes in
neurobehavior, cognition, dentition, thyroid and immune status, and
reproductive organ development, as well as altered sex ratios among
exposed offspring (USEPA, 2003; White and Birnbaum, 2009). Finally,
The US Environmental Protection Agency (EPA) has classified 2,3,7,8-
TCDD and related compounds as probable human carcinogens
(USEPA, 2003). Activation of the Aryl hydrocarbon Receptor (AhR)
has been identified as a common mechanism of action for the
biochemical effects of dioxins on vertebrates (USEPA, 2003; White
and Birnbaum, 2009).
PCDDs and dioxin-like compounds have been found worldwide in
edible marine species including crab (Domingo and Bocio, 2007).
Food, including seafood, is the major pathway pf human exposure
(USEPA, 2003). Similar instances of elevated dioxin contamination
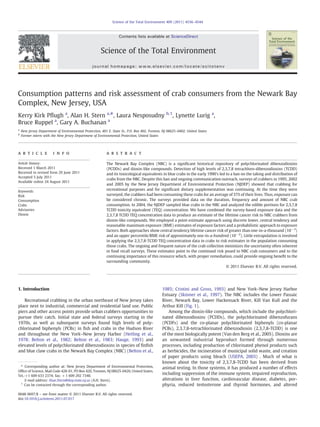
Fig. 1. Location of crabber surveys and crab sampling. Newark Bay Complex, New Jersey, USA.
4537K.K. Pflugh et al. / Science of the Total Environment 409 (2011) 4536–4544
3. have been found in sediments and fish/crabs in other locations; blue
crabs in a Texas, USA estuarine system were found to accumulate
elevated levels of PCDDs and polychlorinated dibenozofurans
(PCDFs), with the sediments the probable dominant route for PCDD/
F exposure to both crabs and fish (Dean, 2009). Crab hepatopancreas
have also been used to monitor trends of PCDD/Fs from pulp mills
(Yunker et al., 2002).
Body burdens of dioxins and dioxin-like compounds were found to
be statistically higher in pregnant women who resided for approx-
imately 10 years near a pentachlorophenol plant, a source of dioxins,
compared to those pregnant women who lived there less than 2 years
(Chen et al., 2006).
Although the NBC is a historically contaminated urban waterway
with respect to a variety of chemicals and sources, it is particularly
notable for the high levels of 2,3,7,8-TCDD and related compounds
present in its sediment. These compounds are available for uptake by
its aquatic biota. Despite urban background sources and relatively
minor point sources of 2,3,7,8-TCDD, the main burden of this
compound in the NBC results from its historic release from the
Diamond Alkali (also known as the OU-1) facility on the lower Passaic
River (see Fig. 1) (Tong et al., 1990; Bopp et al., 1991).
The State of New Jersey (Departments of Environmental Protection
and Health) first issued advisories in 1982 based on PCB concentrations,
including an Emergency Rule prohibiting the sale of striped bass and
American eels from the Hudson River, Upper New York Bay, and the
NBC. In 1983, these departments declared a prohibition on the sale or
consumption of all fish and crabs taken from the tidal Passaic River due
to significantly elevated levels of dioxins in crabs and fish in the NBC
(Belton et al., 1985). This was expanded in 1984 to include prohibition
against sale or consumption of any fish and shellfish taken from the
mouth of the Passaic River upstream to the Dundee Dam. Additionally,
NJ prohibited the sale or consumption of striped bass and blue crabs
taken from Newark Bay, the tidal Hackensack, the Arthur Kill, and Kill
Van Kull. In 1994, the commercial and recreational harvest of crabs from
the NBC was also prohibited. This was based, in part, on additional
dioxin data (Cristini and Gross, 1993) and in part on concerns for public
health resulting from reports that blue claw crabs taken from the NBC
were being sold in local fish markets and restaurants.
The aquatic species of choice for recreational fishers and those
supplementing their diets with self-caught food in the NBC is the blue
claw crab (Callinectes sapidus), a migratory species that inhabits all of
the waters of the NBC. The blue claw crab is a bottom dweller and
bottom feeder. Anecdotal information from our sampling campaigns
and from the recreational crabbers indicates that because the area is
closed to commercial crabbing, the species has grown in size and
increased in abundance in these waters. As a result, the blue claw crab
is easily caught and eaten and shared with friends and family and has
reportedly been sold to local restaurants and fish markets. Its
increased size and abundance has made NBC blue crabs even more
attractive to crabbers. Despite the ban on crabbing in these waters and
signage warning against consumption, significant amounts of crab-
bing have continued.
In the early 1990's, New Jersey initiated an active public
information campaign in this region to address the issue of
consumption of recreationally caught fish and crabs. This included
an angler survey to learn more about the crabbing and fishing
community and consumption habits of crabbers and anglers (Burger
et al., 1999; Pflugh et al., 1999). Several studies of recreational anglers
have been conducted in this region to determine knowledge and
awareness of these advisories and to learn consumption patterns and
possible human health exposure to contaminants in fish. Most of
these studies have focused on the consumers' awareness and
understanding of the dangers of eating finfish (May and Burger,
1996; Pflugh et al., 1999).
Few studies have looked at the consumption patterns of
recreational crabbers and calculated the health risk. The goal of this
analysis is to characterize consumption patterns, exposure and risk to
consumers of self-caught crabs from the Newark Bay Complex.
In 1995, 2002 and again, in 2005, the NJDEP undertook on-site
surveys of crabbing and crab consumption in the NBC. We present
here the results of those surveys as they relate to crab consumption
and an assessment of the lifetime cancer risk from 2,3,7,8 TCDD and its
polychlorinated dibenzodioxin toxic equivalents (TEQs) based on the
survey data. The questions asked in the 1995 survey did not provide
sufficient information to calculate the full range of risk in this
population. Thus, we present the relevant exposure parameters
obtained from the 1995 survey, but we focus on the 2002 and 2005
surveys.
2. Methods
2.1. Study area
The Newark Bay Complex in New Jersey is a highly industrialized
urban area with a tidal river system that runs through more than 30
municipalities in five counties. It encompasses a large racially and
culturally mixed population of more than three million people. The
NBC, which is part of the Port of New York-New Jersey, includes active
and closed landfills, power plants, waste water treatment plants, with
industrial, commercial and residential properties lining its shores
(Pflugh et al., 1999). In addition, there is a limited number of areas
with public access to the water. The Diamond Alkali Superfund site in
Newark, New Jersey was the site of pesticide and herbicide production
including the defoliant, Agent Orange, for several decades and is a
major source of 2,3,7,8-TCDD to the NBC. This Superfund site is
composed of three operable units: the former pesticides manufactur-
ing plant and surrounding properties, the Lower Passaic River
Restoration Project Study Area and the Newark Bay Study Area
(USEPA, 2009). The Lower Passaic River Restoration Project Study
Area comprises all 17 miles of the Lower Passaic River downstream of
the Dundee Dam to Newark Bay. The sediments of the NBC have been
contaminated over many decades with dioxins, PCBs, mercury, DDT,
pesticides, heavy metals and other pollutants from various sources.
2.2. Survey protocol
Prior to formal initiation of the 1995 survey, field surveillance was
conducted over the course of one year to identify commonly frequented
angling and crabbing locations. Interview surveys were subsequently
conducted at these locations in a focused manner. As opposed to a
random study design, the focused design allowed us to obtain
information from the population known to be engaged in crabbing.
Thus, by design, this study addresses risk that is specific to the crabbing
population, but does not describe the risk in the overall population, the
majority of which does not engage in crabbing. A team of two
interviewers was responsible for visiting approximately six sites each
survey day. Not all sites were visited every survey day, but all sites were
visited on Sunday through Saturday to get a sample of anglers at each
site on different days of the week and to determine if some days were
more popular than other days. Interviewers visited a given site at least
twice each field day in order to interview anglers and crabbers who
might arrive at different times during the course of the day. This
coverage helped to ensure the inclusion of a wide cross section of the
angler population in the survey. Interviews took approximately 15 to
20 min to complete. Interview teams usually entered the field during
high tide, when anglers would most likely be fishing and crabbing.
Additional information on the 1995 survey protocol is presented in
Burger et al. (1999) and Pflugh et al. (1999). The survey instrument
included questions on perception of risk, demographics, the respon-
dents' history of crabbing in the area and consumption.
For the 1995 angler survey, a pretest of the interview protocol was
conducted on a sample of the target population to ensure that the
4538 K.K. Pflugh et al. / Science of the Total Environment 409 (2011) 4536–4544
4. questions were easily understood and that responses could be
obtained in a uniform fashion. Formal interviews were conducted
from July through October 1995 for 39 field days. Interviews were
conducted with 300 crabbers and anglers. Of these, 124 were crabbers
interviewed at 26 crabbing sites around the NBC.
The crabberstudies conducted in 2002 and again in 2005 werescaled
back from the larger 1995 study both in terms of the number of sites
visited and breadth of questions. Data collected for these more recent
surveys were collected by NJDEP personnel and by volunteers who
underwent training on survey procedures by NJDEP personnel. Sites
visited in 2002 and 2005 were the same as those visited in 1995 with the
exception of the Hackensack River where some of the 2002/2005
surveys were conducted in slightly different locations from the 1995
surveys. (all survey locations are shown in Fig. 1). The smaller sample
sizes in 2002 and 2005 compared to 1995 result from a reduction in
survey effort rather than a change in the crabber population.
In the 2002 and 2005 surveys, participants were asked at the
beginning of the survey whether they had previously taken an angler/
crabbing survey administered either by the NJDEP or by some other
group. If they answered that they had previously been surveyed by the
NJDEP, no further questions were asked. If they had previously been
surveyed by another group, they were eligible for the NJDEP survey,
but generally declined. Surveys lasted 15–30 min. Crabbers were,
therefore, likely to remember having been surveyed previously. This
protocol likely precluded all or nearly all double counting of crabbers.
Table 1 presents the survey questions relevant to the assessment
of risk from crab consumption. Except as indicated, all questions were
asked in 1995, 2002 and 2005.
2.3. Overall analytical design
Estimates of crab intake were derived directly from the survey data
as the product of the frequency of NBC crab consumption and the
number of crabs consumed per meal. Estimates of 2,3,7,8 TCDD TEQ
exposure were derived as the product of the measured TEQ
concentration in the edible portion of the crabs and the crab intake.
Details of each of these parameters are presented below. Fig. 1 shows
the locations where surveys were conducted and the locations where
crabs were sampled.
Since the survey designs from both 2002 and 2005 are essentially
the same, the data were compiled into a single database. Summing the
data from the 2002 and 2005 surveys, 37 survey questionnaires
contained useable data on crab consumption. Of these, 14 were from
2002 and 23 were from 2005. Data on the number of crabs-per-meal
and the frequency of crab consumption used in the estimates of risk
were taken directly from the 2002 and 2005 surveys. Unlike the 2002
and 2005 surveys, the 1995 survey did not contain a question that
asked during which months crabs were consumed. Thus, daily intake
data could not be scaled to reflect the portion of the year when no
crabbing occurred. Therefore, the 1995 survey data were not compiled
with the later survey data. The demographic data and the data on
consumption during the crabbing season from 1995 are compared to
the corresponding data from 2002/2005 in Table 2.
2.4. Crab sampling
In 2004, as part of the New Jersey Department of Environmental
Protection's Routine Monitoring for Toxics in Fish Program, samples of
blue crabs were collected throughout the NBC. From July to September
2004, a total of 22 composite crab samples were obtained using
commercial crab traps from six collection sites in the Passaic River,
Hackensack River, Newark Bay and Arthur Kill (Fig. 1). Three to five
composite samples consisting of five crabs each were analyzed from
each station. Table 3 presents the sampling locations within the NBC,
the number of crabs and the number of resulting composite samples
each containing five adult crabs. Crabs averaged 14.4 cm in carapace
width. This size can be compared to the legal size limit of 11.4 cm
(4½ in.) for crabs (in permitted locations) in New Jersey. Crabs were
transported to the laboratory on ice and then frozen at ≤−20.0 °C
until tissue processing.
Table 1
Survey questions relevant to assessment of crab consumption.
Question Possible answers
Do you eat blue crabs caught in Hackensack, Passaic, Newark Bay,
Arthur Kill, Kill Van Kull all year long or during the summer season?
[Check answer that applies] All year round; Summer only; Does not eat blue crabs
Which months do you actively crab in the Hackensack, Passaic,
Newark Bay, Arthur Kill, Kill Van Kull?
[Circle all that apply] Jan; Feb; Mar; April; May; June; July; Aug; Sept; Oct; Nov; Dec
Which months do you eat blue crabs caught in Hackensack, Passaic,
Newark Bay, Arthur Kill, Kill Van Kull?
[Circle all that apply] Jan; Feb; Mar; April; May; June; July; Aug; Sept; Oct; Nov; Dec
How do you store this blue crab for later consumption? [Circle all that apply] Refrigerate; Salt; Can; Freeze; Smoke; Other
How often do you eat blue crab from the Hackensack, Passaic, Newark Bay,
Arthur Kill, Kill Van Kull during non-fishing (winter) season?
[Circle one] a) every day; b) 2–3 times per week; c) once a week; d) twice a month;
e) once a month; f) less than once a month
How do you prepare blue crab from Hackensack, Passaic, Newark Bay,
Arthur Kill, Kill Van Kull?
[Circle all that apply] a) boil; b) stew; c) fry; d) broil; e) bake; f) other (explain)
Do you cook with or eat the cooking fluid from the crab? [Check yes or no]
Do you remove the mustard/green gland/hepatopancreas (2002 only)? [Check yes or no]
What parts of the crab do you eat? [Check all that apply] Claws; Legs; Body meat; Mustard/green gland/hepatopancreas; Other
How often do you and members of your household eat locally
caught Blue Crabs?
[Circle one] a) every day; b) 2–3 times per week; c) once a week; d) twice a month;
e) once a month; f) less than once a month
Approximate portion size each of your household members eats at one meal? [Circle one] a) 1 to 3 crabs; b) 3 to 5 crabs; c) more than 5 crabs
Age and gender of crabber: Fill in
How many years has the crabber been eating locally caught blue crabs? Fill in
Give crabs to people outside household (2005 only)? [Check yes or no]
Table 2
Summary demographic and crab consumption data from the 1995 and combined
2002/2005 surveys.
1995 2002/2005
Number of respondents 124 37
Percent male 90% 100%
Age Mean (S.D.) 46 (13.5) a
43 (12.4)
Mean of years consuming NBC crabs 28 a
15
Mean percentage of current age during which
respondents consumed NBC crabs (S.D.)
– 37% (34%)
Reported number of NBC crabs consumed per meal,
Mean (90th percentile)
7.7 (19.0)a
8.1 (13.6)a
Frequency of NBC crab consumption per week
during the crabbing season, Mean (90th percentile)
2.5 (4.5)a
2.8 (5.9)a
a
Data (except for crabs consumed per meal for 2002) were originally provided as
ranges. The comparison was based on sampling the distribution constructed from the
mid-points of the individual range categories.
4539K.K. Pflugh et al. / Science of the Total Environment 409 (2011) 4536–4544
5. 2.4.1. Measurement of organ mass
To create each composite sample, muscle tissue including claw and
backfin tissue was removed in the laboratory from each of five crabs,
combined and weighed (Horwitz et al., 2005, 2006). Hepatopancreas
tissue was handled in a similar manner. The mass of muscle or
hepatopancreas tissue per crab as well as the total edible portion
(muscle plus hepatopancreas) was estimated by dividing the total
sample mass by 5.
2.5. 2,3,7,8-TCDD-TEQ analysis
Laboratory analyses were conducted by the Geochemical and
Environmental Research Group (GERG) at Texas A&M University using
high resolution gas chromatography/high resolution mass spectrometry
(HRGC/HRMS) for 12 co-planer PCBs (EPA method 1668) and dioxin/
furans (modified EPA method 1613) (Buchanan et al., 2004; Horwitz et al.,
2005, 2006).Analyseswereconducted on compositesamples as described
above. Table 4 presents the compounds that were considered in
calculating the 2,3,7,8-TCDD-TEQ along with their toxicity equivalent
factor (TEF) that expresses the relative contribution of each compound to
the TEQ value (Van den Berg et al., 2006; 1998; WHO, 1997). The mean
TEQ concentration per crab was calculated as the sum of the muscle plus
hepatopancreas TEQ concentrations weighted by mass of each tissue. This
is presented in Table 3.
2.6. Coordination of survey data and crab sampling data
In the primary analysis, we used the data from all 37 — 2002 and
2005 surveys and the TEQ data from all NBC crab samples. This
approach is based on the fact that these crabs are a mobile and
migratory species and are representative of the NBC area as a whole.
Therefore, crabs sampled anywhere in the NBC could be caught
anywhere else in the NBC. Furthermore, the crabbers, themselves are
mobile and, as indicated in their responses to the survey, many
crabbers crab in multiple locations in the NBC. As a secondary
sensitivity analysis, we repeated the risk calculation using only those
surveys (n=30) from Elizabeth, Carteret, Sewaren and Perth Amboy
corresponding to the areas where crab samples were obtained (the
Arthur Kill and Elizabeth/Shooters Island).
2.7. The risk equation
Risk was estimated using the following equation:
Risk = CSF x C x M x P x Fð Þ= W
where:
CSF (pg TCDD/kg consumer body weight/day)−1
— cancer slope factor
C (pg TCDD//kg crab) — 2,3,7,8-TCDD-TEQ concentration
M (kg/crab) — mass of edible crab tissue/crab (including
hepatopancreas)
P (crabs/meal) — portion size
F (meals/day/year) — crab meal frequency averaged over the
entire year
W (kg consumer body weight)
2.7.1. Selection of input values in the risk equation
2.7.1.1. Fixed inputs. CSF — The cancer slope factor is the current USEPA
recommended value, — 1×10⁻³
(pg/kg/day)−1
(USEPA, 2003).
C — The concentration of 2,3,7,8-TCDD TEQ was taken as the mean
concentration for all the crabs sampled in the full NBC, 49.8 pg TCDD/g crab.
For the Arthur Kill area, the mean concentration was 34.7 pg TCDD/g crab.
The available funding for this project did not permit us to analyze a
sufficient number of individual crab samples in order to obtain an
estimate of interindividual variability in 2,3,7,8 TCDD TEQ concentration
among crabs. However, consistent with the statistical principle of
regression to the mean, with long term consumption of crabs randomly
caught in the NBC, consumers' intake of 2,3,7,8 TCDD TEQs will be
equivalent to the intake that would occur if consumers ate only crabs
having the mean TEQ concentration.
W — Because body weight was not obtained from the respondents
during the survey, the standard default adult value of 70 kg is used as
a fixed value.
M — Based on the data on consumption practices obtained in the
survey (see below), the mass of edible crab tissue was taken as the
mean of the sum of muscle tissue and hepatopancreas. As above, due
to regression to the mean, long-term consumption will result in
closely approximating the mean value for this parameter among all
available crabs. Therefore fixed values were used. For the full NBC this
value was 40.5 g per crab. For the Arthur Kill area, this value was
44.3 g per crab.
2.7.1.2. Variable inputs. For the variable inputs (P and F), two different
approaches were taken for selecting inputs. In the first approach,
point estimate values for discrete percentiles from the survey data for
P and F were identified. This approach brackets the range of risk
estimates that result from the range of these variables between a
central tendency estimate and a reasonable-maximum-exposure
(RME) estimate. The second approach was a probabilistic calculation
utilizing empirical distributions for P and F derived from the survey
data. Distributions were fitted to the data using BestFit software (ver.
2.0d, Palisade Corp., Newfield, NY). Probabilistic (Monte Carlo)
analysis was then carried out using @Risk software (ver. 3.5, Palisade
Corp., Newfield, NY). The probabilistic analysis was carried out using
Table 3
Summary of crab sampling locations, number of crabs sampled and number of
composites.
Blue crab sampling location Number of
blue crabs
collected
Number
of composted
samplesa
Mean TCDD TEQ
concentration
pg/g
(SD)
Upper Tidal Passaic River @ Kearny 25 5 47.1 (21.2)
Lower Passaic River @ Newark Bay 25 5 66.2 (18.8)
Hackensack River @ Laurel Hill 15 3 53.3 (4.8)
Newark Bay @ Turnpike Bridge 15 3 54.0 (27.9)
Newark Bay @ Shooters Island 15 3 47.6 (9.1)
Arthur Kill @ Fresh Kills LF 15 3 21.9 (4.1)
Total 110 22 –
Newark Bay Complex (All locations) 49.8 (20.5)
Arthur Kill (Newark Bay @ Shooters Island+
Arthur Kill @ Fresh Kills LF)
34.7 (15.4)
a
Samples were divided into composited muscle tissue and composited hepatopan-
creas tissue from five individual crabs. Muscle and hepatopancreas composites were
analyzed separately.
Table 4
Compounds included in the calculation of the 2,3,7.8-TCDD-TEQ and their relative
contribution (TEF).
Dioxins Furans Co-planar PCBs
Compound TEF Compound TEF Congener TEF
2,3,7,8-TCDD 1 2,3,7,8-TCDF 0.1 77 0.0001
1,2,3,7,8-PeCDD 1 1,2,3,7,8-PeCDF 0.03 81 0.0003
1,2,3,4,7,8-HxCDD 0.1 2,3,4,7,8-PeCDF 0.3 105 3E-05
1,2,3,6,7,8-HxCDD 0.1 1,2,3,4,7,8-HxCDF 0.1 114 3E-05
1,2,3,7,8,9-HxCDD 0.1 1,2,3,6,7,8-HxCDF 0.1 118 3E-05
1,2,3,4,6,7,8-HpCDD 0.01 2,3,4,6,7,8-HxCDF 0.1 123 3E-05
OCDD 0.0003 1,2,3,7,8,9-HxCDF 0.1 126 0.1
1,2,3,4,6,7,8-HpCDF 0.01 156 3E-05
1,2,3,4,7,8,9-HpCDF 0.01 157 3E-05
OCDF 0.0003 167 3E-05
169 0.03
189 3E-05
4540 K.K. Pflugh et al. / Science of the Total Environment 409 (2011) 4536–4544
6. Latin Hypercube sampling with 5000 iterations. This gave ample
stability to the moments and percentiles of the output distribution.
P — In the 2005 survey, the question asking how many NBC crabs
the respondent consumed per meal was posed with three possible
categorical answers: “1 to 3”; “3 to 5”; or “more than 5”. In the 2002
survey, respondents answered on a continuous single number scale.
We translated the responses in the 2002 survey into the appropriate
categories in the 2005 survey. To identify a discrete value for the
open-ended nature of the upper category in the 2005 data (“more
than 5”) we calculated the midpoint value of 12 crabs/meal from the
2002 data for responses in the range between 6 crabs/meal and the
maximum value (18 crabs/meal). We took that value as an estimate of
the midpoint value for the “more than 5” category in the 2005 data.
We also used the midpoint from each of the other categorical
responses for crabs-per-meal in the combined 2002 and 2005 data as
a discrete value for each respondent. Because this variable can assume
only three possible values, it is not practical to identify arbitrary
percentiles (e.g., 50%, 75%) of the population distribution. Instead, we
identified the percentiles of the survey population corresponding to
each of the possible categorical values for this variable. As shown in
Table 5, these three categories yield a lower, mid-range and upper
population percentile estimate of crabs/meal. For the probabilistic
analysis, P was specified as a discrete distribution with the categorical
values assigned a probability equal to the proportion of the re-
spondents in each category. This is illustrated in Fig. 2.
F — For frequency of crab consumption, crabbers were asked how
often they ate crabs caught from the NBC. Six categorical responses were
possible: “every day”; “2 to 3 times a week”; “once a week”; “twice a
month”; “once a month”; and “less than once a month”. In order to make
these data useable for the risk calculation, we translated all responses
into meals-per-day by dividing the categorical answer by days in the
referenced unit. Thus, “every day” corresponded to 1/day; “2 to 3 times a
week” corresponded to 0.36/day; “once a week” corresponded to 0.14/
day; and “twice a month” corresponded to 0.07/day; “once a month”
corresponded to 0.03/day; and “less than once a month” was translated
into 0.018 by assuming 0.5 meals per month. These translations are also
presented in Table 6. Because crabbing is less productive and more
inconvenient during the colder months, none of the survey respondents
consumed crabs every month of the year. We therefore, expressed the
daily rate of crab consumption as a yearly average that reflected the
number of months during which each respondent consumed NBC crabs.
We express this in units of crabs/day/year. For example, if an individual
reporting eating crabs “once a week”, corresponding to 0.14 meals-per-
day, during 2 months of the year (i.e., 17% of the year), the frequency of
crab consumption would be expressed as 0.02 meals/day/year. Point
estimates for selected percentiles (50th, 75th, and 90th) are shown in
Table 7. For the probabilistic analysis, the raw survey data for F were
found to be closely fit by a lognormal distribution (mean, standard
deviation=0.045, 0.026 meals/day/year). These distributions are pre-
sented graphically in Fig. 3a and b.
3. Results
3.1. Demographics and consumption patterns
Table 2 presents a comparison of selected demographic and
consumption data from the 1995 study, and the compiled 2002/2005
surveys. There was little change in either demographics or consump-
tion patterns during the crabbing season between the two groups of
surveys. For both survey groups, consumers reported eating NBC crabs
an average of 3 times per week during the crabbing season and
consuming an average of 8 NBC crabs per meal. The largest difference
is in the mean number of years that the crabbers had been consuming
Table 5
Distribution of the survey responses for P (the number of NBC crabs consumed per
meal) for the combined 2002 and 2005 surveys.
Number of NBC crabs consumed per meal 1–3 3–5 N5
Midpoint of the reporting category 2 4 12a
Newark Bay Complex data
n 8 17 11
Percent in each category 22.2 47.2 30.6
Cumulative percentile 22.2 69.4 100
Arthur Kill data
n 5 16 8
Percent in each category 17.2 55.2 27.6
Cumulative percentile 17.2 72.4 100
a
Based on the midpoint of the continuous in the 2002 survey for responses N5 crabs
per meal.
Discrete distribution for P (crabs/meal) -
Newark Bay Complex data
0
0.1
0.2
0.3
0.4
0.5
0.6
0.7
1 2 3 4 5 6 7 8 9 10 11 12 13
crabs/meal
probability
Discrete distribution for P (crabs/meal) - Arthur
Kill data
0
0.1
0.2
0.3
0.4
0.5
0.6
0.7
1 2 3 4 5 6 7 8 9 10 11 12 13
crabs/meal
probability
a
b
Fig. 2. a. Discrete distribution for P (crabs/meal) — Newark Bay Complex data.
b. Discrete distribution for P (crabs/meal) — Arthur Kill data.
Table 6
Frequency of crab meals/day — correspondence between categorical and continuous
responses for meals/day.
Categorical answer Response translated into meals-per-day
Every day 1
2 to 3 times a week 0.36
Once a week 0.14
Twice a month 0.07
Once a month 0.03
Less than once a month 0.018
Table 7
Point estimate values for (F) frequency of crab consumption for selected percentiles.
Variable 50th percentile
value
75th percentile
value
90th percentile
value
F (meals/day/year)
Newark Bay Complex
0.03 0.06 0.08
F (meals/day/year)
Arthur Kill
0.03 0.06 0.09
4541K.K. Pflugh et al. / Science of the Total Environment 409 (2011) 4536–4544
7. NBC crabs, with a value of 28 years for 1995 and 15 years for
2002/2005. Of particular note, based on their reported age and years
of consumption, the 2002/2005 respondents ate NBC caught crabs for
over 37% of their lives and ¾ of them have eaten crabs for up to 57% of
their lives. On average, the 2002/2005 respondents consumed crabs
during 32% of the year, with 26% consuming crabs at least 50% of the
year. Based on both duration and frequency of consumption, it is
reasonable to consider exposure to contaminants in NBC crabs to be
chronic. No obvious relationship was found between portion size and
frequency of crab consumption. Thus, there was no need to constrain
the Monte Carlo analysis on the basis of a correlation between these
two parameters.
In the 2005 survey, respondents were asked whether they
removed the hepatopancreas before cooking. Only 11 respondents
answered this question. However, among those respondents, only
four (36%) said that they removed the hepatopancreas. Although the
questions are not strictly comparable, in the 1995 survey, 19 of the
124 NBC crabbers surveyed (15%) reported eating crabs with the
hepatopancreas. In addition, when respondents in the 2002 and 2005
surveys were asked about cooking methods, 34 of the 37 respondents
(92%) said that they boiled the crabs. Removal of the hepatopancreas
prior to boiling requires cracking the shell. Our experience is that
cracking the shell is rarely done prior to boiling. Thus, it is likely that
boiling involves cooking the entire crab in its shell. We therefore,
consider that it is unlikely that the hepatopancreas would be removed
prior to boiling. We have, therefore, focused mainly on the risk to crab
consumers on the basis of the 2,3,7,8-TCDD TEQ concentration from
the combined muscle and hepatopancreas TEQs weighted by their
respective mass.
3.2. Crab TEQ data
Data for crabs from each of the 6 locations within the NBC was
reported as 3–5 separate analytical samples, each a composite of five
crabs. For the NBC as a whole, the mean muscle mass per crab was
33.86 g and the mean hepatopancreas mass was 6.6 g. This gives a
mean mass of edible tissue of 40.5 g per crab. The mean 2,3,7,8-TCDD
TEQ concentration for the crabs sampled from the NBC was 49.8 pg/g.
For muscle tissue, 65% and 27% of the TEQ respectively was
contributed by dioxins and PCBs. For the hepatopancreas, 45% and
36% respectively were contributed by dioxins and PCBs. For muscle
plus hepatopancreas, PCDFs accounted for less than 10% of the total
TEQs. We plan to present the distribution of the various TEQ
components in a separate publication.
3.3. Cancer risk
While there was little difference in consumption patterns between
1995 and 2002/2005 surveys, 2,3,7,8-TCDD TEQs were not routinely
measured in the NBC crabs in the period corresponding to the 1995
survey. In addition, dioxin concentrations declined somewhat
between the two groups of surveys. The point estimate risks were
calculated for both the full NBC data and the Arthur Kill subset of the
data by combining together the lower percentile, the mid-range
percentile and the upper percentile values for P and F. For the NBC
data, this resulted in the combination (for P and F respectively) of the
22nd and 50th percentiles, the 69th and 75th percentiles and the
100th and 90th percentiles. The latter combination in the NBC data
can be considered a reasonable maximum exposure estimate (RME).
This effectively bracketed the range of risk from the possible
combinations of the available data for these variable inputs. Note
that for P, the 100th percentile represents the maximum category (i.e.,
N5 crabs/meal with an estimated mid-point of 12 crabs/meal) rather
than the maximum individual and should not, therefore, be viewed as
an extreme upper percentile estimate. The results of this calculation
are presented in Table 8. These risks range from approximately
2×10⁻³
to 3×10⁻²
. The results of the cancer risk for the NBC
calculated by the Monte Carlo probabilistic approach directly
Table 8
Point estimate lifetime cancer risks from crab consumption.
Location Percentile of P
(crabs/meal)
Percentile of F
(meals/day/year)
Risk
Newark Bay Complex 22 50 1.73×10⁻³
69 75 6.91×10⁻³
100 90 (RME)a
2.77×10⁻²
Arthur Kill 17 50 1.32×10⁻³
72 75 5.28×10⁻³
100 90 (RME)a
2.37×10⁻²
a
Reasonable maximum exposure.
0
5
10
15
20
25
30
0 0.05 0.1 0.15 0.2
meals/day/year
probabilityprobability
0
5
10
15
20
25
0 0.05 0.1 0.15 0.2
meals/day/year
a
b
Fig. 3. a. Fit of lognormal distribution (mean=0.045, s.d.=0.026) to the survey data for
F (meal/day/year) — Newark Bay Complex data. b. Fit of lognormal distribution
(mean=0.044, s.d.=0.053) to the survey data for F (meal/day/year) — Arthur Kill data.
0
0.05
0.1
0.15
0.2
0.25
0.00E+00 6.00E-03 1.20E-02 1.80E-02 2.40E-02
Lifetime Cancer Risk
Probability
Fig. 4. Histogram of Monte Carlo probabilistic analysis of lifetime cancer risk — Newark
Bay Complex data.
4542 K.K. Pflugh et al. / Science of the Total Environment 409 (2011) 4536–4544
8. incorporating the distributional data for P and F are presented as
histograms in Fig. 4 and as continuous probability distributions in
Fig. 5. Selected percentiles of the distribution of risk for both the full
NBC data and the Arthur Kill subset are presented in Table 9.
Comparing the RME version of the point estimate risk assessment to
the Monte Carlo probabilistic assessment, the RME risk estimate for
the NBC corresponds to the 97th percentile of the distribution of risks
predicted by the Monte Carlo analysis.
4. Discussion
Based on the consumption rates reported by crabbers in the field
and temporally consistent data on 2,3,7,8-TCDD TEQs from crabs
inhabiting the same waters fished by the survey respondents, we
estimate the lifetime cancer risk from consumption of 2,3,7,8-TCDD
TEQs from crabs in the NBC to be in the range of 2×10⁻³
to 3×10⁻²
.
We investigated and compared categorical point estimates of
exposure and continuous probabilistic estimates of exposure. These
approaches are consistent in their estimate of risk. These risks are
considerably beyond the range of risk generally considered to be
acceptable for risks from environmental contamination. We also note
that 2,3,7,8-TCDD and related compounds pose a risk of non-cancer
effects including developmental delays, and impacts on immune
function in the range of average background exposure levels in the
population (USEPA, 2003). These effects would likely result in a
Reference Dose significantly below current levels of exposure (USEPA,
2010). Thus, the levels of exposure in the NBC documented here raise
public health concerns for non-cancer effects as well as for cancer risk.
The crabbers in the NBC are the primary consumers of the crabs
they catch. Crabbing and crab consumption are frequent events for
this population. Thus, little extrapolation is involved in applying the
2,3,7,8-TCDD TEQ exposure data to risk estimates in this same
population. Furthermore, the focused and ongoing nature of obtaining
the crabs for personal consumption minimizes the uncertainty often
inherent in food recall surveys. Nonetheless, some uncertainties in the
analysis should be noted. The total number of completed surveys for
2002/2005, 37, was relatively small. While this reduces the precision
in our estimates, these data were sufficient to show an overall high
and consistent level of consumption. Furthermore, the consistency of
the consumption and demographics in the 2002/2005 data with those
from the 1995 data, with a total of 124 respondents, points to the
precision and consistency of the 2002/2005 data. An additional
uncertainty arose from the categorical and open-ended nature of the
question regarding the number of crabs consumed per meal in the
2005 survey. While this additionally reduces the precision in our
estimate, particularly with respect to the upper category for this
variable, we believe that our use of the mid-[pomt of the correspond-
ing high-end category for this variable from the 2002 survey data
provides a reasonable estimate for this parameter in the 2005 survey.
Most of the crabs were collected from the Arthur Kill portion of the
NBC, while most of the 2002/2005 surveys were conducted in this
area, some of the surveys were conducted in other parts of the NBC.
Blue crabs are a locally migratory species and all areas of the NBC are
hydraulically connected and accessible to the crabs. Therefore, it is
likely that a crab sampled in one location of the NBC would otherwise
have been available to crabbers in other portions of the NBC.
Nonetheless, to investigate the potential uncertainty arising from
the partial spatial offset of surveys and crab samples, we conducted a
sensitivity analysis using survey data only from the Arthur Kill portion
of the NBC. This structure of this analysis was identical to the primary
analysis, but differed by having data from a reduced number of
surveys (n=30). The RME risk estimated from this analysis differed
only slightly from that estimated for the full NBC (2×10⁻²
versus
3×10⁻²
respectively) (Table 8). Similarly, for the probabilistic, Monte
Carlo approach, considering the 90th percentile estimate, the risk for
the full NBC data was 2×10⁻²
compared to 1×10⁻²
for the reduced,
Arthur Kill data set. (Table 9) It is clear that the risks are consistently
elevated throughout the NBC and that discounting the migration of
crabs throughout the NBC has little effect on the risk.
The 1995 survey data did not solicit information on the length of
the crabbing season and since the duration of the crabbing season
differed among individuals, we could not integrate the 1995 data with
the 2002/2005 data. Nonetheless, we estimated the mean risk for the
full NBC from the 1995 data by combining the mean value for the
fraction of the year during which crabbing occurred from the
2002/2005 data with the mean values for the other exposure variables
from the 1995 data. This gave a value for the mean risk of 1.4×10⁻²
from the 1995 survey data. This is quite comparable to the range of
risks calculated from the 2002/2005 data. Thus, the similarity
between the mean risk we calculated from the 2002/2005 data and
the risk we estimated from the much larger 1995 dataset provides
reassurance as to the validity of the 2002/2005 estimates.
The limited survey data on hepatopancreas removal prior to
cooking as well as the survey data showing that boiling is
overwhelmingly the most popular crab cooking method among the
NBC crabbers makes it likely that few of the crabbers actively remove
the hepatopancreas before cooking. Zabik et al. (1992) estimated that
86% of the hepatopancreas mass in lost in boiling. For the PCBs
addressed by Zabik et al., it appears that most of the PCBs contained in
the hepatopancreas were recovered in the muscle and the cooking
liquid. Thus, removal of the hepatopancreas after boiling will not
likely be very effective in reducing exposure to the TCDD-like
chemicals contained in the hepatopancreas, particularly for those
who consume the cooking liquid as well as the muscle tissue. Our risk
estimates based on the TCDD-TEQ concentration in the raw crab tissue
correspond approximately to consumption of all the edible the crab
tissue and the cooking liquid. Nonetheless, for purposes of compar-
ison, we also calculated the point estimate lifetime cancer risk for the
full NBC crab data based on the TCDD TEQ concentrations in the
muscle only. For the same lower, mid-range and upper percentile
estimates used in the analysis of the consumption of muscle plus
hepatopancreas (Table 8), the muscle-only analysis gave risks of
0.0
0.1
0.2
0.3
0.4
0.5
0.6
0.7
0.8
0.9
1.0
2.00E-03 9.00E-03 1.60E-02 2.30E-02 2.90E-02
Lifetime Cancer Risk
CumulativeProbability
Fig. 5. Cumulative probability distribution of Monte Carlo probabilistic analysis of
lifetime cancer risk — Newark Bay Complex Table 1. Survey questions relevant to the
assessment of risk from consuming Newark Bay Complex Crabs.
Table 9
Results of the Monte Carlo analysis of cancer risk.
Risk
Location Mean 50th
percentile
75th
percentile
90th
percentile
95th
percentile
Newark Bay Complex 7.7×10⁻³
5.1×10⁻³
9.9×10⁻³
1.7×10⁻²
2.3×10⁻²
Arthur Kill 5.6×10⁻³
2.9×10⁻³
6.4×10⁻³
1.2×10⁻²
1.9×10⁻²
4543K.K. Pflugh et al. / Science of the Total Environment 409 (2011) 4536–4544
9. 1.4×10⁻⁴
, 5.8×10⁻⁴
and 2.3×10⁻³
respectively, or about one order
of magnitude less than the risk estimates for muscle plus hepatopan-
creas. These values still exceed generally acceptable levels of risk.
These crabbers have been consuming crabs from the NBC for a
substantial portion of their lives. Despite an official ban on crabbing in
these waters, and despite signage publicizing the ban and the risks of
consuming the crabs, these consumers show little indication of
ceasing their activity. It is therefore, not unreasonable to assume that
unless the 2,3,7,8-TCDD TEQ concentration is significantly reduced in
these crabs, this level of risk will continue indefinitely for these
consumers. Additionally, increased risk from consumption of Newark
Bay crabs extends beyond the crabbers, themselves. The surveys from
1995 and 2002 asked the crabbers whether they share the crabs with
people outside their households. Crabs were shared with others by
63% of the crabbers responding.
Crabbing has continued in the Newark Bay Complex despite bans
issued by the State of New Jersey, despite enforcement of those bans
and despite communications outreach efforts designed to inform
crabbers of the health risk in consuming Newark Bay crabs. The
limited access to crabbing locations in the Complex has also not
deterred those who continue to crab. Our analysis indicates that at
current levels of contamination of crabs by TCDD and related
compounds, the self-selected consumption patterns of Newark Bay
Complex crabbers result in an excessive and unacceptable level of risk.
Nonetheless, the continuing and frequent consumption of these crabs
despite the impediments and risks reflects the enduring nature of this
resource. If the levels of contaminants in the Newark Bay Complex
were reduced to acceptable levels consistent with the natural
consumption patterns of crabbers, crabbing could become a signifi-
cant and encouraged recreational and nutritional resource in the
Complex.
Acknowledgments
The authors would like to thank the staff from the NJDEP Division
of Watershed Management, especially Harold Nebling and Beth
Torpey, as well as the Hackensack Riverkeeper, Raritan Riverkeeper
and Future City, Inc. for conducting the surveys; and appreciate Terri
Tucker's assistance with the graphics.
References
Belton TJ, Ruppel BE, Lockwood K. PCB's (Aroclor 1254) in fish tissues throughout the
State of New Jersey: a comprehensive survey. Trenton, New Jersey: NJ Department
of Environmental Protection, Office of Cancer and Toxic Substance Research; 1982.
Belton TJ, Ruppel BE, Lockwood K, Boried M. PCBs in selected finfish caught within New
Jersey waters 1981–1982 (with limited chlordane data). Trenton, New Jersey: New
Jersey Department of Environmental Protection, Office of Science and Research;
1983.
Belton TJ, Hazen R, Ruppel BE, Lockwood K, Mueller R, Stevenson E, et al. A study of dioxin
(2,3,7,8-Tetrachlorodibenzo-p-Dioxin) contamination in select finfish, crustaceans
and sediments in New Jersey waterways. Trenton, New Jersey: NJ Department of
Environmental Protection, Office of Science and Research; 1985. 102 pp. Available
from: http://www.state.nj.us/dep/dsr/dioxin/Study%20of%20Dioxin.pdf.
Bopp RF, Gross ML, Tong H, Simpson HJ, Monson HJ, Deck BL, et al. A major incident of dioxin
contamination: sediments of New Jersey Estuaries. Environ Sci Technol 1991;25:951–6.
Buchanan GA, Belton T, Ruppel B. Final workplan, routine fish monitoring program for
toxics in fish: estuarine and marine waters. Trenton, New Jersey: Division of Science
Research & Technology, New Jersey Department of Environmental Protection; 2004.
Available from: www.state.nj.us/dep/dsr/Final%20Workplan%2004.pdf.
Burger J, Pflugh KK, Lurig L, Von Hagen LA, Von Hagen S. Fishing in urban New Jersey:
ethnicity affects information sources, perception and compliance. Risk Anal
1999;19:217–9.
Chen JW, Wang SL, Yu HY, Liao PC, Lee CC. Body burden of dioxins and dioxin-like
polychlorinated biphenyls in pregnant women residing in a contaminated area.
Chemosphere 2006;65:1667–77.
Cristini A, Gross M. Dioxins in tissues from crabs from the Raritan/Newark Bay Systems.
Trenton, New Jersey: NJ Department of Environmental Protection, Division of
Science and Research; 1993. Available from: http://www.state.nj.us/dep/dsr/
publications/pub.htm.
Dean KE. Bioaccumulation of polychlorinated dibenzodioxins and dibenzofurans in
catfish and crabs along an estuarine salinity and contamination gradient. Environ
Tox Chem 2009;28:2307–17.
Domingo JL, Bocio A. Levels of PCDD/PCDFs and PCBs in edible marine species and
human intake: a literature review. Environ Int 2007;33:397–405.
Hauge P. Polychlorinated Biphenyls (PCBs), Chlordane and DDTs in Selected Fish and
Shellfish from New Jersey Waters, 1988–1991: Results from New Jersey's Toxics in
Biota Monitoring Program. Trenton, New Jersey: NJ Department of Environmental
Protection, Division of Science and Research; 1993. 95 pp. Available from: http://
www.state.nj.us/dep/dsr/pcb88-91.pdf.
Hetling LJ, Horn LE, Tofflemire TJ. Summary of Hudson River PCB Study Results. Tech.
Report 51, Bur. Albany, NY: Water Research, New York State Department of
Environmental Conservation; 1978 (88 pp.).
Horwitz RJ, Overbeck PF, Ashley J, Velinsky D, Zaoudeh L. Final Report: Routine
Monitoring Program for Toxics in Fish. Contract SR02-064. ANS Report No. 04–06;
2005 (April 12 2005 175 pp.).
Horwitz RJ, Ashley J, Overbeck P, Velinsky D. Final Report: 2004 Monitoring Program for
Chemical Contaminants in Fish from the State of New Jersey. Contract SR04-073.
(ANS Report No. 06-04F)Philadelphia, PA: Academy of Natural Sciences; 2006
(77 pp.).
May H, Burger J. Fishing in a polluted estuary: fishing behavior, fish consumption, and
potential risk. Risk Anal 1996;16:459–71.
Pflugh KK, Lurig L, Von Hagen LA, Von Hagen S, Burger J. Urban anglers' perception of
risk from contaminated fish. Sci Total Environ 1999;228:203–18.
Skinner LC, Jackling SJ, Kimber G, Waldman J, Shastay J Jr., Newell AJ. Chemical residues
in fish, bivalves, crustaceans and a cephalopod from the New York–New Jersey
Harbor estuary. New York State Department of Environmental Conservation; 1997
(86 pp.).
Tong HY, Monson SJ, Gross ML, Bopp RF, Simpson SJ, Deck BL, et al. Analysis of dated
sediment samples from the Newark Bay area for selected PCDDs/Fs. Chemosphere
1990;20:1497–502.
USEPA. Exposure and Human Health Reassessment of 2,3,7,8-Tetrachlorodibenzo-p-
Dioxin (TCDD) and Related Compounds. EPA/600/P-00/001Cb. National Academy
Sciences (NAS) Review Draft; 2003. Accessed September 8, 2009. Available at:
http://www.epa.gov/ncea/pdfs/dioxin/nas-review/.
USEPA. EPA's Reanalysis of Key Issues Related to Dioxin Toxicity and Response to NAS
Comments. External Review Draft. EPA/600/R-10/038A; 2010. Available at: Available
at: http://cfpub.epa.gov/ncea/cfm/recordisplay.cfm?deid=222203#Download.
USEPA. Diamond Alkali, Superfund Fact Sheet, USEPA Region 2. Accessed November 17,
2009. Available at: http://www.epa.gov/region02/superfund/npl/diamondalkali/.
Van den Berg M, Birnbaum L, Bosveld AT, Brunström B, Cook P, Feeley M, et al. Toxic
equivalency factors (TEFs) for PCBs, PCDDs, PCDFs for humans and wildlife. Environ
Health Perspect 1998;106:775–92.
Van den Berg M, Birnbaum LS, Denison M, De Vito M, Farland W, Feeley M, et al. The
2005 World Health Organization reevaluation of human and mammalian toxic
equivalency factors for dioxins and dioxin-like compounds. Toxicol Sci 2006;93:
223–41.
White S, Birnbaum L. An overview of the effects of dioxins and dioxin-like compounds
on vertebrates, as documented in human and ecological epidemiology. J Environ Sci
Health C Environ Carcinog Ecotoxicol Rev 2009;27(4):197–211.
WHO (World Health Organization). van Leeuwen, FXR. Derivation of toxic equivalency
factors (TEFs) for dioxin-like compounds in humans and wildlife. Organohalogen
Compd 1997;34:237.
Yunker MB, Cretney WJ, Ikonomou MG. Assessment of chlorinated dibenzo-p-dioxin
and dibenzofuran trends in sediment and crab hepatopancreas from pulp mill and
harbor sites using multivariate- and index-based approaches. Environ Sci &
Technol 2002;36:1869–78.
Zabik ME, Harte JB, Zabik MJ, Dickmann G. Effect of preparation and cooking on
contaminant distributions in crustaceans: PCBs in blue crab. J Agric Food Chem
1992:1197–203.
4544 K.K. Pflugh et al. / Science of the Total Environment 409 (2011) 4536–4544