

Recomendados
Recomendados
Mais conteúdo relacionado
Mais procurados
Mais procurados (20)
Destaque
Semelhante a Fame Value Security Analysis Competition- EDU
Semelhante a Fame Value Security Analysis Competition- EDU (20)
Mais de Leon Liang
Mais de Leon Liang (20)
Fame Value Security Analysis Competition- EDU
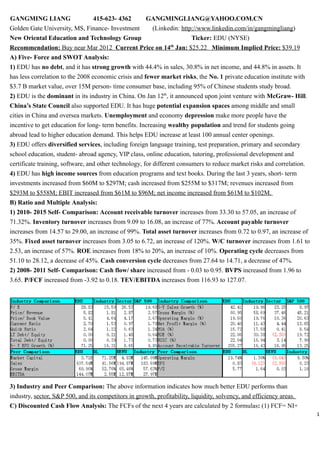
- 1. GANGMING LIANG 415-623- 4362 GANGMINGLIANG@YAHOO.COM.CN Golden Gate University, MS, Finance- Investment (Linkedin: http://www.linkedin.com/in/gangmingliang) New Oriental Education and Technology Group Ticker: EDU (NYSE) th Recommendation: Buy near Mar 2012 Current Price on 14 Jan: $25.22 Minimum Implied Price: $39.19 A) Five- Force and SWOT Analysis: 1) EDU has no debt, and it has strong growth with 44.4% in sales, 30.8% in net income, and 44.8% in assets. It has less correlation to the 2008 economic crisis and fewer market risks, the No. 1 private education institute with $3.7 B market value, over 15M person- time consumer base, including 95% of Chinese students study broad. 2) EDU is the dominant in its industry in China. On Jan 12th, it announced upon joint venture with McGraw- Hill. China’s State Council also supported EDU. It has huge potential expansion spaces among middle and small cities in China and oversea markets. Unemployment and economy depression make more people have the incentive to get education for long- term benefits. Increasing wealthy population and trend for students going abroad lead to higher education demand. This helps EDU increase at least 100 annual center openings. 3) EDU offers diversified services, including foreign language training, test preparation, primary and secondary school education, student- abroad agency, VIP class, online education, tutoring, professional development and certificate training, software, and other technology, for different consumers to reduce market risks and correlation. 4) EDU has high income sources from education programs and text books. During the last 3 years, short- term investments increased from $60M to $297M; cash increased from $255M to $317M; revenues increased from $293M to $558M; EBIT increased from $61M to $96M; net income increased from $61M to $102M. B) Ratio and Multiple Analysis: 1) 2010- 2015 Self- Comparison: Account receivable turnover increases from 33.30 to 57.05, an increase of 71.32%. Inventory turnover increases from 9.09 to 16.08, an increase of 77%. Account payable turnover increases from 14.57 to 29.00, an increase of 99%. Total asset turnover increases from 0.72 to 0.97, an increase of 35%. Fixed asset turnover increases from 3.05 to 6.72, an increase of 120%. W/C turnover increases from 1.61 to 2.53, an increase of 57%. ROE increases from 18% to 20%, an increase of 10%. Operating cycle decreases from 51.10 to 28.12, a decrease of 45%. Cash conversion cycle decreases from 27.64 to 14.71, a decrease of 47%. 2) 2008- 2011 Self- Comparison: Cash flow/ share increased from - 0.03 to 0.95. BVPS increased from 1.96 to 3.65. P/FCF increased from -3.92 to 0.18. TEV/EBITDA increases from 116.93 to 127.07. 3) Industry and Peer Comparison: The above information indicates how much better EDU performs than industry, sector, S&P 500, and its competitors in growth, profitability, liquidity, solvency, and efficiency areas. C) Discounted Cash Flow Analysis: The FCFs of the next 4 years are calculated by 2 formulas: (1) FCF= NI+ 1
- 2. D&A- change in W/C- maint. capex; (2) FCF= NOPAT- investment in operating capital. The terminal value is calculated with 8.84% WACC and 8.00% estimated growth rate. Discount rate is 8.84%. The intrinsic value (1) is $39.19, $13.97 higher than the current price; the intrinsic value (2) is $82.23, $57.01 higher than the current price. D) Residual Income Analysis: Residual income is calculated by deducting expected income (BV* WACC) from net income, and terminal value is calculated with the previous method. By discounting accumulate cash flows of the next 4 years, the intrinsic value is $129.7, $104.48 higher than the current price. E) Benjamin Graham Analysis: By inputting $0.66 EPS, 4.4% average high- grade corporate bond rate, 8.5 non- growth P/E base, 45.50% 5- year EPS growth rate, 4.45% 20- year AAA corporate bond rate, and 2 times of EPS growth rate as adjusted growth rate, the intrinsic value= EPS* (P/ E base + 2* EPS growth rate)* average Rd / 20- year Rd= $64.93, $39.71 higher than current price. By adjusting non- growth P/ E base into 7.0 and times of EPS growth rate into 1.5 for reflecting the current market more accurately, the intrinsic value is $49.11, $23.89 higher than the current price. F) Technical Analysis: The current price is $1.85 lower than the 50- day moving average; RSI and MACD indicate negative confirmation to price trend and annual bottom; MACD lines are going to cross as a signal for the next cyclical breakout; volume becomes exhausted and drops to annual low. According to the history trend from StockCharts.com, if MACD, RSI, volume, and stock trend all break out (red lines) near next few months, a new cycle happens. Annual cycles were caused by new student enrollments and geographic expansion after every New Year vacation. So, the breakout might happen in later spring, near March, of 2012. According to vertical count base, the value increased after previous annual breakouts are about $11.5. So, the target price might be $33.5 ($22 lowest price in one year cycle+ $11.5 estimated increase value). G) According to horizontal count base of Point and Figure Chart Analysis, the minimum target price is $33.5 (3* 9 width base of the latest bottom* $1 per box/ 2+ $20 minimum price in one year cycle) , which is the same as the resistance level of 2011 and the predicted target price in technical analysis session. H) Strategy: 1% shares are held by insiders and majority shares are held by institutional and mutual fund owners. It may be a better choice for taking the opposite side of IB analysts’ recommendations in the short- run because they have relationships with mutual fund operators. EDU is expected to have the first cyclical breakout near March because of repurchase, new enrollment, and expansion. Its long- term fundamental value is $39.19- $129.7, which indicates the price is undervalued. Its short- term technical target price is $33.5. I recommend buying it near March.