Nepse Technical Analysis July 12 - July 16, 2015
•
0 gostou•201 visualizações

- Nepse index gained 17.8 points (1.88%) last week to close at 961.23, supported by an increase in on-balance volume indicating continued investor optimism. - Moving averages and MACD signals suggest the market is in a bullish momentum phase. - Immediate support and resistance levels are at 950.97 and 972.17 respectively. - The market is approaching an overbought state as reflected in RSI and upper Bollinger band readings nearing thresholds.

Recomendados
Recomendados
Mais conteúdo relacionado
Mais procurados
Mais procurados (20)
Destaque
Destaque (20)
Semelhante a Nepse Technical Analysis July 12 - July 16, 2015
Semelhante a Nepse Technical Analysis July 12 - July 16, 2015 (18)
Mais de Kriti Capital & Investments Ltd.
Mais de Kriti Capital & Investments Ltd. (20)
Último
Último (20)
Nepse Technical Analysis July 12 - July 16, 2015
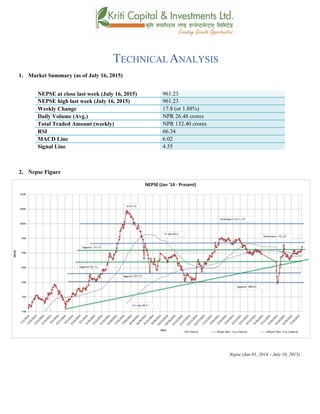
- 1. TECHNICALANALYSIS 1. Market Summary (as of July 16, 2015) NEPSE at close last week (July 16, 2015) 961.23 NEPSE high last week (July 16, 2015) 961.23 Weekly Change 17.8 (or 1.88%) Daily Volume (Avg.) NPR 26.48 crores Total Traded Amount (weekly) NPR 132.40 crores RSI 66.34 MACD Line 6.02 Signal Line 4.55 2. Nepse Figure Nepse (Jan 01, 2014 – July 16, 2015)
- 2. 3. Trend Analysis Nepse at the beginning of last week closed at 944.99. The benchmark index went up for majority of last week, except for Monday, where it fell by a meager 0.99 points. The market gained confidence during the last few days of the trading week as the finance minister had declared a staggering Rs 819.47 budget plan for the next fiscal year. 4. Resistance and Support Immediate Support 950.97 Support 2 913.02 Immediate Resistance 972.17 Resistance 2 1036.98 The lowest Nepse went down to last week was at 944. By the end of the week, the index surpassed its immediate resistance level of 950.97, to end at 961.23. The announcement of the new big budget plan for the next fiscal year must have triggered optimism among the investors. The previous resistance level has now become an immediate support level of the benchmark index. The current immediate support and resistance level stands at 950.97 and 972.17 respectively. 5. Trend Indicator a.) MACD The MACD is a momentum oscillator formed by using two different types of moving averages, which provides specific buying or selling signals. When a MACD line crosses above the signal line, it is considered to be a positive sign and indicates a time to buy, and vice-versa. The Macd line increased gradually throughout last week. The signal line has been moving upward at a much higher rate as compared to the macd line. The distance between the macd and signal line closed in most the week. However, the gap increased towards the end of the week with macd line still moving above the signal line. The macd and the signal line ended at 6.02 and 4.55 respectively, indicating a bullish momentum at the market. b.) RSI RSI is a form of leading indicator that is believed to be most effective during periods of sideways movement. Such indicators may create numerous buy and sell signals that are useful when the market is not clearly trending upwards or downwards.
- 3. The RSI was at 57.03 level at the beginning of last week. It has been moving up in a steady manner, and hovering around the mid 50s and early 60 levels for the past few weeks. The RSI last week ended at 66.34 level. Moving further upward towards the 70 level would signify an over-bought condition at the market. c.) Bollinger Bands The Bollinger Band is a technical indicator that consists of a moving average (21-day) along with two trading bands above (upper band) and below it (lower band). The bands are an indication of volatility, which are represented by calculating standard deviation. The benchmark index touched the upper Bollinger band last week. This signifies an over-bought condition at the market. The mid-band is still acting as a support level to the index. The distance between the upper and the lower band is still fairly close, indicating a less volatile market. 6. Volume Indicator (On-Balance Volume) On-Balance Volume (OBV) is a momentum indicator that relates volume to the current price of the index or security. It measures buying and selling pressure at the market. It acts as a cumulative indicator that adds volume on up days and subtracts volume on down days. If a price increase is supported by OBV, it confirms an uptrend, whereas if a price decrease is supported by OBV, it confirms a downtrend.
- 4. In the current context, the On-Balance Volume (OBV), once again, increased more than the growth experienced by the Nepse index. This again shows that investors have a bullish attitude towards the market. The average weekly volume transactions increased slightly to NPR 26.48 crores from NPR 25.71 crores the week prior. The maximum total volume transaction last week was NPR 342,787,584. 7. Overview The Nepse index made a staggering gain of 17.8 points (or up 1.88%) last week to close at 961.23. As expected, the 50-day moving average (MA) and 200-day MA are coming close to crossing each other. This indicates a positive outlook of the market as the 50-day MA will move above the 200-day MA. The average weekly volume transactions increased slightly to NPR 26.48 crores from NPR 25.71 crores the week prior. The increase in the index is also supported by the OBV, indicating a bullish trigger. The RSI is getting closer towards the 70 level, could be a sign of an over-bought condition. The macd is moving above the signal line triggering a bullish momentum. The Bollinger bands also show a sign of over-bought condition as the index is touching the upper band. The new support and resistance level stands at 950.97 and 972.17 respectively.
- 5. k|fljlwsljZn]if0f !_ahf/ ;f/f+z -cfiff9 #!, @)&@ ;Ddsf]_ aGb cªs -cfiff9#!, @)&@_ (^!=@# pRr cªs -uPsf] ;ftf_ (^!=@# ;fKtflxs kl/jt{g !&=* -!=**k|ltzt_ b}lgscf};t Jofkf/ ¿=@^=$* s/f]8 s'n ;fKtflxsJofkf/ ¿ !#@=$) s/f]8 cf/P;cfO{ ^^=#$ PdP;L8L ^=)@ l;UgnnfO{g $=%% @_ ahf/ k|j[lt Nepse (Jan 01, 2014 – July16, 2015)
- 6. #_ 6]«G8 ljZn]if0f uPsf] ;ftfsf] cl3Nnf] ;ftf g]K;] kl/;"rs ($$=(( cªsdfaGbePsf] lyof] . uPsf] ;ftfsf/f]af/ lbgsf] w]/}h;f] lbgx? kl/;"rsdfly g} a9of] . jt{dfg ;/sf/af6 ah]6sf] 3f]if0f u/] cg'?ko;n] ahf/dfnufgLstf{x? dfempT;fxsf] jftfj/0f /xof] / ;fy} rfn' cfly{s jif{sf] ;dfKtL ;+u} o;n] ahf/dfnufgLstf{x?nfO{ pT;fxLagfPsf] 5 . $_ 6]jftyfk|lt/f]w cªs glhssf] 6]jfcªs (%)=(& 6]jfcªs @ (!#=)@ glhssf] k|lt/f]w cªs (&@=!& k|lt/f]w cªs @ !)#^=(* uPsf] ;ftf g]K;] kl/;"rs ;a}eGbftn ($$ cªs ;Ddk'u]sf] lyof] . uPsf] ;ftf kl/;"rsn] cfkmgf] glhssf] 6]jfcªs (%)=(&nfO{ kf/ u/L (^!=@# k'Uguof] . ah]6sf] 3f]if0f tyfcfly{s jif{sf] ;dfKtL ;Fu} nufgLstf{x? dfempT;fxsf] jftfj/0f b]lvPsf] 5 . klxn]sf] k|lt/f]w cªsxfnsf] nfluglhssf] 6]jfcªsx'gk'u]sf] 5 . xfnsf] nflu 6]jfcªstyfk|lt/f]w cªs (%)=(&tyf (&@=!& /xguPsf] 5 . %_ g]K;] 6]«G8 ;"rs s_ d'leª Pe/]hsGeh]{G; 8fOeh]{G; -PdP;L8L_ PdP;L8Ldf b'O{ cf]6f /]vf x'G5g, h;df Pp6fn] ahf/sf] lbzf kl/jt{gsf] ;+s]t u5{ eg] csf]{n] ahf/sf] k|j[lQ -6«]08_ b]vfpg] u5{ . olb PdP;L8L /]vfn] l;Ung /]vfnfO{ tnaf6 dfly sf6]dfo;nfO{ ;sf/fTds ;+s]tsf ?kdflnO{G5 / o;n] z]o/x? lsGg] ;+s]t ub{5 . PdP;L8LnfO{gdflyclSng] s|dhf/L /xof] . l;UgnnfO{g PdP;L8L nfO{g eGbfw]/} rfF8f] b/dfdfly a9g] s|dhf/L /x]sf] 5 . PdP;L8L nfO{g tyfl;UgnnfO{g aLrsf] b'?Ldf ;d]tuPsf] ;ftfsdLcfPsf] cj:yf /xof] t/ ;ftfsf] cGTodf PdP;L8L nfO{g tyfl;UgnnfO{gaLrsf] b'/L s]xL a9L PdP;L8L nfO{g dfly r9]sf] cj:yf /xof] . ;ftfsf] cGTolt/ PdP;L8L nfO{g tyfl;UgnnfO{g s|dz M ^=)@ tyf $=%% cªssf] l:yltdf /xguof]h;n] xfnahf/dfa'lnz 6]«G8sf] ;+s]t ub{5 .
- 7. v_ l/n]l6j :6«]Gy OG8]S; -cf/P;cfO{_ cf/P;cfO{ k|fljlwsljZn]if0fsf] o:tf] cf}hf/ xf], h;nfO{ Pstlkm{ ?kdfrln/x]sf] ahf/dfJofkf/ /0fgLlt agfpg a9L pkof]uL dflgG5 . To;}u/L, o;n] ahf/dfvl/b / ljlqmsf] :ki6 ;+s]t b]vfpg] u5{ . cf/P;cfO{ ;ftfsf] z'?df %&=)#cªsdf /x]sf] lyof] . ;ftfsf] w]/} h;f] lbgcf/P:cfO{ dfly g} a9of] . uPsf] s]xL ;ftfx?dfcf/P;cfO{ %) cªstyf ^) cªssf] xf/fxf/Ldf /x]sf] x'Fbfxfnsf] nfluahf/ Go"6«ncj:yfdf g} /x]sf] ;+s]t ub{5 / cem} of] eGbfdflyhfg] xf] eg] ahf/ cf]e/–a6sf] l:yltdf k'Ug ;Sg] ;+Defjgf /x]sf] 5 . u_ af]lnªu/ Aof08 af]lnªu/ Aof08 Ps k|fljlwsljZn]if0f ;"rsxf] h;df @!–lbg] d'leËPe/]hsf ;fyb'O{ Aof08 -Pp6f dfly_ / Pp6f tn_ x'G5g . lo Aof08x?n] cl:y/tfsf] ;+s]t ub{5g, h'g :6fG88{ 8]leP;g u0fgf u/]/ kQfnufO{G5 . g]K;] kl/;"rsn]dflyNnf] af]lnªu/ Aof08 5f]Psf] cj:yf /xof] h;n] ahf/dfcf]e/a6 cj:yfsf] ;+s]t ub{5 . dWo Jof08n] xfnsf] nflu ;d]t 6]jfcªssf] sfdul//x]sf] 5 . pkNnf] tyftNnf] Jof08 aLrsf] b'/LdfcfPsf] sdLn] ahf/dfcl:y/tfdfsdLcfPsf] ;+s]t ub{5 .
- 8. ^_ eNo'd ;'rs -cg–Aofn]G; eNo'd_ cg–Aofn]G; eNo'd n] ahf/dflsGg] tyf a]Rg] k|];/sf] ;+s]t ub{5 . ;d|udf of] ;"rsn] ahf/ dflyuPsf] cj:yftyftnem/]sf] cj:yfdfahf/dfsf/f]af/sf] eNo'd s:tf] /xof] ;+s]t ub{5 .
- 9. uPsf] ;ftfcg– Aofn]G; eNo'ddf g]K;] kl/;"rseGbf /fd|f] ;'wf/ b]lvof] . h;n] ahf/dfnufgLstf{x? dfemahf/ k|ltsf] b[li6sf]0f ;sf/fTds ?kdfa'ln; /x]sf] ;+s]t ub{5 . ;ftfsf] cf};t sf/f]af/ /sddf;d]t ;'wf/ b]lvof] hf] uPsf] ;ftf ?= @%=&! s/f]8lyof] eg] of] ;ftf ?= @^=$* s/f]8df /xguof] . uPsf] ;ftfdf ;a}eGbf w]/} sf/f]af/ /sd ?= #$@,&*&,%*$÷– /x]sf] lyof] . ;du{dfM uPsf] ;ftf g]K;] kl/;"rsdfnueu !&=* cªs -!=**Ü_ sf] a[l4 /xof] h;sf] kmn:j?kahf/ (^!=@# cªsdfaGbx'guof] . ;f]r] cg'?k%)–lbg] d'leËPe/]htyf@))–lbg] d'leËPe/]hnfO{gn] Ps csf{nfO{ sf6g ;Sg] ;+s]t b]lvPsf] 5 . %)–lbg] d'leËPe/]hnfO{gn]@))–lbg] d'leËnfO{gnfO{ sf6L cfPdfo;n] ahf/df /fd|f] cj:yfsf] ;+s]t ub{5 .cf};t sf/f]af/ /sddf ;d]t ;'wf/ b]lvof] hf] uPsf] ;ftf ?= @^=$* s/f]8 /xguof] / ;f] /sd cl3Nnf] ;ftfeg] ?= @%=&! s/f]8 /x]sf] lyof] . g]K;] kl/;"rssf] a[l4nfO{ cg–Aofn]G; eNo'd ;r"sn] ;d]t ;+s]t ub{5 h;n] ahf/ a'lnz 6«]G8 lt/ uO{/x]sf] ;+s]t ub{5 . &) sf] n]endfk'ug ;Sg] ;+Defjgf /x]sf] cf/P;cfO{n] cf]e/ a6 cj:yfsf] ;+s]t ub{5 . z"GonfO{g eGbfdfly r9]sf] PdP;L8LnfO{gn] ahf/dfa'ln; 6«]G8 /x]sf] ;+s]t ub{5 .pkNnf] af]lnªu/ Jof08 5f]Psf] g]K;] kl/;"rsn] ahf/ cf]e/ a6sf] l:yltdf uPsf] ;+s]t ub{5 . xfnsf] nflugofF 6]jfcªstyfk|lt/f]w cªs (%)=(&tyf (&@=!& /x]sf] 5 .