Global ABS
•
0 gostou•334 visualizações

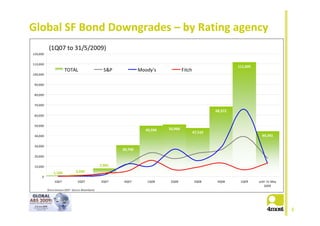
These two slides give an overview of the the total global Structured finance bond downgrades since January 2007. Furthermore, they show the split between US and Europe. Slides have been shown at the Global ABS Investors\' & Regulators\' roundtable, 2/3 June 2009. Underlying data has been compiled from Bloomberg\'s <RATT> function.

Recomendados
Mais conteúdo relacionado
Semelhante a Global ABS
Semelhante a Global ABS (20)
Mais de Markus Krebsz
Mais de Markus Krebsz (20)
Global ABS
- 1. Global SF Bond Downgrades – by Rating agency (1Q07 to 31/5/2009) 120,000 110,000 111,605 TOTAL S&P Moody's Fitch 100,000 90,000 80,000 70,000 68,372 60,000 50,000 49,594 50,968 47,510 40,000 44,341 30,000 30,749 20,000 10,000 7,992 1,166 2,042 0 1Q07 2Q07 3Q07 4Q07 1Q08 2Q08 3Q08 4Q08 1Q09 until 31 May 2009 (Since January 2007 ‐ Source: Bloomberg) 1
- 2. SF Bond Downgrades – US vs. Europe (1Q07 to 31/5/2009) 120,000 110,000 111,239 TOTAL Europe US 100,000 90,000 80,000 70,000 68,073 60,000 50,000 49,160 50,676 47,284 40,000 44,051 30,000 30,597 20,000 10,000 7,981 1,161 2,035 0 1Q07 2Q07 3Q07 4Q07 1Q08 2Q08 3Q08 4Q08 1Q09 until 31 May 2009 (Since January 2007 ‐ Source: Bloomberg) 2