The Global Energy Challenge: Researching Solutions

The document discusses the global energy challenge and outlines strategies to address rising energy demand and climate change. It notes that total global energy demand is projected to increase 70% by 2030 due to growth in developing countries like India and China. Current fossil fuel reserves will be depleted in the coming decades, and unconventional sources like tar sands require more energy and are more polluting to develop. The document proposes developing a comprehensive 10-year plan through the Global Climate and Energy Project to fund research on low greenhouse gas emission energy sources that could make a significant impact on emissions within 10-50 years. This includes investigating potential breakthroughs in solar, wind, biofuels, efficient combustion and carbon capture that could help curb emissions while meeting rising

Recomendados
Mais conteúdo relacionado
Semelhante a The Global Energy Challenge: Researching Solutions
Semelhante a The Global Energy Challenge: Researching Solutions (20)
Mais de Tuong Do
Mais de Tuong Do (20)
Último
Último (20)
The Global Energy Challenge: Researching Solutions
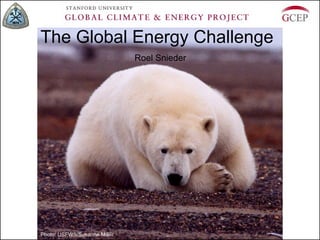
- 1. The Global Energy Challenge Roel Snieder Photo: USFWS/Susanne Miller
- 2. The Global Climate and Energy Project Mission • Research on low-GHG emission energy conversions • Focus on fundamental and pre-commercial research • Applications in the 10-50 years timeframe Strategy • Research projects with potential for significant impact on GHG emissions • Look for potential breakthroughs for new conversion options • High risk / high reward • Work at Stanford and at other institutions around the world Schedule and Budget • 10 years (2003 – 2013+) Stanford • $225 M Participating outside institutions Pending outside institutions
- 3. Total global energy demand 70% increase (International Energy Outlook 2006)
- 5. … and our energy use
- 8. Energy use by type (International Energy Outlook 2006)
- 9. Peak oil N.B. based on USGS estimates, these are among the most optimistic (Energy Information administration)
- 11. Declining production (1) Production resource depleted p ly s up Time
- 12. Declining production (2) em and d Production production gap! p ly s up Time
- 13. Oil Tops Inflation-Adjusted Record Set in 1980 (NYT, March 4, 2008) $103.76, April 1980 $102.45, March 2008 Price of a barrel of oil, adjusted for inflation 1 1960 1970 1980 1990 2000 2008 (Source: Federal Reserve Energy Information Administration)
- 15. John Hess, CEO of Hess Corp. “We've moved from a supply-led market to a demand-led one. In the past, the world has relied on OPEC's spare capacity, which in 1985 was 10 million barrels per day. Today that number is about 2.5 million barrels a day. We no longer have a safety margin to ensure price stability in the face of supply interruptions and demand spikes. Right now it's hard to see any relief in sight. Then there's demand. About 50 percent of oil demand is for transportation, and auto ownership in the developing countries is growing swiftly, especially in India and China. ….. Put those two things together - limited supply and increasing demand - and you get high oil prices.” (Newsweek, March 15, 2008, http://www.newsweek.com/id/123482)
- 16. International Energy Agency Fall 2008 The world’s energy system is at a crossroads. Current global trends in energy supply and consumption are patently unsustainable - environmentally, economically, socially. But that can - and must - be altered; there’s still time to change the road we’re on. It is not an exaggeration to claim that the future of human prosperity depends on how successfully we tackle the two central energy challenges facing us today: securing the supply of reliable and affordable energy; and effecting a rapid transformation to a low-carbon, efficient and environmentally benign system of energy supply. What is needed is nothing short of an energy revolution. http://www.iea.org/Textbase/npsum/WEO2008SUM.pdf
- 17. New find in GOM (Jack No. 2 test well) • up to 3-15 billion barrels of oil • US consumption 20 million barrels/day • 5 months - 2 years • reservoir is 8 km under sea level
- 18. A Quest for Energy in the Globe’s Remote Places (New York Times, October 9, 2007) A natural gas cargo ship passing Melkoya Island, across the bay from Hammerfest, Norway.
- 19. Oil-Rich Nations Use More Energy, Cutting Exports (New York Times, December 9, 2007)
- 20. Who has the oil? USA China India (http://www.energybulletin.net/37329.html)
- 21. What is the plan?
- 22. A New, Global Oil Quandary: Costly Fuel Means Costly Calories (NYT, January 19, 2008) Rising prices for cooking oil are forcing residents of Asia’s largest slum, in Mumbai, India, to ration every drop. Bakeries in the United States are fretting over higher shortening costs.
- 23. Carbohydrates and biofuel glucose cellulose Do we feed humans or cars? Is it a good idea to compete with our machines for calories?
- 24. Research: biofuel from cellulose 25 Processing costs ($/GJ) 20 cellulose 15 vegetable starch oil (glucose) 10 gas oil 5 (100$/barrel) 0 5 10 15 20 25 Feed cost ($/GJ) http://gcep.stanford.edu/research/biomass.html (Figure adapted from Lange, J.P., Biofuels, Bioproducts and Biorefining, 1: 39-48, 2007)
- 25. First solar 2 MW array Ft. Carson, CO
- 26. Research: efficient solar cells 1 mm http://gcep.stanford.edu/research/solar.html
- 27. Fossil fuel reserves Proven World Reserves-to-Production Ratio 200 • The R/P ratio is the number of years that proved at End 2004 (Years) reserves would last at 164 yrs. Your children current production rates. Your grand-children World R/P ratios are: Oil = 40.5 years; Natural Gas = 66.7 years; Coal = 164 years 100 U.S. R/P ratios are: 66.7 yrs. Oil = 11.1 years; Natural Gas = 9.8 years; 40.5 yrs. Coal = 245 years 0 Oil Gas Coal BP Statistical Review of World Energy 2005
- 28. Non-conventional reserves (excluding gas and coal) Produced (gone) Proved Reserves Undiscovered(?) Conventional Extra Heavy Oil (“easy”) EOR & Tar Sands Shale Oil 0 25 50 Unconventional petroleum resources: (more difficult & dirty, and therefore expen$ive) Years Supply at 2005 Production 0 1 2 3 4 5 6 7 8 9 10 Trillions of Barrels Recoverable (Courtesy of Joe Stefani)
- 29. World’s unconventional production N.B. World’s annual oil consumption 2006 is 85 million barrels/day Source: Energy Information Administration, 2007
- 30. Non-conventional oil 2 tons of tar sands produce 1 barrel of bitumen (~asphalt) Tar Sand Heavy Oil from National Geographic, June 2004 Oil shale
- 31. CO2 emissions vs fuel type Coal Natural gas 564 lbs per MWh 331 NREL technical report NREL/TP-840-400665
- 33. Temperature and CO2 records Carbon Dioxode (ppmv) 400 350 Temperature change (oC) 300 250 2 0 200 -2 -4 -6 -8 -10 1 350 300 250 200 150 100 50 now Thousands of year before present
- 34. IPCC 4th Report 850 ppm CO2 in 2100 (A2) 680 ppm CO2 in 2100 (A1B) 550 ppm CO2 in 2100 (B1) Year 2000 constant concentration 20th century 4oC http://www.ipcc.ch/SPM2feb07.pdf
- 35. What is 4oC difference? 4oC Temperature change (oC) 2 0 -2 -4 -6 4oC -8 -10 Riss Würm 1 350 300 250 200 150 100 50 now Thousands of year before present
- 36. Arctic sea ice 1995-2007 (National Snow and Ice Data Center, Boulder)
- 37. Arctic sea ice 2005-2007 4.3 million sq km 4.3 million sq km (National Snow and Ice Data Center, Boulder)
- 38. Sea-level rise in Florida
- 39. …. and in other parts of the world http://www.globalwarmingart.com/wiki/Sea_Level_Rise_Maps_Gallery
- 40. Curbing CO2 emissions (Pacala and Socolow, Science, 305, 968-971, 2004)
- 41. The 7 wedges (Pacala and Socolow, Science, 305, 968-971, 2004)
- 42. Choose 7 out of 15 wedges distributed over: • energy efficiency and conservation • nuclear energy • renewable energy and fuels • more efficient forest and land use • injecting CO2 in the subsurface
- 43. One wedge is ….. • generate electricity at 60% efficiency • wind turbines: 3% of the USA surface • photovoltaics: 700 X today’s use • nuclear power: double (build 500) • inject 3 Giga-ton of CO2 per year
- 44. Energy efficiency Lost energy = 60%!
- 45. Research: high-temperature combustion fuel/H20 turbine http://gcep.stanford.edu/research/combustion.html
- 46. Efficiency can pay off Cost per ton CO2 90 60 30 0 1.4 1.6 1.8 2.0 2.2 2.4 2.6 2.8 3.0 -30 Gigatons/year -60 -90 -120 -230 Current USA emissions: 7 Gigatons CO2/year Source: McKinsey analysis, http://mckinsey.com/clientservice/ccsi/greenhousegas.asp
- 47. Cost ($ per ton CO2) -80 -40 0 40 ele c tro ef nic fic sa ie nd ef nt fic l ie cars ight ag ing 1 co nt n a ri c ot m nd ult ur he ri po bin ew t nc we ed bu ruc im e, pr fo l ot r g he ildi ks he e a ng ov re . n u r ne t/p s st e ry clea ra o w tio e ex , la r n/ r ist nd in in g us e du st re bu ry 2 ne ild ca wa in rb bl gs on e en se er qu gy es 40% of current US emissions! t ra tio n US CO2 emission avoided (gigatons/year) 3
- 48. How much CO2 to sequester? 1 km 2 km • one wedge is 3 GtCO2/year • world oil production is 4 Gt/year
- 49. The Sleipner project as a X 3500 ! show-case
- 50. Kuwait from space 30 km N
- 51. Research: gas separation Develop membranes to separate H2 or CO2 for carbon-free hydrogen production. http://gcep.stanford.edu/research/co2capture.html
- 52. What can I do as educator? “I think we have the responsibility to insist that education is more than learning job skills, that it is also the bedrock of a democracy. I think we must be very careful that in the race to become wealthier, more prestigious, and to be ranked Number One, we don't lose sight of the real purpose of education, which is to make people free - to give them the grounding they need to think for themselves and participate as intelligent members of a free society.” Myers, T.M., A student is not an input, NYT, March 26, 2001
- 53. How much CO2 is produced by burning the coal in one railroad car?
- 55. From the thirteen myths …. • Today’s energy crisis is a hype • The public is well informed about energy • The hydrogen economy is a solution • Efficiency improvements have reached their potential • Climate policy will bankrupt the US economy • World-wide power systems are optimal (Energy and American society - thirteen myths, eds. B.K. Sovacool and M.A. Brown)
- 56. Lobby for a climate commitment • Initiate the development of a comprehensive plan to achieve climate neutrality as soon as possible. • Initiate two or more of the following tangible actions to reduce greenhouse gases while the more comprehensive plan is being developed…. • Make the action plan, inventory, and periodic progress reports publicly available …… http://www.presidentsclimatecommitment.org/
- 57. What can I do as consumer? Lighting Transportation Appliances
- 58. Oil needed to produce bottled water (http://www.armchairenvironmentalist.com/blog/index.php?paged=2)
- 59. Kirsch Center DeAnza Community College Energy saving: $65,000/year
- 60. Plug-in vehicles
- 63. Recycle! Local passenger transport 12% Goods and materials 38% Building energy use 31% Inter-city Food 12% passenger transport 7% US CO2 emissions per sector (2005), source US EPA
- 64. What can I do as student? • become a professional • seek out new opportunities • push for energy conservation
- 66. What can I do in business? • Seek opportunities in sustainable business (for ideas: http://www.sustainablebusiness.com) • Create an energy plan and save. • Imagine what is possible when energy prices rise. http://www.danchiras.com
- 67. What can I do as citizen? • Ask: what is our energy plan? • Start a discussion in your community. • Demand that the United States becomes a world-leader in responsible use of energy. “ That which we are, we shall teach, not voluntarily but involuntarily.” [Emerson]
- 68. What if we had the courage to dream ….. and raise fuel standards for cars by 25% to European levels, generate 20% of electricity by wind (as Denmark does), generate another 20% of electricity from sunlight, and conserve 20% by increased efficiency. This can be done if we want it to happen! “To have sustainable economic growth 10 years from now, both consumers and producers need to start acting now.” John Hess, CEO of Hess Corporation in Newsweek, 3/15/2008 http://www.newsweek.com/id/123482
- 69. Questions/comments? “The difference between stumbling blocks and stepping stones is how you use them.” Send feedback to Roel Snieder: email rsnieder@mines.edu Presentation: http://www.mines.edu/~rsnieder/Global_Energy.html
Notas do Editor
- In this presentation I discuss the status of our global energy supply. I want to start with this picture of the cure polar bear. What is wrong with this picture? (Now give the audience a chance to respond.) Somebody remarks that there is no ice. Indeed, the polar bear should be on ice instead of on a pebble beach. Global warming is hurting polar bears. Because of the receding ice-cap in the arctic many bears don't make it back to the sea-ice over the summer and get stuck on land, separated by too much water from the sea-ice. One of the main points I will make in this presentation is that the issues of our global energy supply and that of climate change cannot be separated.
- The development of this presentation was supported financially by the Global Climate and Energy Project (GCEP) at Stanford University and was developed in collaboration with researchers there. GCEP is funded by ExxonMobil, Schlumberger, Toyota, and General Motors. The project is aimed at long-term research projects for new energy solutions, especialy those that help reduce greenhouse gas solution. Because of the long-term and innovative scope, the focus is on high-risk research that may lead to breakthrough solutions, and the research is pre-commercial. (This means that the implementation takes so much time that commercialization is not yet relevant.) The research is carried out at Stanford University and at partner institutes in the United States, Europe, Japan, and Australia.
- This graph is from the Energy Information Agency. This agency is the official source for energy statistic from the US Government. A yearly "International Energy Outlook" is presented by the Energy Information Agency with the current state of world-wide energy use and supply. In the figure, time runs from 1980 on the left to 2030 on the right. The vertical axis shows world-wide energy demand. The units are Quadrillion Btu's, but it does not matter what the units are. The main point is that the world-wide energy use is expected to grow with about 70% in the coming 20 years. N.B. the energy use of the USA is expected to grow with 20% in the same period.
- Much of the energy growth come from developing countries. Espcially India and China are developing, and aim to have a standard of living that more closely resembles that western world than it does now. The picture on the right shows a new car, the Tata Nano. This car symbolizes the wish of India to have a higher standard of living. This car is for sale for about $2,500; a low price that should make is affordable for many Indians. What is now a congested street with foot-traffic (left panel) will be an even more congested street with cars.
- But the developing countries want to have a standard of living that is just closer to ours. Our cars in the western world use quite a bit more fuel that the Tata Nano does, and we have little moral ground to stand on to tell developing countries that they cannot aspire to a standard of living that is closer to ours.
- Before discussing our energy supply, let us first consider that we are using energy for. You are likely to think of transportation, heating, electricity generation, and manufacturing, and indeed, these activities use energy.
- But we use energy for so many other purposes. In the United states we use about 400 gallon of petroleum person per year for growing food*. This is used mostly for producing fertilizer, for irrigation, and for transporting our food over an average distance of 1,300 miles. This is about a gallon per person per day. We also use petroleum for manufacturing many materials such a plastics, the long molecules in petroleum are great for manufacturing things from. Our society is completely controlled by communication and information technology. Most devices have chips in them, and would not function at all without those. Computers and information technology are essential in running our world. This technology does not use much energy, but without energy these devices cease to work and this would cripple society. * Pollan, M., The omnivore’s dilemma, Penguin Books, London, 2006.
- It is interesting to see from which sources we get energy. This graph, also form the Energy Information Agency, shows the use of different energy sources over time. At this moment, about 40% of our energy comes from oil, 20% from coal and 20% from gas. According to the Energy Information Agency this mix is not expected to change. This means that 80% of our energy comes from hydrocarbons. Perhaps surprisingly, nuclear energy will not grow much according to the EIA, and there is a modest expected growth in renewables. Of course, these are projections that may not come true.
- Petroleum, coal and gas These fuels are aptly called fossil fuels, since they are remnants of buried organic-rich ecosytems that existed tens of millions year ago; for this reason those resources are finite and production will ultimately decline. The date when oil production peaks is a contentious issue, and several organization develop scenario's to predict oil production. This scenario is from the Energy Information Agency. The three curves are based on three different estimates of the amount of oil that we can recover. (We don't know exactly how much this is.) Depending on the assumption, this would lead to a peak in oil production between 2026 and 2046. The used estimates of remaining reserves for these prediction are from the US Geological Survey. These are by far the most optimistic estimates. Wood, John H., Long, Gary R., and Morehouse, David F., “Long-Term World Oil Supply Scenarios: The Future Is Neither as Bleak or Rosy as Some Assert,” U.S. Department of Energy, Energy Information Administration, August 2004. http://www.eia.doe.gov/pub/oil_gas/petroleum/feature_articles/2004/worldoilsupply/oilsupply04.html
- Here is another, much less optimistic scenario of peak oil. This scenario is based on different assumptions and predicts that oil production peaks ..... about now! The truth may lie somewhere between these different scenario's, but in a way it is not really relevant when oil production peaks. The production of oil, our source that supplies about 40% of the world's energy will declines in the near-future. This raises the question how we will meet our energy demand in a world whose energy use is growing. Now. I ask the audience to look at this graph and tell me when peak oil occurs. Get them involved! Note: The continental US has peaked in the 1970’s Europe is decreasing (notably the North Sea) Deepwater production is not large
- Here is a sketch of peak oil. One may think that the problems start when oil is depleted, and oil supplies are exhausted.
- But the problems start earlier. When demand increases, of even for a constant demand, a production gap opens up as soon as production goes down. The oil production fails to meet demand as soon as we reach we peak. Which could be in the very near future. (It may be now.) Ask the audience how we would find out if we are getting hit by a production gap. Somebody will say the demand is greater than supply, so prices rise. This is a point to get across.
- And indeed, the price of oil has gone up dramatically over the last 2 years. You all know this when you fill up your car at the gas-station. This graphs, from the New York Times, shows the price of oil corrected for inflation. Oil has never been as expensive as it is now, and even when we correct for inflation it is about the same price as in the energy crisis in the 1980's. By the way, this graph is already outdated, since March 4, 2008, the price of oil has gone over $110 per barrel. The rising price of oil does not mean that we are passed the peak in oil production, but it does indicate that the petroleum market is stressed. Let's see what an expert says.
- In the early part of 2008 oil prices were ar a record high, and have declined later in 2008. This figure shows projections of the Energy Information Agency of the US government on future oil prices. The decline in oil price associated with the current economic slowdown is expected to be short-lived; after that, oil prices are expected to follow the rising trend they showed before the economic slowdown. Of course, all these projections are uncertain, and the spread in projected values is large. N.B. This is the price of oil expressed in 2007 dollars. AEO = Annual Energy Outlook
- John Hess is the CEO of Hess Corporation, one of the oil companies in the USA. He clearly states that “We've moved from a supply-led market to a demand-led one. …. Right now it is hard to see relief in sight ...... Put those two things together - limited supply and increasing demand - and you get high oil prices.” He confirms that the petroleum market is stressed by a demand that is very close to supply, that this is not likely to change soon (don't expect gasoline prices of $1/barrel), and that development plays role in this situation.
- Text from the Executive Summary of the International Energy Agency Outlook (fall 2008).
- This image shows the drilling rig in the Gulf of Mexico that drilled into a major resrvoir. This find was announced as a major discovery, and is expected to produce between 3-15 billion barrels of oil. This sounds like a lot. When compared to current US oil consumption of about 20 million barrels of oil, this reservoir would provide petroleum for the US for anywhere between 5 months and 2 years. But remember that this is the largest find in the last 10 years. But the amazing thing is what you cannot see in this image. The drilling rig is placed in water 2 km deep, think of the technological challenge of doing this. The drill stem then goes through 6 km of sediment to get to the reservoir. The drill stem is 8 km long, it is about as long as Mt. Everest is tall! This is an amazing acchievement from a technological point of view, and it is, of course, very expensive to do this. So why does industry do this? The answer is that we literally must go to the edges of the world, in this case in depth, to produce the oil that we need.
- This in another example of the effort we go through to produce fossil fuel. The image shows a tanker that transports natural gas from Northern Norway to the east-coast of the USA. The gas is produced from a well under the Arctic Ocean.This is a terrible place to produce gas. There is sea-ice and there are terrible storms. (This is the dreaded region for the Murmansk convoys in the second world war.) This gas is being produced from a facility placed on the sea-bottom. Think again of the cost and technology involved to do this. We HAVE to go through these troubles to keep production going and ensure that the homes of consumers in the Northeast US can be heated. This image is from an article in the New York Times. I want to encourage to look at the news and be attuned to news items related to energy. Almost every day there are items that illustrate in different ways that the energy market is tense, and we go through greater and greater efforts to acquire hydrocarbons.
- Here is yet another sign that oil production is under stress, again from a newspaper clipping. More and more countries that export oil are starting to import oil An example is Mexico which exports oil to the USA. The image shows traffic in Mexico City. Because of rising domestic demand, and declining production, Mexico will import oil soon. Indonesia will also soon into an oil-importing country. China turned from an oil exporting country into one that imports oil several years ago. It should be clear that we cannot all import oil; somebody has to export it!
- This map of the world shows the surface area of every country in proportion to their oil reserves. The biggest country, as measured by oil reserves, is Saudi Arabia. The other counrties with large reserves are also in the Middle East: Iraq, Kuwait, Iran, and the smaller Gulf-States. Then there is West Africa, notably Nigeria. In the America’s Venezuela has by far the largest reserves. Note that Russia, which often is presented as possessing major petroleum reserves is not that large. Now let’s look at the oil consumers. Europe is almost invisible and is dominated by countries near next to the North Sea. The USA is fairly small, especially when we consider that the USA consumes about 25% of the world’s oil. In fact, oil production in the continental USA peaked in the mid 1970’s. This was predicted already 20 years earlier by King Hubbert from Shell. Note how small China and India are on this map. Both countries together have about 2 billion people, but virtually no petroleum reserves. It is clear that there is huge discrepancy between the producers and consumers of petroleum. In a world where supply is adequate and there is no political strife this is not necessarily a problem. It will be clear that in a time where demand is larger than supply and where political relations are not optimal, the situation can be dangerously stressed. If, as a speaker, you want to make a connection with politics, then below is a list with countries the US had/has problems with. Note some conflicts between the USA and major producers: Kuwait: invasion in 1991 Saudi Arabia, most of the attackers from Sep 11, 2001, came from this country. Iraq: invasion on March 20, 2003 Iran: long-term tensions, now about nuclear program Venezuela: tense relation with Chavez And the list goes on: Russia, cold war that has now turned into lukewarm friendship. Libya, downing of flight Panam 103 over Lockerbie (Scotland) in 1988. Let the audience draw its own conclusions. It is better to just present facts than to stand on a soap-box rub a view that many people don’t want to hear.
- So here are three facts: We get most of our energy from oil. Energy demand rises with 70% in the coming 25 years. Oil production is likely to decrease. Ask the audience: what is the plan? Nobody knows, and this exactly the problem. Explain that we need a strategy to ensure a secure energy supply that meets demand.
- So we are working on alternatives. This is a clipping from the New York Times where it is stated that the demand for bio-diesel drives up the price of cooking oil up to the point where it becomes unaffordable to people in developing countries. The picture shows the collection of palm-fruit for bio-diesel. The price of food is sharply rising, one of the reasons is that we use food to create bio-fuel.
- We can make ethanol either from glucose (such as the corn cobs), or from cellulose (the corn leaves and stalks or wood-chips). Cellulose and glucose are chemically similar, but there is a smalll but essential difference: humans can digest glucose, but not cellulose. (That’s why we eat only the cob of the corn and don’t eat wood-chips for breakfast.) By making bio-fuel from material that we can eat (glucose) our cars start competing with humans for calories. Corn-ethanol is already driving up prices for corn to the extent that poor Mexican’s have a hard time buying corn-flour. It makes sense to make bio-fuel from cellulose, which is waste from the point of view of human consumption. In the 1960’s there were those movies of machines taking over the world. (In fact, the recent movie “The Matrix” has the same theme.) In a way this is happening now. Our cars run on ethanol produced from food that humans need. There is a competition now between humans and their cars.
- There is much research going on with the goal of producing bio-fuel in more sensible ways. This graph show the material costs of various sources of fuel versus the processing costs. It shows that it currently is expensive to make bio-fuel from cellulose. Research is done at GCEP to create bio-fuels at a lower cost. Bacteria, such as E-Coli, are being modified to assist in this process. N.B. In this graph (modified after Lange, J.P., Biofuels, Bioproducts and Biorefining, 1: 39-48, 2007) and oil price of 100$/barrel is assumed instead of the 75$/barrel used in that publication.
- Solar energy is a potentially very rich energy source. The sunlight striking the Earth delivers a power of about 120.000 TW (tera Watt). In 2004 the global energy use was about 15 TW. This means that 10^(-4) (1 percent of 1 percent) of all sunlight would be sufficient to cover our energy need. The key is to deliver this power economically. Another challenge is that solar power can only be collected suring daytime. One therefore needs another source of energy during the night, or one needs to store the energy collected during the day somehow.
- Making efficient and cheap solar cells is crucial for making solar energy operational on a large scale. Here is an example of research.In photovoltaic materials the light needs to penetrate sufficiently far into the material to be converted in electrical power by the separation of electrons and holes in a semi-conductor. This requires the material to be thick. The electricity produced must be able to leave the material, otherwise it is of no use. This requires the material to be thin. This trade-off is a limitation in optimizing photovoltaic materials. Research at GCEP aims to resolve these conflicting requirements by creating materials that have “thin hairs” of semi-conducting material. These thin hairs”on solar cells give the sunlight sufficient propagation distance in the cell to let the solar energy be converted into electric power (yellow arrows), yet is provides a short path for the produced electrons to leave the material (red arrows). The image on the right shows such a material. Nano-technology is used to produce this material.
- So let’s consider again world-wide reserves of hydrocarbons. We have seen that petroleum, as we know it now, will not last that long. What about gas and coal? The bars in this figure give the lifetime of expected global reserves for oil, gas, and coal. Shown on the right is the life-span of children that are born now, and their children. Main points to note are: The depletion of oil and gas are not events that are far in the distant future. We may see this, and our children and grand-children certainly will. There is quite a bit of coal around to keep us going for several generations. As we will see later, burning coal produces much CO2 (as well as other pollutants). This links the energy issue to the climate issue. N.B. This figure is a bit deceptive because it suggest a resources is available, and then suddenly is depleted. We have seen from the curves for peak oil that it does not work in this way. The production of a resources slowly declines. As we discussed earlier, demand may exceed supply long before a resource is depleted.
- In addition to coal, there is non-conventional oil, such as extra heavy oil, tar sands, and oil shale. In the next slide I show examples of those fuels. As shown on this graph, these resources potentially triple the amount of available oil. What is not clear is whether we can get to these resources economically. But the point is, there is potentially much more non-conventional oil around than the conventional oil that we have been producing now for about a century.
- Despite the optimistic numbers for total reserves of unconventional oil, the predictions for production rates are not encouraging. Graph shows the prediction from the Energy Information Administration. For 2006 the worldwide production of unconventional oil and biofuels is about 4 million barrels of oil (equivalent). Current (2006) world oil consumption is 85 million barrels of oil/day. Even in 2030 the expected non-conventional production is 10 million barrels of oil/day. These estimates shown here are uncertain, and the final production rate may well be determined by the price of oil. (A higher price of conventional oil makes other sources of fuel more attractive.) N.B. this estimate includes bio-fuels!
- Shown here are images of non-conventional oil. The material on the left is called tar sand. This is a sticky mixture of tar and sand. This material cannot be simply pumped up to the surface. Shallow deposits can be scooped up in open pit mines. The tar sand is then heated so that the oil flows, so that it can be separated from the sand. For deeper deposits this does not work. In this case one heats the tar sand by injecting steam in the reservoir. The heat melts the tar, so that it can be pumped to the surface. The image in the lower right shows oil shale. This is a fine-grained sandstone with hydrocarbons that is locked-up in the rock. In order to produce this fuel, the rock must be heated for several years. This alters the chemistry of the oil so that it can be produced. Shell is doing a pilot-project in western Colorado. In this project the subsurface is heated with electric heaters. When you do this, fluids start to move. In order to prevent the fluids from moving away, a wall is build around the rock in the subsurface that is heated. This wall is created by freezing the rock around the area that is heated. Think of the energy required to do this. If this process works and oil-shale is produced on large-scale, Shell will build coal-fired power plants to generate the electricity needed to extract fuel from the oil shale. Mining non-conventional oil material requires much energy, and sometimes also much water. The environmental cost is thus much larger than for conventional oil. So from the fossil fuels, coal and non-conventional oil are longer term resources. Producing these releases much more CO2 into the atmosphere than conventional oil. Thus our energy demand will go up, and we are likely to use resources that produce much more CO2 per unit energy. For this reason the energy challenge and the climate issue are intertwined. UNLESS WE MAKE A PLAN AND ARE MORE CLEVER!
- Producing non-conventional oil costs much energy, this increases CO2 emissions. Also, burning coal vs. oil or gas increases CO2 emissions as well. Shown are CO2 emissions per unit energy produced for coal and natural gas. Coal produces more than twice as much CO2. This means that a shift towards non-conventional oil and goal will increase our CO2 emissions per unit energy produced. And this happens in a time when our energy use goes up as well. The reason coal produces more CO2 per unit energy than natural gas is that the carbon hydrogen ratio is higher in coal than in natural gas. Carbon leads to CO2, hydrogen to water, hence natural gas burns cleaner.
- So why does more CO2 in the atmosphere to global warming? The atmosphere is transparent for much of the light that we receive from the sun. (That’s why we can see the sun.) The earth absorbs this radiation, and send out it’s own radiation. Since earth is colder than the sun, it radiates light at a different wavelength. This radiation is infra-red, and humans cannot see this. Infra-red radiation is absorbed by CO2 in the atmosphere and a fraction does not make it back to space. The absorbed radiation heats the atmosphere. This is called the greenhouse effect, which is a perfectly natural phenomena. If the CO2 content in the atmosphere increases, the greenhouse effect becomes stronger, and this leads to an additional heating of the atmosphere. This is thought to be a contributor to current global warming. In the next slide I show how much the CO2 concentration has increased.
- Temperature and CO2 concentration in the atmosphere over the last 400.000 years. These data have been extracted from ice cores taken at Antarctica (the “Vostock-cores.) Air trapped in bubbles can be used to measure the CO2 concentration. The temperature measurement is more complicated. Depending on temperature, different oxygen isotopes are preferentially incorporated in water molecules. By measuring the ratio of these oxygen isotopes an estimate of temperature is obtained. It can be seen that temperature and CO2 concentration change with time. Such change is natural. The dominant fluctuation has a period of 100.000 years, and is caused by changes in the eccentricity of Earth’s orbit. Note that during these changes the CO2 concentration varies between 200 and 300 ppm. This range in CO2 concentration is the natural variability over this period. It is worthwhile to remember the numbers for the “normal” CO2 concentration (200-300 ppm), because we will come back to this number. Now note that happens all the way to the right. The CO2 concentration rises over a very short time to 380 ppm, a level not seen in the last 400.000 years. This is an unprecedented anomaly that coincides with the industrial revolution and the 20th Century. It is this change that causes concern over man-made global warming, because, as we have seen in the previous slide, more CO2 leads to a higher temperature. For more information on the data see http://en.wikipedia.org/wiki/Ice_core#Vostok
- The Intergovernmental Panel on Climate Change (IPCC) carried out a comprihensive study on climate study, for which they received the Nobel-prize. This graph is from one of their reports, it shows the change in global surface temperature from 1900-2100. The black line shows measured global temparature over the 20th Century. The colored lines are from general circulation models assuming different growth levels for the CO2 concentration (indicated by the CO2 concentration in 2001). The temperature increase is expected to be 2-4 degrees C. The 4 degree C increase is marked for future reference with the red bar. It is interesting to look at the CO2 concentrations that IPCC assumes for the year 2100. It ranges from 550 ppm (which is twice the pre-industrial level) to 850 ppm. This is three times the pre-industrial level. For comleteness, here is the caption from IPCC report: Figure TS.32. Multi-model means of surface warming (compared to the 1980–1999 base period) for the SRES scenarios A2 (red), A1B (green) and B1 (blue), shown as continuations of the 20th-century simulation. An additional experiment, in which the forcing is kept at the year 2000 level is also shown (orange). Linear trends from the corresponding control runs have been removed from these time series. Lines show the multi-model means, shading denotes the ±1 standard deviation range. Discontinuities between different periods have no physical meaning and are caused by the fact that the number of models that have run a given scenario is different for each period and scenario (numbers indicated in figure). According to Fig 10.26, the CO2 levels in 2100 in these different simulations is: A2: 850 ppm A1B: 680 ppm B1: 550 ppm
- So one may think: why worry about a 4 degree increase of temperature? 4 degrees centigrade, as predicted by the IPCC models is the same temperature difference as between an ice-age and a normal climate period. In the two graphs, the red bard indicate the same temperature difference of 4 degrees C. Since the scale is different, the bars have a different length. Two glaciation episodes, also called ice-ages, are marked with the blue bars. 4 degrees temparature change can be associated with a big change in climate, certainly at a local scale. So four degrees C may seem like a small number, but it reflects a big change in the Earth’s climate.
- We have evidence that the current warming leads to the disappearance of the Arctic ice sheet. Here is the extent of the Arctic ice cap in September 1995 and September 2007. (This is the time of year when the ice cap is smallest.) The average extent of the ice cap in September is indicated with the purple line. In 12 years, 30% of the ice cap has disappeared. This causes the problems for the polar bears. They need to traverse the ice to get from the land to the ice where they hunt over the summer for seal. Because of the shrinking ice cap, polar bears get stranded in the summer on land, where they don’t belong. See the first slide. Not only is the sea ice in the Arctic melting, so are many glaciers. Many cities in the Andes get their drinking water from melting ice during the summer. When the glaciers disappear this source of drinking water disappears, and major cities be not have drinking water in the dry summer months.
- Same as the previous slide, but now for 2005-2007. It shows how fast the ice is melting, 20% in 2 years!
- A warming climate causes sea level rise because (I) ice on continents melts (Greenland, Antarctica), and (ii) sea water expands when it warms up. Sea level rise predicted by IPCC report from 2000-2100 (Fig. TS.27) is about 0.4 m. This means that the dark-red areas will be under water. This is, for Florida a thin strip along the coast, but this is where the people live! What is not taken into account here is that warmer sea water leads to stronger and more frequent hurricanes.
- Here are maps of land that disappears with sea level rise in other parts of the world. Again the dark-red areas are submerged with a 50 cm sea-level rise, as predicted by the IPCC. Let’s first look at the map on the left of northwestern Europe. Part of the Netherlands is already below sea level. The Dutch keep the water out with their dikes. This is a rich country, and they can cope with it by raising the dikes. Dutch will cope with sea-level rise because their wealth allows them to take protective measures. Florida, also being a rich area, will likely deal with sea-level rise by relocating inland. (Although one may wonder after hurricane Katrina hit New Orleans whether such relocation will happen before some disaster occurs.) But consider a poor country like Bangladesh, as shown in the image on the right. This country already struggles with floods, and more people will be displaced when sea level rises. The population of Bangladesh is 150 million. This is a question to ask the audience: where will the displaced people in Bangladesh go?
- This figure shows predictions for CO2 emissions. The units on the vertical axis is Giga-ton Carbon per year. (To get the CO2 mass, multiply with a factor 3.) BAU denotes the business as usual scenario, this is the CO2 emission is no action is taken to curb CO2 emissions.The line WRE500 shows an emission scenario to keep the CO2 concentration in the atmosphere at 550 pm, this is twice the pre-industrial level of 280 ppm. The 550 ppm case was the blue curve in the figure of the IPCC on expected temperature rise, it corresponds to a 2 degree C increase in temperature. Supppose one sets the 550 ppm as an acceptable upper level for the CO2 concentration, then we need to take steps to avoid the CO2 emissions shown in the green wedge. In this way one can assess how much CO2 emissions we need to avoid to keep the CO2 concentration at a given level, in this case twice the pre-industrial level. Note that in order to achieve this, the CO2 emissions need to be reduced by about 50% compared to the business as usual scenario. Note: this is a story that is complicated for many audiences, and one can consider to leave this slide and the following slide out.
- So if we want to cap the CO2 concentration at 550 ppm, we must avoid the CO2 emissions in the green triangle. Pacala and Socolow divide this in 7 wedges and show what can be done to reduce the CO2 emission in each wedge. They show 15 possible actions we could take, 7 of which would together do the job of curbing the CO2 concentration at twice the pre-industrial level. In the next slide we show examples what these actions could be.
- There are numerous activities that could save CO2 emissions. Above are listed some of these activities. In the next slide we see how much we should do for several activities. Energy efficiency and conservation speaks for itself, we return to it later. The technology for nuclear energy is in place, but we are reluctant to use it. The US generates about 10% of its electricity from nuclear power, but for France this number is 80%. Nuclear energy is not without problems, but we are not very rational in comparing the risks and adverse health effects of nuclear energy with that of other source of energy, such as coal. Renewable energy is potentially a big growth sector. Hydropower in the US is close to its maximum since the Bureau of Reclamation and the Army Corps of Engineers filled the country with dams. But wind and solar have potentially much growth potential. Geothermal is more controversial, estimates how much energy we can extract economically from this source vary wildly. More efficient forest and land use. Much CO2 is exchanged in both ways between forests and the atmosphere, and between agricultural areas and the atmosphere. Changing this exchange rate by different ways of managing forests and agricultural can make a difference in the net CO2 exchange between the atmosphere and forests/farmland. Another option is to inject CO2 in the subsurface. To do this on a scale that makes a difference one cannot use old oil reservoirs; there simply is not enough space. But saline aquifers have potentially enough space to store huge qauntities of CO2.
- So here are some examples of each actions that lead to 1 wedge of reduced CO2 emissions. Currently, coal fired power plants generate electricity at about 35% efficiency, the other 65% is lost as heat. This is why one can see huge plumes of hot steam come out off the chimneys of these power plants. One cannot increase the efficiency to 100%, thermodynamics put an upper limit on the efficiency of the conversion of heat into work (electricity). By the way, another 10% of electrical energy is lost by long-distance transport through transmission lines. This loss could be reduced by a decentralized system of generation of electrical power. Wind turbines over 3% of the surface of the USA could avoid another wedge of CO2 emissions. This seems a lot, but remember, this is for the whole world. When the windmills are distributed over the world the intensity of windmills is much less. Another wedge is to increase photovoltaics with a factor 700. This may seem like a lot, but a growth of 25%/year over 30 years would do the job. Over recent years, the growth in the use of photovoltaics was about 25%/year, so this can be done. Nuclear power, build one new reactor for every exisiting nuclear reactors. This means that about 500 nuclear reactors need to be added to the existing reactors to reduce one wedge of CO2. Inject 3 giga-ton of CO2 per year in the subsurface. I will explain later what this means.
- This complicated graph illustrates how inefficient our use of energy it. This figure is from the Department of Energy and is valid for the USA. The left shows the different sources of energy (petroleum, coal, and gas dominate). This energy is used for different purposes as indicated in the middle (electrical power, transportation,etc.).On the right the energy is divided into into useful energy and lost energy. Useful energy is, for example, the light that comes out of a lightbulb, while the lost energy in that case is the heat lost in the power plant, the power lost transporting the electricity, and the heat lost by the lamp. We put only 35% of the energy to use for the purpose for which it is generated. 57% of the energy is lost as heat. This is an amazing number. Ask the audience for some examples how we loose energy, and discuss to what extent such losses can be avoided. Be aware that these energy losses can not completely be avoided, thermodynamics imposes restrictions. Nevertheless, we can waste much less energy than we do now. Later in this lecture we will see some examples. N.B. The lost energy and useful energy on the right don’t add up to 100% because there are some other “endpoints” in the energy flow, such as the non-fuel use of petroleum (5.9%) and the export of petroleum/gas (2%) and coal (1%). The lost energy indicated by the red arrow is measured with respect to the 91.4% coming out at the right.
- So we loose about 60% of the energy used. There are thermodynamic limits to efficiency. The higher the temperature difference in the conversion is of heat into work or electricity, the larger less energy is lost. Power plants therefore would be more efficient if they would operate at a higher temperature. If the temperature is too high, damage to the walls of the combustion chamber results. The sketch shows a new design of the combustion chamber where the gas is kept flowing. The result is that the hottest gas never makes contact with the walls. This allows a higher operating temperature, and hence a greater efficiency.
- But avoiding CO2 emissions can actually pay off. This is a complicated graph, but it is really interesting. This figure resulted from a study done by McKinsey, a consulting company in business. In their study they analyzed the amount of CO2 emission that can be saved in the USA by taking different steps, the amount of CO2 emissions avoided, and the cost per ton CO2 for each of these measures. The bars stand for different activities that save CO2 emissions. The horizontal axis gives the amount of CO2 emissions saved in units of Giga-ton CO2 per year. The vertical axis gives the cost of these activities. The next slide is a simplified version of this complicated graph that shows what the activities are.
- The main point is that the activities on the left have negative cost. This means that these activities generate income. Let’s take a look at some steps that reduce CO2 emissions that have negative cost. These include more efficient lighting systems, improved insulation of building and houses, more efficient cars. Also included is combined heat and power systems. Remember that about 65% of the energy is lost in the form heat when generating electricity. Why not use this heat to heat buildings? Often, initial investments are needed. For example, insulating buildings takes money at first, but in the long run it saves money (and CO2 emissions) because of the energy saved. Note that a total of 1.4 Giga-ton CO2/year can be saved with negative cost. The total emission of the USA now is about 7 Giga-ton CO2/year, so the actions shown here are a substantial fraction of the total emissions (as shown by the red arrow near the bottom). The point is not only that we can save CO2 emissions and money, but also that there are career opportunities in these type of environmentally friendly steps. When these steps lead to cost savings, a market will emerge for these activities. When talking to students it is worthwhile to stress this point, because young people are looking for career opportunities, especially when these also help the world. Also, it is worthwhile to point out that energy-saving activities are increasingly attractive as fuel prices rise.
- Let’s now return to CO2 injection in the subsurface (also called sequestration). This cartoon sketches the process of injecting of CO2 in the subsurface. The CO2 will come from concentrated sources, such as power plants, because capturing CO2 from mobile sources such as cars or planes is not practical. The CO2 must be injected deeper than 1 km. At that depth the pressure is so large that CO2 is a liquid rather than a gas. We must store CO2 in liquid form, otherwise there is not enough storage space to store CO2 for, say, the next century. Remember how much CO2 we must store to make a difference? One wedge is 3 Giga-ton of CO2/year. This is about 1/8th of the current CO2 emissions. This amount is comparable to the current world oil production. Remember that one wedge is only one of the 6 steps needed to prevent the CO2 concentration to rise above twice the pre-industrial level. This means that CO2 sequestration is a massive operation if it is to make a difference. Technologically we can sequester the CO2, but the main problem is cost. Currently is costs about 50 $/ton to capture and sequester CO2. For 3 giga-ton per year this means an expense of 150 billion dollars per year. This is a lot of money, but let’s compare it to what we spend on oil. The amount of CO2 of sequester is about the same as the oil that we produce. For oil we now spend about 100 $/barrel = 500 $ /ton. This is ten times as much as the cost for CO2 sequestration. So we need to invest 10% of our current cost for oil to sequester one wedge of CO2. Research may bring down this price. Covering the costs of CO2 sequestration can be done, but it will take huge political will to make this happen.
- This is the Sleipner platform in the North Sea, which is often presented as one of the successes in CO2 sequestration. This platform is used to produce natural gas. Together with the gas, CO2 comes out off the well. The CO2 is separated from the natural gas and is ten injected back into the reservoir. This platform injects about 1 Mega-ton of CO2/year. This may seem like a large amount, but it is a drop in the bucket compared to the amount needed for one wedge (3 Giga ton/year). We need about 3500 of these platforms to inject the CO2 needed for one wedge. Of course, injection on land would be simpler, and this is probably where most of the CO2 will be sequestered. Clearly this is an expensive undertaking, the economics of this process, as well as the political will to tax consumers of hydrocarbons for this effort are essential for taking this to the large scale needed for making an impact.
- To inject 3 Giga-ton CO2/year we need a comparable infrastructure as we now have for petroleum extraction. This is a satellite image of Kuwait. The oil fields are visible below the blue arrow, and span a distance of about 20 miles. If we inject CO2 in the subsurface, we will need to build a comparable infrastructure to make this happen. Reducing the price of CO2 sequestration will help increase our ability to do this on a large scale. This is one of those examples where research can help make an expensive project more attractive by helping to reduce cost.
- This is an example how research may help bring down the cost of carbon sequestration. Separating the CO2 from the air (carbon-capture) is a large fraction of the total cost. Membranes are being developed at GCWP for more efficient gas separation. This technology can be used to separate CO2 from air. Another potential application is the separation of hydrogen from air. There has been much talk of the hydrogen economy. There is one problem …… we have no hydrogen “mines.” Most hydrogen produced today is formed from natural gas (methane) by stripping the hydrogen off the methane, and the carbon ends up as CO2. We would like to produce hydrogen from hydrocarbons without producing CO2. The picture shows a membrane that is use to separate the hydrogen from the CO2. The CO2 can then be injected into the subsurface.
- It is important to empower the audience and give them ideas what they can do. The next slide discuss “What can I do as an educator, student, consumer, businessman, citizen?” This is a quote for educators that usually makes an impression on educators (like me). It stresses that education is important for making informed decisions. This certainly applies to the way we use energy. This is exactly the reason why it is so useful to present this lecture.
- The public is not very energy-literate, and indeed, it is often is difficult to come to grips with the numbers involved, especially since so many different units are used. Yet, some simple questions can give great insight. Ask the question in the slide to the audience. As a hint you can tell them that the coal in each car weighs 100 ton. Many people think the answer is “a few gram,” thinking that since CO2 is a gas, it is light. Here is the answer: about 300 ton! The coal is mostly carbon (forget the hydrogen). Every carbon atom gets tied to two oxygen atoms. Since oxygen and carbon have about the same weight, the coal becomes three times as heavy after it is burned. This mass is released as a gas into the atmosphere. You can do a similar exercise by computing the CO2 produced by driving a car for a mile. The answer is about 20 ounce per mile. (20 miles/gallon -> 1/20 gallon per mile = 4/20 kg gasoline per mile. This gives 3 times 4/20 = 0.6 kg / mile = 20 ounce/mile). This number usually truly amazes the audience and drives the message home that our actions do matter.
- We need education to drive efficiency and conservation. When we turn on the television at night, which I do not recommend, we are told every 15 minutes that we are not a real guy if we don’t have a beautiful machine as shown here. Education is truly needed to provide a balance to the “information” that is served in massive quantities on television that prompts us to consume more.
- The book “Energy and American sociey - thirteen myths” is very interesting. The public largely believes in 13 yths about energy, without understanding the facts. Above are listed some myths. Let’s discuss them briefly: Today’s energy crisis is a hype. As shown earlier in this presentation, there is real reason to believe that the energy system is being stressed, and that this is only likely to become worse in the future. The facts and data speak for themselves, but one must, of course, be informed to be able to use this information. This brings us to the next myth. The public is well informed about energy. Many people believe the public is aware of the way our energy system works. This clearly is not the case. Presenting this lecture is a great way to discover what the public is not aware of. The hydrogen economy is a solution. The hydrogen economy was presented in the State of the Union speech of President Bush as a silver bullet for our energy problems. There is only one problem …… there are no hydrogen deposits. Hydrogen produced now comes mostly from natural gas where the hydrogen is stripped off the carbon. In this case one is off better by directly using the natural gas. Hydrogen can be formed by splitting water by electricity. If this electricity comes from a coal-fired power plant, with an efficiency of 35% this does not make sense. When electricity is used that comes from solar, wind, from geothermal energy, or from nuclear power, then it may make sense to produce hydrogen. Iceland uses geothermal energy to generate electricity that is used to produce hydrogen from water. Efficiency improvements have reached their potential. We discussed this earlier in this presentation. We waste about 60% of the energy consumed. The McKinsey study shows how much more we can do now and save money in the process. Climate policy will bankrupt the US economy. The McKinsey study shows that this is not the case. Here is a question to consider. With the dollar as low as it is, this is great time for the USA to export cars to Europe. Why don’t we send shiploads full of cars to Europe. The reason is simple … Europeans don’t want our cars because they use too much fuel. The Toyota Prius was designed to use less fuel and thus be environmentally less damaging than conventional cars. It is a great commercial success for Toyota. World-wide power systems are optimal. Many believe that we have optimized the way in which we use energy. This is not the case. For example, 10% of the electricity in the USA is lost by long-distance transmission. Decentralized electricity generation would reduce those losses. There are, of course, reasons why centralized electricity generation is attractive, but it is not from the point of view of energy conservation.
- Here is an action item for educators. This Presidents Climate Commitment can be signed by presidents of colleges and universities. By doing so, presidents commit themselves to develop an action plan to develop a carbon neutral plan as a long-term goal, to choose a few short-term actions that contribute directly to this goal, and to communicate this initiative across campus. As educator you can bring this opportunity under the attention of your administration, and push for its acceptance.
- The choices that we make as consumer have consequence. Whenever we buy something, we have a choice between different alternatives, often with a different energy efficiency. Do we buy and energy-efficient product, or do we buy one that uses more energy? When we travel or commute, we may have choices what mode of transportation we use. These moments of choice present an opportunity to make a difference by choosing the energy-efficient option. This not only saves energy, it also sets an example for others. Here are some examples of a difference we can make. Changing light-bulbs makes a difference. (Although it should not lull us into complacency that we have done all that we can do.) When purchasing a car, look at the mileage of the car you consider. There is a huge difference in the mileage between different vehicles. In general, the heavier the car, the more energy it uses. (Kinetic energy is half m v-squared! The key symbol is the mass m, the heavier the car, the more energy it takes to get it moving.) Look for energy ratings on appliances. Let energy be a factor when making decisions what to buy (and what to refrain from buying)!
- Shown here are bottles with bottled water. You would not want to drink this water, because there is oil floating on top of the water in each bottle. The amount of oil shown is the amount of oil used to produce the bottle, and to transport the bottled water to consumers in the USA. Much of that oil is used for transportation. The bottle on the left is from water produced in the USA, the bottles on the right are for water coming from Europe and New Zealand, respectively. Bottled water that is transported over greater distances requires, of course, more energy. But why would you drink bottled water. Water in the USA is safe to drink, and a re-usable bottle allows you to drink fresh water that chemically is identical than water that is bottled in disposable bottles and which is transported over great a great distance. Using your own re-usable bottle works just as well and saves much money (along with much energy). Website with a description how oil is used for bottled water: http://www.sustainablehydration.com/water_environment.html
- Buildings can be made much more efficient. Shown is the Kirsch Center at DeAnza Community College in California. This building was built at the same cost as a conventional building, but uses 35% of the energy. The savings per year are $65,000/year, this. I have taught in this building; it is a pleasant building to work in. Since it also serves as showcase for environmentally building techniques, much of the internal structure is made visible (lower right figure). Different groups of students are responsible for managing the energy in the building; this gives students an ownership of the building and makes them aware of a connection between their actions, for example by switching off lights, and the energy used. There is money to be made in designing and constructing buildings like this, and money to be saved by using this technology. With increasing energy-prices, buildings like this become even more attractive from a financial point of view. Note that designs like used in this building cannot only be used for large buildings, similar technology is available for residential buildings. The cost savings of such buildings mean that there are career opportunities in designing such buildings. With a tight energy market, the demand is likely to increase. For more information about the Kirsch Center see: http://www.deanza.edu/kirschcenter/
- It is a good idea to be informed. Here is an example. Plug-in vehicles sounds great. It is often said that such vehicles produce no emissions!
- But one cannot just look at the vehicle. Where does the electricity that drive the vehicle come from? If it comes from a coal-fire power plant, the emissions may be larger than when the car would burn gasoline.
- On the other hand, when the electricity comes from renewable sources, such as this windmill, then it can be a great way to store renewable energy in the car’s battery and use it for driving the car later. The upshot is that we need to be honest in considering the environmental sum of our actions. It is often difficult for consumers to assess the total impact of their choices. Being informed and critical, though, is the first step.
- This pie-graph shows the US Greenhouse Gas emissions for 2005 divided in different kinds of use. The largest sector is the production of goods and materials. This source of emissions can be reduced by recycling. For example, the production of aluminum is an electrochemical process that takes up much energy. Recycling cans simply involves melting the can. Recycling helps cut down the energy used for goods and materials.
- As a student you have career choices to make. Ask yourself the question how you can make a difference creating a sustainable future. This can be done from many different professions. If you want to contribute to society you need to be a professional. Many different professions leave room for making a difference. For example, as an architect you can design conventional buildings, or you can design energy-efficient buildings. The reality is that most times we don’t know how our lives will unfold, and even if we do think we know, something may happen that changes our path. What we all can do, however, Is to put our minds to choosing for solutions that help sustainability. When we do this consistently, it will translate into our actions, and in the long-term it will give shape to our careers. One way to start this process during your education is to seek projects that help you develop ideas and to become involved. The image above shows a building design by Architecture students at Clemson University in a project for a carbon-neutral campus. By participating in a project like this, you not only help build an energy-saving solution that is of direct benefit, but participating in projects like this gives an opportunity to learn about new opportunities and it helps to discover what you like and what you dislike. This helps making better-informed career choices. Of course, as a student you can push for energy conservation at your school or university, at home, or with friends. You don’t have to be one of the official decision-makers to be a difference.
- It can be useful to seek out projects that help forming a better impression of career opportunities, and of how you fit into such opportunities.. Career choices are difficult, and your likes and dislikes are often formed by trying out things. As a student, projects and internships can be great ways to figure out where your heart lies and how you can help make a difference. An example is a neat project is shown in the image. The car shown runs on hydrogen and is designed by students at Phoenix Central High School (http://community.uui.asu.edu/features/solar.asp). The car converts sunlight into electricity, this is used to split water to create hydrogen, which drives the car through a fuel cell and an electromotor. This is not the car of the future, but participating in a project like this is a great way to build up experience and learn about technology, but also to discover what you like!
- Whatever your business is, there are choices to make that influence our energy use. The picture on the lower left is an energy-efficient house that is constructed. Note that car-tires are used for the foundation. The owner of the company that builds this type of houses (Dan Chiras) claims that he has not paid a residential electricity bill in five years because he is not connected to the power-grid anymore. Even when your business is not related to energy, you are likely to save money by making an energy plan. There are companies that can do an energy audit and give advice. We are living in a time of a rapidly rising cost energy from fossil fuel. Use your imagination and think of what business opportunities open up when we start using other energy sources, or when energy efficiency becomes economically even more attractive. Business opportunities change in a changing world, and in fact, the change towards a more efficient energy system offers new business opportunities in itself. There are conferences now on business opportunities in sustainable energy.
- As we saw earlier, there is a discrepancy in the projected growth of energy and the impending decline in our major source of energy, oil. This raises the question “what is the plan?” As citizens we should ask our leaders to develop a realistic and sound energy-plan. What we all can do is start a discussion in our community about our energy use. Service clubs and churches are often interested to host speakers on this topic. (You can use this power-point presentation.) Perhaps the local school is interested to do devote a class or special event to energy. And of course, we all meet people, energy may come up in a natural way in a conversation. You can use this to help increase the energy-awareness of others. The USA is seen by many countries as a role model. Our country has great talent, it has capital for innovation, and perhaps most importantly, its population is energetic and willing to make changes. When President Kennedy announced in the 1960’s that America would put a man on the moon, it happened only seven years later when Neil Amstrong stepped down on the moon. Our country can do great things, but ….. we have to put our minds to it. The United States could be a world leader in the responsible use of energy, but currently it is a follower and a lead-waster of energy. We can change this ….. If we choose to do so. I put the quote of Emerson at the bottom because much of the rest of world still looks up to the USA and sees our country as an example. What sort of role-model do we set for the rest of the world?
- So what if we had the courage to dream? If we would raise fuel standards to that of European cars, we could save 25% on our use of petroleum. What if we would generate 20% of electricity from wind? Denmark can do this, and there is no reason that the USA cannot do this. And what if we would generate another 20% of electricity from sunlight? And saving 20% energy by increased efficiency can be done even without changing out lifestyle. Remember the example of the Kirsch Center? That building saved 65% of the used energy! These steps together would make a big difference, and they could be may without reducing our quality of life. (In fact, they may increase our quality of life because of reduced spending on energy and having a cleaner environment.) We only need to decide that we are going to take this path. At the bottom is a quote from John Hess, CEO of Hess corporation. His point is that we HAVE to change the way we use energy if we want to have sustained economic growth. This statement does not come from an environmental activist, but from the CEO of a petroleum company. So here is key question. Do we wait with changing until external circumstances force such change upon us, or do we take charge by initiating this process of change now?
- We certainly do face a challenge in our energy supply. Every challenge comes with new opportunities. I am an optimist and think we can use these opportunities to create a better world. But being an optimist does not preclude being a realist. We have to be aware of the facts, and respond to them in an intelligent and inspired way. If we do so, we can turn the energy challenge into an opportunity for growth in many different ways. I value the feedback of you and your audience in communicating this material more effectively, please use the email address to send me such feedback. Feel free to use this presentation, the link at the bottom states where it can be downloaded. Also, feel free to modify the presentation depending on your views, the audience, and the time available. Notes are included in the presentation to explain the content of the slides and ot give ideas to speakers.