

Recomendados
Recomendados
Mais conteúdo relacionado
Destaque
Semelhante a Spain is not greece
Semelhante a Spain is not greece (15)
Mais de Jose Miguel Durán
Mais de Jose Miguel Durán (14)
Spain is not greece
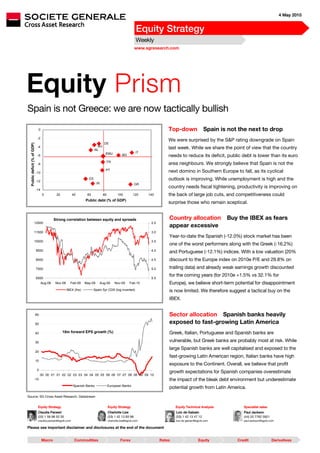
- 1. 4 May 2010 Equity Strategy Weekly www.sgresearch.com Equity Prism Spain is not Greece: we are now tactically bullish 0 Top-down Spain is not the next to drop -2 We were surprised by the S&P rating downgrade on Spain DE Public deficit (% of GDP) -4 AU NL last week. While we share the point of view that the country EMU IT -6 BG needs to reduce its deficit, public debt is lower than its euro FR -8 area neighbours. We strongly believe that Spain is not the PT next domino in Southern Europe to fall, as its cyclical -10 -12 ES outlook is improving. While unemployment is high and the IR GR country needs fiscal tightening, productivity is improving on -14 0 20 40 60 80 100 120 140 the back of large job cuts, and competitiveness could Public debt (% of GDP) surprise those who remain sceptical. Strong correlation between equity and spreads Country allocation Buy the IBEX as fears appear excessive 12500 2.5 11500 3.0 Year-to-date the Spanish (-12.0%) stock market has been 10500 3.5 one of the worst performers along with the Greek (-16.2%) 9500 4.0 and Portuguese (-12.1%) indices. With a low valuation (20% 8500 4.5 discount to the Europe index on 2010e P/E and 29.8% on 7500 5.0 trailing data) and already weak earnings growth discounted for the coming years (for 2010e +1.5% vs 32.1% for 6500 5.5 Aug-08 Nov-08 Feb-09 May-09 Aug-09 Nov-09 Feb-10 Europe), we believe short-term potential for disappointment IBEX (lhs) Spain 5yr CDS (log inverted) is now limited. We therefore suggest a tactical buy on the IBEX. 60 Sector allocation Spanish banks heavily 50 exposed to fast-growing Latin America 40 18m forward EPS growth (%) Greek, Italian, Portuguese and Spanish banks are 30 vulnerable, but Greek banks are probably most at risk. While large Spanish banks are well capitalised and exposed to the 20 fast-growing Latin American region, Italian banks have high 10 exposure to the Continent. Overall, we believe that profit 0 growth expectations for Spanish companies overestimate 00 00 01 01 02 02 03 03 04 04 05 05 06 06 07 07 08 08 09 09 10 -10 the impact of the bleak debt environment but underestimate Spanish Banks European Banks potential growth from Latin America. Source: SG Cross Asset Research, Datastream Equity Strategy Equity Strategy Equity Technical Analysis Specialist sales Claudia Panseri Charlotte Lize Loic de Galzain Paul Jackson (33) 1 58 98 53 35 (33) 1 42 13 83 98 (33) 1 42 13 47 12 (44) 20 7762 5921 claudia.panseri@sgcib.com charlotte.lize@sgcib.com loic.de galzain@sgcib.com paul.jackson@sgcib.com Please see important disclaimer and disclosures at the end of the document Macro Commodities Forex Rates Equity Credit Derivatives
- 2. Equity Prism Contents 3 Asset allocation by sector 0 4 Investment summary 1H 5 Spain is not Greece: we are now tactically bullish 2H 5 Why Spain has been underperforming Italy and Ireland… 3H 5 …while Spanish bonds have been more resilient? 4H 7 Spain’s economic situation not as bad as feared 5H 9 PIIGS market structure penalises market performance 6H 10 Consensus forecasts already discount the worst… 7H 11 …but fail to reflect potential benefits of Latin American exposure 8H 12 Spain’s valuation discounts a very bleak environment 9H Tables index Charts index 3 European recommended sector allocation 10H 4 Valuation closes at the 20y bottom 16H 9 Sector breakdown for PIIGS countries 1H 5 Why should Spain underperform Italy and Ireland? 17H 10 IMF gross domestic product expectations (%, constant prices) 12H 6 Spanish CDS spreads have been unaffected 18H 10 IBES EPS growth expectations (%) 13H 6 10y bond yield spread to German yield 19H 11 Spanish companies with sales exposure to Latin America of above 10% 14H 7 Greek consumers likely to be hard hit by fiscal tightening 20H 12 IBES P/E forecasts (x) 15H 7 Greece has the highest public debt, but Ireland and Spain show the 21H steepest deterioration 8 Harmonised competitiveness indicators (ULC-deflated) 2H 8 France’s public debt is higher than Spain’s! 23H 9 IBEX 35 – lack of pharma, tech and consumer goods 24H 9 Banks are penalised by contagion fears 25H 10 While EPS growth is largely below the European average… 26H 10 …sales growth is slightly above 27H 11 Long-term earnings growth (%) – Spain more resilient to the downside 28H 12 P/E multiples discount Spain’s bleak environment 29H 12 Now valuation is close to the bottom seen back in 1992 30H 2 4 May 2010
- 3. Equity Prism Asset allocation by sector European recommended sector allocation MSCI Last Changes New SG Premium List % recommendation today recommendation Oil & Gas 10.9 OVERWEIGHT Integrated Oil Companies 10.1 Overweight Royal Dutch Shell Oil Services 0.8 Neutral Basic Industries 9.7 OVERWEIGHT Chemicals 3.0 Overweight BASF Construction Materials 0.9 Overweight Containers & Packaging 0.0 Neutral Steel, Metals & Mining 5.4 Neutral ArcelorMittal Paper, Packaging 0.3 Overweight Industrials 10.0 OVERWEIGHT Aerospace & Defence 0.9 Neutral Construction 1.5 Overweight Saint Gobain Capital Goods 5.4 Overweight Vallourec, Volvo Transportation & Other services 2.1 Overweight Fraport Consumer Discretionary 7.4 OVERWEIGHT Automobiles & Components 1.8 Overweight Daimler Durables, Apparel & Luxury 1.5 Neutral Hotels, Restaurants & Leisure 0.8 Overweight Accor, Compass Group Media 1.9 Overweight Reed Elevier Plc Retailing (general) 1.2 Neutral Kingfisher Consumer Staples 12.0 NEUTRAL Food & Staples Retailing 2.1 Overweight Beverages 2.3 Neutral Food 4.8 Underweight Tobacco 1.5 Underweight Household & Personal Care 1.1 Neutral Healthcare (includes Pharma) 10.1 UNDERWEIGHT Fresenius Medical Care Financials 23.7 NEUTRAL Commercials Banks 13.3 Neutral Investment Banks 4.2 Neutral Barclays Insurance 5.1 Overweight ING, Swiss Life Real Estate 0.9 Neutral Information Technology 2.9 OVERWEIGHT Software & IT Services 1.0 Overweight SAP Technology Hardware & Eqpt. 1.5 Neutral Semi-conductors 0.4 Overweight Telecommunication Services 6.7 UNDERWEIGHT Diversified Telecom 4.7 Underweight Wireless Telecom 1.9 Underweight Utilities 6.0 NEUTRAL Source: SG Cross Asset Research 4 May 2010 3
- 4. Equity Prism Investment summary Spanish fixed income more resilient than equities The widening gap between euro area and US growth coupled with concerns about a potential eurozone break-up should continue to exert pressure on the euro area. That said, notwithstanding rising pessimism on the eurozone, we strongly believe that some countries in the region remain attractively valued (we are already Overweight on Germany). While the risk of fiscal tightening looks extremely high in Portugal, Italy, Ireland, Greece and Spain (PIIGS), we believe that after its recent underperformance, the Spanish index is attractively valued and is set to outperform other PIIGS in the short term. The relative resiliency of the Spanish bond market (both corporate and government bonds) also points to a probable over-reaction from equities investors compared with fixed income investors. Spain’s economic situation not as bad as feared Spain is in a difficult public deficit position (-11% versus the GDP), which is deteriorating quickly. While we do not want to minimise the situation as unemployment is very high (19.4%) and restructuring will take time, Spain has already undergone 18 months of painful economic adjustment. The near-term outlook for the economy is admittedly bleak. Economic activity will likely stagnate this year, as fiscal policy tightens. But beyond 2010, the country should at least match the eurozone’s average growth rate (IMF 2012 GDP forecasts: 1.5% vs 1.8% for the euro area). Initial signs are encouraging as labour market adjustments have helped to boost labour productivity and cut unit labour costs, restoring some of the competitiveness that had been lost. More needs to be done, but this is a positive development . 0F0F 1 Spanish profit growth discounts sovereign risk but not Latin American demand According to IBES forecasts, Spanish 2010-2012e profits growth is the lowest within the euro area and stands even below that expected in Greece. We strongly believe that consensus forecasts are overestimating the impact of debt on the Spanish financial system (financial stocks represent 32.8% of the IBEX’s market cap) and underestimating potential growth from Latin America. While Italian, Portuguese and Spanish banks are vulnerable, Greek banks are probably most at risk. And while large Spanish banks are well capitalised and exposed to the fast-growing Latin American region, Italian banks have high exposure to the Continent, with loan coverage well below the mean. We are tactically bullish on Spain While Latin America is growing faster than the rest of the world, Spain’s multiples are trading at a discount to the European average. Spain’s debt situation is worrying indeed; but Valuation closes at the 20y bottom we also believe that Spanish companies’ high 50% 40% Historical Spanish P/E discount to cash flow profiles and savings rates should 30% European average help large caps in the event of a severe fiscal 20% 10% tightening policy. Therefore, with the Spanish 0% -10% market trading at a 29.8% discount to the -20% -43% -29.8% European average (the bottom was 43% in -30% -40% 1992), we are tactically buyers of the IBEX. -50% 90 91 92 93 94 95 96 97 98 99 00 01 02 03 04 05 06 07 08 09 10 Source: SG Cross Asset Research 1 For more details please refer to page 69 of SG Global Economic Outlook dated 13 April 2010 “Reshuffling balances” and to the SG Economics report dated 22 April 2010 “No time for a Greek holiday” 4 4 May 2010
- 5. Equity Prism Spain is not Greece: we are now tactically bullish Since the beginning of the year, alpha generation has mainly come from country allocation more than sector allocation. In our latest calls “Want to hedge euro sovereign 31H risk? Buy the DAX, stay Neutral on Banks” (13 April) and “Buy UK stocks on devaluation 32H fears” (20 April), we suggested taking advantage of rising fears about European sovereign risk by building strategic positions (long-term) on the weakness of the euro or the sterling versus the dollar. Today’s call is a tactical one and the rationale behind it is based on our premise that last week’s market reaction on Spain is excessive. Sovereign risk remains the main concern for equity markets, especially after S&P slashed Greece’s credit rating by 3 notches to BB+ with a negative outlook, Portugal’s long-term debt by 2 notches to A- and Spain’s to AA with a negative outlook. However, we believe that this environment offers some good buying opportunities, and Spain offers one of the best in our view. Why Spain has been underperforming Italy and Ireland… Why should Spanish equity markets underperform Italy and Ireland when both of the latter have similar debt profiles and less resilient banking systems? Since the beginning of the year the IBEX has strongly underperformed the DAX, which is perfectly rational considering the difference in those countries’ debt, deficits and market structures. What seems odd is that while sovereign risk is also worrying for Ireland and Italy, these two countries are performing better than the Spanish stock market. Why should Spain underperform Italy and Ireland? 115 ASE (Greece) IBEX (Spain) 110 MIB (Italy) PSI20 (Portugal) 105 ISEQ (Ireland) 100 95 90 85 80 75 Jan-10 Feb-10 Mar-10 Apr-10 Source: SG Cross Asset Research …while Spanish bonds have been more resilient? Spanish fixed income assets and corporate and government bonds have been more resilient than Portugal’s and as resilient as Italy’s. As explained by our economists in their report “No 3H time for a Greek holiday” published on April 22, while Ireland, Portugal and Spain face very different situations relative to Greece, their level of deficits and debt put them under pressure. Any threat of a potential default by Greece would immediately raise concerns over the sustainability of fiscal deficits in Ireland, Portugal and Spain. Concerns over Italy are more subdued. Despite a debt-to-GDP ratio of over 115%, Italy has maintained a fairly tight grip on 4 May 2010 5
- 6. Equity Prism its finances throughout the crisis, and as a result, its deficit reached only 5.3% in 2009. The underlying position of Italy’s public finances therefore looks under control. Only a modest effort will be necessary to stop the debt ratio from increasing again. While Spain has seen the steepest deterioration in the last year, it is protected by its history of managing sound fiscal policies pre-crisis and also by its size relative to its two European neighbours. This gives Spain a broader tax base and more diversified economy, which should make it easier to increase tax revenues if the need arises. Spanish CDS spreads have been unaffected 1400 1200 Portugal 1000 Greece 800 Spain 600 Italy Ireland 400 200 0 Sep-09 Oct-09 Nov-09 Dec-09 Jan-10 Feb-10 Mar-10 Apr-10 Source: SG Cross Asset Research Also, the spread between Spain and Germany’s 10-year bond yields has increased, but has been more resilient than in the case of Portugal and Ireland and in line with the Italian spread. 10y bond yield spread to German yield 800 Spanish spread Greek spread Italian spread 700 Irish spread Portuguese spread 600 500 400 300 200 100 0 Apr-08 Jul-08 Oct-08 Jan-09 Apr-09 Jul-09 Oct-09 Jan-10 Apr-10 Source: SG Cross Asset Research 6 4 May 2010
- 7. Equity Prism Spain’s economic situation not as bad as feared We have already written more than once that the debt situation in the eurozone looks increasingly worrisome and that the widening gap between euro area and US growth coupled with concerns about a potential eurozone break-up should continue to exert pressure on the euro. That said, notwithstanding rising pessimism on the eurozone, we strongly believe that the region remains attractively valued – some countries more than others, and tactical calls may help to generate profits. The Greek risk/reward profile looks less appealing as stringent fiscal policy will be required to reduce the debt burden. Of course the risk of fiscal tightening looks extremely high in Greece, Spain, Italy and Portugal, but high saving rates in Spain and improving productivity may be a cushion for the country. Greek consumers likely to be hard hit by fiscal tightening 30.0 Euro area 25.0 France 20.0 Italy Germany 15.0 UK 10.0 Portugal Spain 5.0 Greece 0.0 Ireland 1995 1996 1997 1998 1999 2000 2001 2002 2003 2004 2005 2006 2007 2008 2009 Source: SG Cross Asset Research Spain is in a difficult position, and the situation is deteriorating quickly. While we do not want to minimise the situation as unemployment is very high and restructuring will take time, Spain has already undergone 18 months of painful economic adjustment. The current account deficit in relation to GDP has more than halved to 4.6% from its peak in 2008, when in absolute terms it was the second highest in the world after the US. Greece has the highest public debt, but Ireland and Spain show the steepest deterioration 30% 140.0 2009 2010e 2011e 2009/2010 changes (%) Public Debt (% of GDP) 120.0 25% 100.0 20% 80.0 15% 60.0 10% 40.0 5% 20.0 0% 0.0 Ireland Spain UK Portugal France Greece Eurozone Germany Italy Source: SG Cross Asset Research 4 May 2010 7
- 8. Equity Prism The near-term outlook for the economy is admittedly bleak. Economic activity will likely stagnate this year, as fiscal policy tightens. And the economy is unlikely to regain its status as the fastest growing of the big four EC members anytime soon, as the country grapples with its structural problems. But beyond 2010, Spain’s growth should at least match the eurozone average growth rate. Initial signs are encouraging as labour market adjustments have helped to boost labour productivity and cut unit labour costs, consequently restoring some of the competitiveness that had been lost. More needs to be done, but this is a positive development that should be recognised. In addition, the current account deficit has effectively been cut in half, from 10% of GDP at the peak. This was not just the result of weak imports, but also of an above-average export recovery. The Spanish economy appears to be re-orientating itself towards exports. Lastly, although not yet complete, the excessive share of construction in the economy has shrunk. Harmonised competitiveness indicators (ULC-deflated) 120 Spain 115 110 Italy 105 France 100 95 Germany 90 85 1995 1997 1999 2001 2003 2005 2007 2009 Source: ECB, SG Cross Asset Research The budget shortfall is beginning to roll over, a reduction plan is in place and the public debt- to-GDP ratio is 60%, barely more than half the Greek ratio. Most importantly, the inflation rate has converged with the eurozone average, one of many indicators confirming the decade-long adjustment to membership of the currency club is complete. France’s public debt is higher than Spain’s! 0 -2 DE -4 AU Public deficit (% of GDP) NL EMU IT -6 BG FR -8 PT -10 ES -12 IR GR -14 0 20 40 60 80 100 120 140 Public debt (% of GDP) Source: SG Cross Asset Research, SG Global Economic Research 8 4 May 2010
- 9. Equity Prism PIIGS market structure penalises market performance What has particularly penalised the IBEX relative to other PIIGS markets is its market structure. For example, relative to the Irish Index (ISEQ), which accounts for 38.8% of industrials benefiting from the weakness of the euro, the IBEX is mainly based on banks and telecoms, which have been the main underperformers of this first part of the year. Relative to the Italian Index, the IBEX has been underperforming because it has less exposure to the Oil & Gas sector, usually resilient in a negative market. Sector breakdown for PIIGS countries PSI 20 MIB 40 ISEQ Athex 20 IBEX 35 DJ Stoxx 50 Basic Materials 4.2% 5% 2.0% 1.1% 10.8% 8.0% Consumer Goods 0.0% 8.6% 18.2% 14.7% 0.5% 14.0% Consumer Services 13.1% 3.2% 17.7% 10.8% 7.3% 2.6% Financials 15.2% 33.5% 9.0% 47.1% 32.8% 28.9% Health Care 0.0% 0.0% 8.4% 0.0% 0.4% 3.6% Industrials 13.2% 6.7% 38.8% 5.7% 8.7% 7.9% Oil & Gas 16.3% 21.6% 5.7% 6.9% 5.0% 9.8% Technology 0.0% 1.7% 0.1% 0.0% 0.5% 4.4% Telecommunications 12.7% 3.8% 0.1% 8.2% 16.1% 9.4% Utilities 25.3% 16.1% 0.0% 5.5% 17.9% 11.4% 100.0% 100.0% 100.0% 100% 100% 100% Source: SG Cross Asset Research, Datastream As previously mentioned, both the Spanish and the Italian indices are mainly composed of financials stocks. The difference between the two banking systems is that while large Spanish banks have their difficulties, they are well capitalised and their assets are heavily tilted towards the fast-growing Latin American region. In contrast, Italian banks have high exposure to the Continent. IBEX 35 – lack of pharma, tech and consumer goods Banks are penalised by contagion fears 40.0% 3000 100 30.0% 2800 120 IBEX 35 DJ Stoxx 50 2600 140 20.0% 160 2400 10.0% 180 2200 0.0% 200 Consumer Goods Telecommunications Consumer Services Technology Oil& Gas Basic Materials Industrials Financials Utilities Health Care 2000 220 1800 Greece stock index (lhs) European Financials credit spread (inverted rhs) 240 1600 Jul-09 Sep-09 Nov-09 Jan-10 Mar-10 Source: SG Cross Asset Research 4 May 2010 9
- 10. Equity Prism Consensus forecasts already discount the worst… The IBES figures highlight something which appears particularly odd: why are Greek companies expected to grow more than Spanish companies over the next three years? According to the IMF’s GDP growth forecasts, Greece should remain in recession for the next two years, while Spain, after this year’s negative economic growth, should enjoy a recovery in 2011. Does this mean that analysts are underestimating the potential for a rebound? IMF gross domestic product expectations (%, constant prices) 2008 2009 2010e 2011e Greece 2.02 -1.96 -2.00 -1.05 Ireland -3.04 -7.10 -1.55 1.94 Italy -1.32 -5.04 0.84 1.16 Portugal 0.04 -2.68 0.29 0.65 Spain 0.86 -3.64 -0.41 0.90 Source: SG Cross Asset Research, International Monetary Fund, World Economic Outlook Database, April 2010 IBES EPS growth expectations (%) 2009 2010e 2011e 2012e Spain -10.0 1.5 13.6 11.6 Italy -41.3 17.4 28.2 15.8 Ireland -152.1 na na 256.1 European average -23.1 32.1 22.1 12.8 Greece -41.8 6.1 27.6 19.4 Portugal 10.5 -5.0 17.7 14.0 Source: SG Cross Asset Research Even though bottom-line forecasts are far below the European average, top-line forecasts are slightly above the European market. The problem is that Spanish operating leverage is low, consistent with a structure based on Utilities and Telecoms, which have a high proportion of fixed to flexible costs and therefore more capital intensity than the European average. While EPS growth is largely below the European average… …sales growth is slightly above 35 12 12m forward Sales growth (%) 12m forward EPS growth (%) 30 10 25 8 Spain Europe 20 6 15 4 10 2 5 0 0 -2 Spain Europe -5 -4 -10 -6 04 05 06 07 08 09 10 04 05 06 07 08 09 10 Source: SG Cross Asset Research 10 4 May 2010
- 11. Equity Prism …but fail to reflect potential benefits of Latin American exposure While we are negative on Spanish growth, we believe that upside could potentially be stronger for Spanish companies than for Greek or Portuguese companies, as Spain’s profit growth is driven by Latin American demand. As Latin America is expected to grow more than developed countries (SG 2010e forecasts: real GDP 4.0% vs 2.2% for developed countries on average), and Spanish large caps usually benefit from Latin American demand, we believe that profits growth is underestimated at least for the next two years. The table below shows that a significant portion of the IBEX index (Santander, BBVA and Telefonica account for 51% of the index) is heavily exposed to Latin America in terms of sales. Even though demand from Latin America is strengthening, profit forecasts do not take this stabilising factor into account, a factor which played a major role during the recession and makes the country’s earnings growth profile asymmetric relative to the rest of the Europe. Spanish companies with sales exposure to Latin America of above 10% Latin American exposure as a % of Local exposure as a % of 2008 sales 2008 sales Repsol 42% 48% BBVA 41% 35% (including Portugal) Banco Santander 41% 27% Prosegur Cia de Seguridad 37% 49% Endesa 37% 58% (including Portugal) Sol Melia 33% 49% Mapfre 33% 59% Cie Automotive 32% 68% (Europe) Amper 32% 68% Abengoa 25% 35% Gas Natural 24% 63% Sniace 20% 66% Telefonica 20% 36% Inypsa Informes 17% 64% OHL 15% 49% Iberdrola 14% 46% Promotora de Informationes 14% 86% (Europe) Viscofan 13% 58% (Europe) Aguas de Barcelona 13% 83% Faes Farma 10% 90% (including Portugal) Indra Sistemas 10% 66% Source: SG Cross Asset Research Long-term earnings growth (%) – Spain more resilient to the downside 60 50 40 30 20 10 0 -10 -20 Europe Spain -30 -40 90 91 92 93 94 95 96 97 98 99 00 01 02 03 04 05 06 07 08 09 10 Source: SG Cross Asset Research 4 May 2010 11
- 12. Equity Prism Spain’s valuation discounts a very bleak environment While Latin America is growing faster than the rest of the world, Spain’s multiples are trading at a discount to the European average. While the Spanish debt situation is worrying, we also believe that Spanish companies’ high cash flow profiles and saving rates should help large caps in the case of a severe fiscal tightening policy. IBES P/E forecasts (x) 2009 2010e 2011e 2012e Spain 11.0 10.8 9.5 8.5 Italy 15.0 12.8 10.0 8.6 Ireland na na 37.2 10.4 European average 17.0 13.0 10.6 9.4 Greece 10.2 9.6 7.6 6.3 Portugal 12.7 13.4 11.4 10.0 Source: SG Cross Asset Research Therefore, considering that the Spanish market is trading at a 29.8% discount to the European average (the bottom was 43% in 1992), we are tactically buyers of the IBEX. P/E multiples discount Spain’s bleak environment Now valuation is close to the bottom seen back in 1992 30 50% Europe Spain 40% Historical Spanish P/E discount to European average 25 30% 20% 20 10% 0% 15 -10% -20% 10 -30% -43% -29.8% -40% 5 -50% 90 91 92 93 94 95 96 97 98 99 00 01 02 03 04 05 06 07 08 09 10 90 91 92 93 94 95 96 97 98 99 00 01 02 03 04 05 06 07 08 09 10 Source: SG Cross Asset Research 12 4 May 2010
- 13. Equity Prism IMPORTANT DISCLOSURES Accor SG is acting as financial advisor in its demerger project. Accor SG acted as financial advisor to Accor and Colony Capital on the valuation of Group Lucien Barriere. ArcelorMittal SG acted as joint bookrunner for the equity and convertible bond offerings of ArcelorMittal. ArcelorMittal SG acted as joint lead manager and joint bookrunner in the issue of unsecured bonds convertible into new shares and/or exchangeable for existing shares of ArcelorMittal (OCEANE) Barclays SG acted as Co-manager of Barclays plc's bond issue. Barclays SG acted as co-manager in the Barclays senior bond issue. Barclays SG acted as co-manger in Barclays' senior high grade bond issue. Daimler SG acted as Joint bookrunner in the Daimler's senior bond issue (4.625% 02/09/14 EUR). Kingfisher SG acted as agent in the tender offer for Kingfisher's 4.125% Notes due 2012. Santander SG acted as joint bookrunner of Santander's covered bond issue (3.625% 06/04/17 EUR). Santander SG acted as joint bookrunner in the Santander's covered bond issue (3.875% 27/05/14 EUR). Vallourec SG advised the FSI in the increase of its stake in Vallourec US THIRD PARTY FOREIGN AFFILIATE RESEARCH DISCLOSURES: SG and its affiliates beneficially own 1% or more of any class of common equity of Accor, Daimler, Santander. SG or its affiliates act as market maker or liquidity provider in the equities securities of Accor, Daimler, Royal Dutch Shell, Santander, Volvo. SG or its affiliates expect to receive or intend to seek compensation for investment banking services in the next 3 months from Accor, ArcelorMittal, Barclays, Compass Group, Daimler, Fraport, Santander, Vallourec, Volvo. SG or its affiliates have received compensation for investment banking services in the past 12 months from Accor, ArcelorMittal, Barclays, Daimler, Kingfisher, Santander. SG or its affiliates managed or co-managed in the past 12 months a public offering of securities of ArcelorMittal, Barclays, Daimler, Santander. IMPORTANT DISCLAIMER: The information herein is not intended to be an offer to buy or sell, or a solicitation of an offer to buy or sell, any securities and including any expression of opinion, has been obtained from or is based upon sources believed to be reliable but is not guaranteed as to accuracy or completeness although Société Générale (“SG”) believe it to be clear, fair and not misleading. SG, and their affiliated companies in the SG Group, may from time to time deal in, profit from the trading of, hold or act as market-makers or act as advisers, brokers or bankers in relation to the securities, or derivatives thereof, of persons, firms or entities mentioned in this document or be represented on the board of such persons, firms or entities. SG is acting as a principal trader in debt securities that may be refered to in this report and may hold debt securities positions. Employees of SG, and their affiliated companies in the SG Group, or individuals connected to then, other than the authors of this report, may from time to time have a position in or be holding any of the investments or related investments mentioned in this document. Each author of this report is not permitted to trade in or hold any of the investments or related investments which are the subject of this document. SG and their affiliated companies in the SG Group are under no obligation to disclose or take account of this document when advising or dealing with or for their customers. The views of SG reflected in this document may change without notice. To the maximum extent possible at law, SG does not accept any liability whatsoever arising from the use of the material or information contained herein. This research document is not intended for use by or targeted at retail customers. Should a retail customer obtain a copy of this report they should not base their investment decisions solely on the basis of this document but must seek independent financial advice. Important notice: The circumstances in which materials provided by SG Fixed & Forex Research, SG Commodity Research, SG Convertible Research and SG Equity Derivatives Research have been produced are such (for example because of reporting or remuneration structures or the physical location of the author of the material) that it is not appropriate to characterise it as independent investment research as referred to in European MIF directive and that it should be treated as a marketing material even if it contains a research recommendation (« recommandation d’investissement à caractère promotionnel »). However, it must be made clear that all publications issued by SG will be clear, fair, and not misleading. Analyst Certification: Each author of this research report hereby certifies that (i) the views expressed in the research report accurately reflect his or her personal views about any and all of the subject securities or issuers and (ii) no part of his or her compensation was, is, or will be related, directly or indirectly, to the specific recommendations or views expressed in this report. Notice to French Investors: This publication is issued in France by or through Société Générale ("SG") which is authorised by the CECEI and regulated by the AMF (Autorité des Marchés Financiers). Notice to UK investors: This publication is issued in the United Kingdom by or through Société Générale ("SG") London Branch which is regulated by the Financial Services Authority ("FSA") for the conduct of its UK business. Notice To US Investors: This report is intended only for major US institutional investors pursuant to SEC Rule 15a-6. Any US person wishing to discuss this report or effect transactions in any security discussed herein should do so with or through SG Americas Securities, LLC (“SGAS”) 1221 Avenue of the Americas, New York, NY 10020. (212)-278-6000. THIS RESEARCH REPORT IS PRODUCED BY SOCIETE GENERALE AND NOT SGAS. Notice to Japanese Investors: This report is distributed in Japan by Société Générale Securities (North Pacific) Ltd., Tokyo Branch, which is regulated by the Financial Services Agency of Japan. The products mentioned in this report may not be eligible for sale in Japan and they may not be suitable for all types of investors. Notice to Australian Investors: Société Générale Australia Branch (ABN 71 092 516 286) (SG) takes responsibility for publishing this document. SG holds an AFSL no. 236651 issued under the Corporations Act 2001 (Cth) ("Act"). The information contained in this newsletter is only directed to recipients who are wholesale clients as defined under the Act. IMPORTANT DISCLOSURES: Please refer to our websites: http://www.sgresearch.com/compliance.rha 34H http://www.sgcib.com. Copyright: The Société Générale Group 2010. All rights reserved. The MSCI sourced information is the exclusive property of Morgan Stanley Capital International Inc. (MSCI). Without prior written permission of MSCI, this information and any other MSCI intellectual property may not be reproduced, redisseminated or used to create any financial products, including any indices. This information is provided on an “as is” basis. The user assumes the entire risk of any use made of this information. MSCI, its affiliates and any third party involved in, or related to, computing or compiling the information hereby expressly disclaim all warranties of originality, accuracy, completeness, merchantability or fitness for a particular purpose with respect to any of this information. Without limiting any of the foregoing, in no event shall MSCI, any of its affiliates or any third party involved in, or related to, computing or compiling the information have any liability for any damages of any kind. MSCI, Morgan Stanley Capital International and the MSCI indexes are services marks of MSCI and its affiliates. or such similar language as may be provided by or approved in advance by MSCI. 4 May 2010 13