Private Equity Index Rises 3.5% on Record Global Investment
•
1 gostou•239 visualizações

Private equity industry continues post-recession rebound, according to new PE Index released by PEGCC

Recomendados
Mais conteúdo relacionado
Semelhante a Private Equity Index Rises 3.5% on Record Global Investment
Semelhante a Private Equity Index Rises 3.5% on Record Global Investment (20)
Último
Último (20)
Private Equity Index Rises 3.5% on Record Global Investment
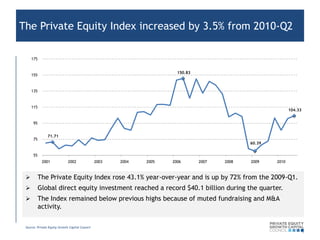
- 1. The Private Equity Index increased by 3.5% from 2010-Q2 175 150.83 155 135 115 104.33 95 71.71 75 60.39 55 2001 2002 2003 2004 2005 2006 2007 2008 2009 2010 The Private Equity Index rose 43.1% year-over-year and is up by 72% from the 2009-Q1. Global direct equity investment reached a record $40.1 billion during the quarter. The Index remained below previous highs because of muted fundraising and M&A activity. Source: Private Equity Growth Capital Council
- 2. Global direct equity investment increased by 10.2% 45,000 $40,109 40,000 35,000 $32,417 30,000 25,000 ($ Mil.) 20,000 $16,023 $17,862 15,000 10,000 5,000 $7,033 $4,525 0 2001 2002 2003 2004 2005 2006 2007 2008 2009 2010 Source: Thomson Reuters; buyout and growth capital
- 3. Value of PE-backed M&A increased by 55.3% in Q3 Deal Value ($ Mil.) PE-backed M&A as a % of total M&A $350,000 $318,864 30.0% (23.4%) $300,000 $86,212 25.0% (21.8%) $250,000 20.0% $200,000 $41,468 (13.9%) 15.0% $70,508 $150,000 (11.3%) 10.0% $100,000 $16,268 (3.1%) 5.0% $50,000 $0 0.0% 2001 2002 2003 2004 2005 2006 2007 2008 2009 2010 PE-Backed M&A Activity reached $70.5 billion during 2010-Q3 (bars; left axis) and represented 11.3% of all global M&A activity (blue line; right axis) in the quarter. This is four times the total deal volume of 2009-Q1, but still far from 2007 peak. Note: Deal value includes net debt of Target Source: Thomson Reuters; financial sponsor-backed