Lp final slides
•
0 gostou•303 visualizações

Linear programming model used in the final paper "Saving the Environment One Tree at a Time: An Application of Quantitative Techniques on the La Mesa Watershed"

Recomendados
Mais conteúdo relacionado
Mais de Dr. Jojo Javier
Último
Último (20)
Lp final slides
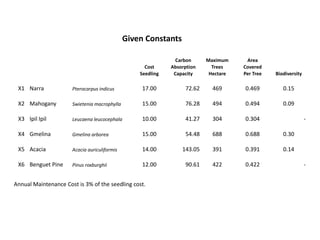
- 1. Given Constants Carbon Maximum Area Cost Absorption Trees Covered Seedling Capacity Hectare Per Tree Biodiversity X1 Narra Pterocarpus indicus 17.00 72.62 469 0.469 0.15 X2 Mahogany Swietenia macrophylla 15.00 76.28 494 0.494 0.09 X3 Ipil Ipil Leucaena leucocephala 10.00 41.27 304 0.304 - X4 Gmelina Gmelina arborea 15.00 54.48 688 0.688 0.30 X5 Acacia Acacia auriculiformis 14.00 143.05 391 0.391 0.14 X6 Benguet Pine Pinus roxburghii 12.00 90.61 422 0.422 - Annual Maintenance Cost is 3% of the seedling cost.
- 2. Assumptions of the Model 1. Maximum Diameter Class is in the range of 10 -20 dbh 2. Carbon density or absorption capacity is given at 50% of the computed biomass * 3. Tree choices were limited to fast growing trees with maximum carbon absorption endemic to the watershed ** 4. Full capacity of carbon absorption is assumed at the start of 10 years. 5. Biodiversity mix is based on given standards of the La Mesa Watershed. * Carbon Budgets Pantabangan - Carranglan Watershed Data - Lasco, Pulhin, Lasco, Roy 2005 ** Potential Carbon Sequestration Projects in the Philippines - Lasco, Pulhin, Banaticla 2004
- 3. Statement of Objectives If an individual wants to help save the environment via offsetting carbon emissions by planting trees, how much is needed for this endeavor? And what is the optimal number of trees per genus that have to be planted to offset the carbon footprints? Carbon Absorption Capacity X1 Narra 72.62 X2 Mahogany 76.28 Max Carbon Reduction = X3 Ipil Ipil 41.27 72.62X1 + 76.28X2 + 41.27X3 + 54.48X4 + X4 Gmelina 54.48 143.05X5 + 90.61X6 X5 Acacia 143.05 X6 Benguet Pine 90.61
- 4. Constraints Total Carbon Reduction Contribution <= Carbon Emmission Area Covered Total Area Covered <= 284 hectares or 2.272 sqm Biodiversity Mix Narra <= 15% of the total trees planted Mahogany <= At least 9% of the total trees planted Gmelina <= At least 3% of the total trees planted Acacia <= At least 14% of the total trees planted Total Ipil Ipil Trees = Total Benguet Pine Trees Maximum Area Trees Planted per Specie <= Maximum number of trees per hectare
- 5. Constraints Total Carbon Reduction Contribution <= Carbon Emmission Area Covered Total Area Covered <= 284 hectares or 2.272 sqm Biodiversity Mix Narra <= 15% of the total trees planted Mahogany <= At least 9% of the total trees planted Gmelina <= At least 3% of the total trees planted Acacia <= At least 14% of the total trees planted Total Ipil Ipil Trees = Total Benguet Pine Trees Maximum Area Trees Planted per Specie <= Maximum number of trees per hectare Carbon Absorption Capacity X1 Narra 72.62 X2 Mahogany 76.28 Max Carbon Reduction = X3 Ipil Ipil 41.27 X4 Gmelina 54.48 72.62X1 + 76.28X2 + 41.27X3 + 54.48X4 + X5 Acacia 143.05 143.05X5 + 90.61X6 X6 Benguet Pine 90.61
- 6. Constraints Total Carbon Reduction Contribution <= Carbon Emmission Area Covered Total Area Covered <= 284 hectares or 2.272 sqm Biodiversity Mix Narra <= 15% of the total trees planted Mahogany <= At least 9% of the total trees planted Gmelina <= At least 3% of the total trees planted Acacia <= At least 14% of the total trees planted Total Ipil Ipil Trees = Total Benguet Pine Trees Maximum Area Trees Planted per Specie <= Maximum number of trees per hectare Area Covered Per Tree X1 Narra 0.469 X2 Mahogany 0.494 Total Area Covered = X3 Ipil Ipil 0.304 .469X1 + .494X2 + .304X3 + .688X4 + X4 Gmelina 0.688 .391X5 + .422X6 X5 Acacia 0.391 X6 Benguet Pine 0.422
- 7. Constraints Total Carbon Reduction Contribution <= Carbon Emmission Area Covered Total Area Covered <= 284 hectares or 2.272 sqm Biodiversity Mix Narra <= 15% of the total trees planted Mahogany <= At least 9% of the total trees planted Gmelina <= At least 3% of the total trees planted Acacia <= At least 14% of the total trees planted Total Ipil Ipil Trees = Total Benguet Pine Trees Maximum Area Trees Planted per Specie <= Maximum number of trees per hectare Biodiversity X1 Narra 0.15 Narra X1 <= .15 (X1 + X2 + X3 + X4 + X5) X2 Mahogany 0.09 X3 Ipil Ipil - Mahogany X2 <= .09 (X1 + X2 + X3 + X4 + X5) X4 Gmelina 0.30 Gmelina X4 <= .03 (X1 + X2 + X3 + X4 + X5) Acacia X5 <= .14 (X1 + X2 + X3 + X4 + X5) X5 Acacia 0.14 X6 Benguet Pine - Ipil Ipil = B. Pines X2 = X6
- 8. Constraints Total Carbon Reduction Contribution <= Carbon Emmission Area Covered Total Area Covered <= 284 hectares or 2.272 sqm Biodiversity Mix Narra <= 15% of the total trees planted Mahogany <= At least 9% of the total trees planted Gmelina <= At least 3% of the total trees planted Acacia <= At least 14% of the total trees planted Total Ipil Ipil Trees = Total Benguet Pine Trees Maximum Area Trees Planted per Specie <= Maximum number of trees per hectare Maximum Tree Per Hectare X1 Narra 469 Narra X1 <= 469 X2 Mahogany 494 Mahogany X2 <= 494 X3 Ipil Ipil 304 Ipil Ipil X3 <= 304 X4 Gmelina 688 Gmelina X4 <= 688 X5 Acacia 391 Acacia X5 <= 391 X6 Benguet Pine 422 Benguet Pines X6 <= 422
- 9. Linear Programming Results Computed Carbon Emission - 22,000 Total Carbon Trees Sq M Cost Reduction Planted Area Covered Breakdown Contribution Narra 22 10.39 377.30 1,609.54 Mahogany 27 13.10 398.36 2,023.51 Ipil Ipil 59 17.86 587.88 2,424.94 Gmelina 88 60.36 1,316.36 4,779.38 Acacia 41 15.96 571.83 5,838.57 Benguet Pine 59 24.80 705.46 5,324.06 295 142.47 3,957.18 22,000.00