SlideShare uma empresa Scribd logo
1 de 1
Baixar para ler offline
LOB Weekly Effective FTE: 1.00
Site
Manager
Team Please click below to change between week / month
Agent
Points Value Points
Actual Target
(#/$)
Points Target % to Target
Pts Variance
from Target
Actual Volume
(#/$)
Points Actual Target (#/$) Points Target % to Target
Pts Variance
from Target
Wkly Target
for 100% by
End FY
Actual Volume
(#/$)
Points
Actual Target
(#/$)
Points Target % to Target
50.0 29.2 171.2% 21 1,060.0 252.7 419% 807 29 2,690.0 1,197.8 224.6%
30 0 q 0.0 1 22.8 0.0% -23 28 840.0 6.6 197.3 426% 643 23 69 2,070.0 31.2 935.3 221%
10 5 p 50.0 0.6 6.4 781.3% 44 22 220.0 5.5 55.4 397% 165 6 62 620.0 26.3 262.5 236%
30.0 55.3 54.2% -25 390.0 478.6 81% -89 262 2,280.0 2,268.4 101%
.72 / $1,000 $0 p 0.0 0.0 0.0 0 $0 0.0 0.0 0.0 0 0.0 $0 0.0 0.0 0.0
30 1 p 30.0 1.8 55.3 54.2% -25 13 390.0 16.0 478.6 81% -89 262 76 2,280.0 75.6 2,268.4 101%
20.0 18.7 107.2% 1 200.0 161.5 124% 39 19 705.0 765.2 92%
5 / $1,000 $0 p 0.0 0.0 0.0 0 $0 0.0 0.0 0.0 0 0.0 $0 0.0 0.0 0.0
10 2 q 20.0 0.3 3.3 606.1% 17 17 170.0 2.9 28.6 595% 141 3 40 400.0 13.5 135.4 295%
30 0 p 0.0 0.5 14.8 0.0% -15 1 30.0 4.3 128.1 23% -98 244 10 300.0 20.2 607.1 49%
5 0 p 0.0 0.1 0.6 0.0% -1 0 0.0 1.0 4.8 0% -5 12 1 5.0 4.5 22.7 22%
0.0 19.5 0.0% -20 121.0 169.1 72% -48 132 1,214.0 801.4 151%
25 0 p 0.0 0.2 6.0 0.0% -6 1 25.0 2.1 51.9 48% -27 69 19 475.0 9.8 246.1 193%
15 0 q 0.0 0.6 9.3 0.0% -9 5 75.0 5.3 80.2 93% -5 22 39 585.0 25.4 380.3 154%
5 0 q 0.0 0.6 3.1 0.0% -3 3 15.0 5.3 26.7 56% -12 30 24 120.0 25.3 126.5 95%
2 0 p 0.0 0.6 1.2 0.0% 3 6.0 5.1 10.2 59% 1 17 34.0 24.2 48.4 70%
-96.7 63.2 -152.9% -160 686.5 547.3 125% 139 63 5,764.1 2,593.7 222%
6 / $100 $0 p 0.0 0.0 0.0 0 $0 0.0 0.0 0.0 0 0.0 $0 0.0 0.0 0.0
12 / $100 -$806 q -96.7 480.0 57.6 -167.8% -154 $5,654 678.5 4,154.6 498.5 136% 180 58 $46,885 5,626.1 19,689.9 2,362.8 238%
12 / $100 $0 p 0.0 0.0 0.0 0 $0 0.0 0.0 0.0 0 0.0 $0 0.0 0.0 0.0
12 / $100 0 p 0.0 12.5 1.5 0.0% -2 $0 0.0 108.2 13.0 0% -13 32 $750 90.0 512.8 61.5 146%
8 0 p 0.0 0.4 3.6 0.0% -4 $1 8.0 3.9 31.1 26% -23 57 $6 48.0 18.4 147.3 33%
8 0 p 0.0 0.1 0.5 0.0% -1 $0 0.0 0.5 4.3 0% -4 11 $0 0.0 2.6 20.5 0%
8 0 p 0.0 0.0 0.0 0.0% 0 $0 0.0 0.0 0.3 0% 0 1 $0 0.0 0.2 1.7 0%
0.0 0.0 0% 0.0
3.3 185.9 2% -183 2,457.5 1,609.2 153% 848 186 12,653.1 7,626.5 166%
All
Melbourne
Brent Stahlhut
The Late Show
Joe Liu
SALES TARGET ACTIVITY REPORT (STAR)
YTDQTDWeekly
Mortgage Lending Funding
Actual Volume (#/$)
Deposits
Transaction Accounts QNA
Mortgage Lending
Retail Savings QNA
NTB 130% Capping Adjustment
Loan Protection OTR
Credit Cards
Consumer Finance
Personal Loan Protection Net
Premium
Personal Loan OTR
Personal Overdraft
Mortgage Lending OTR
Personal Loan Funding
Personal Overdraft OTR
Friday, 27 June 2014
Total STAR Performance
Credit Cards QNA
Credit Cards Limit Increases
Risk Management
GI Home and Contents Net Premium
Motor Insurance Net Premium
Credit Cards Upgrades
Home Loan Protection Net Premium
Credit Card Plus Net Premium
Credit Card Plus OTR
General Insurance OTR
Credit Cards CLI Opt Ins
Direct Banking
STAR Detailed Report

Mais conteúdo relacionado

Mais procurados

Business statistics -_assignment_dec_2019_zf_sgc5ylme
Business statistics -_assignment_dec_2019_zf_sgc5ylmeBusiness statistics -_assignment_dec_2019_zf_sgc5ylme
Business statistics -_assignment_dec_2019_zf_sgc5ylmeAssignmentchimp
 
Flevy.com - Staff Demand and Shift Bidding
Flevy.com - Staff Demand and Shift BiddingFlevy.com - Staff Demand and Shift Bidding
Flevy.com - Staff Demand and Shift BiddingDavid Tracy
 
July 2017 Monthly economic report real estate analysis benchmark - july 7,...
July 2017 Monthly economic report   real estate analysis  benchmark - july 7,...July 2017 Monthly economic report   real estate analysis  benchmark - july 7,...
July 2017 Monthly economic report real estate analysis benchmark - july 7,...Dean Koeller
 
柏瑞週報 20190524
柏瑞週報 20190524柏瑞週報 20190524
柏瑞週報 20190524Pinebridge
 
柏瑞週報 20200110
柏瑞週報 20200110柏瑞週報 20200110
柏瑞週報 20200110Pinebridge
 
Lincoln crowne engineering mining services research 26 july 2013
Lincoln crowne engineering mining services research 26 july 2013Lincoln crowne engineering mining services research 26 july 2013
Lincoln crowne engineering mining services research 26 july 2013Lincoln Crowne & Company
 
柏瑞週報 20190119
柏瑞週報 20190119柏瑞週報 20190119
柏瑞週報 20190119Pinebridge
 
Games Show đuổi hình bắt chữ
Games Show đuổi hình bắt chữGames Show đuổi hình bắt chữ
Games Show đuổi hình bắt chữQuangnh14
 
柏瑞週報 20191206
柏瑞週報 20191206柏瑞週報 20191206
柏瑞週報 20191206Pinebridge
 
柏瑞週報 20190329
柏瑞週報 20190329柏瑞週報 20190329
柏瑞週報 20190329Pinebridge
 
柏瑞週報 20200529
柏瑞週報 20200529柏瑞週報 20200529
柏瑞週報 20200529Pinebridge
 
DISTRIBUCION BINOMIAL
DISTRIBUCION BINOMIALDISTRIBUCION BINOMIAL
DISTRIBUCION BINOMIALUPN
 
柏瑞週報 20191122
柏瑞週報 20191122柏瑞週報 20191122
柏瑞週報 20191122Pinebridge
 
柏瑞週報 20190215
柏瑞週報 20190215柏瑞週報 20190215
柏瑞週報 20190215Pinebridge
 
2016 Facebook Advertising Dashboard Template
2016 Facebook Advertising Dashboard Template2016 Facebook Advertising Dashboard Template
2016 Facebook Advertising Dashboard Templateunfunnel
 
柏瑞週報 20190531
柏瑞週報 20190531柏瑞週報 20190531
柏瑞週報 20190531Pinebridge
 

Mais procurados (20)

Business statistics -_assignment_dec_2019_zf_sgc5ylme
Business statistics -_assignment_dec_2019_zf_sgc5ylmeBusiness statistics -_assignment_dec_2019_zf_sgc5ylme
Business statistics -_assignment_dec_2019_zf_sgc5ylme
 
Doc1
Doc1Doc1
Doc1
 
NPS
NPS NPS
NPS
 
Flevy.com - Staff Demand and Shift Bidding
Flevy.com - Staff Demand and Shift BiddingFlevy.com - Staff Demand and Shift Bidding
Flevy.com - Staff Demand and Shift Bidding
 
July 2017 Monthly economic report real estate analysis benchmark - july 7,...
July 2017 Monthly economic report   real estate analysis  benchmark - july 7,...July 2017 Monthly economic report   real estate analysis  benchmark - july 7,...
July 2017 Monthly economic report real estate analysis benchmark - july 7,...
 
柏瑞週報 20190524
柏瑞週報 20190524柏瑞週報 20190524
柏瑞週報 20190524
 
柏瑞週報 20200110
柏瑞週報 20200110柏瑞週報 20200110
柏瑞週報 20200110
 
Lincoln crowne engineering mining services research 26 july 2013
Lincoln crowne engineering mining services research 26 july 2013Lincoln crowne engineering mining services research 26 july 2013
Lincoln crowne engineering mining services research 26 july 2013
 
17. perpetual license vs. saa s revenue model
17. perpetual license vs. saa s revenue model17. perpetual license vs. saa s revenue model
17. perpetual license vs. saa s revenue model
 
柏瑞週報 20190119
柏瑞週報 20190119柏瑞週報 20190119
柏瑞週報 20190119
 
Games Show đuổi hình bắt chữ
Games Show đuổi hình bắt chữGames Show đuổi hình bắt chữ
Games Show đuổi hình bắt chữ
 
柏瑞週報 20191206
柏瑞週報 20191206柏瑞週報 20191206
柏瑞週報 20191206
 
柏瑞週報 20190329
柏瑞週報 20190329柏瑞週報 20190329
柏瑞週報 20190329
 
柏瑞週報 20200529
柏瑞週報 20200529柏瑞週報 20200529
柏瑞週報 20200529
 
DISTRIBUCION BINOMIAL
DISTRIBUCION BINOMIALDISTRIBUCION BINOMIAL
DISTRIBUCION BINOMIAL
 
柏瑞週報 20191122
柏瑞週報 20191122柏瑞週報 20191122
柏瑞週報 20191122
 
柏瑞週報 20190215
柏瑞週報 20190215柏瑞週報 20190215
柏瑞週報 20190215
 
2016 Facebook Advertising Dashboard Template
2016 Facebook Advertising Dashboard Template2016 Facebook Advertising Dashboard Template
2016 Facebook Advertising Dashboard Template
 
Mrp ii
Mrp iiMrp ii
Mrp ii
 
柏瑞週報 20190531
柏瑞週報 20190531柏瑞週報 20190531
柏瑞週報 20190531
 

Semelhante a STAR Report FY13-14

Tx admit -psap_by_county_fy12_414978_7
Tx admit -psap_by_county_fy12_414978_7Tx admit -psap_by_county_fy12_414978_7
Tx admit -psap_by_county_fy12_414978_7satoriwatersfl
 
富邦投顧研究部核心持股2011年殖利率 02.17.2012
富邦投顧研究部核心持股2011年殖利率 02.17.2012富邦投顧研究部核心持股2011年殖利率 02.17.2012
富邦投顧研究部核心持股2011年殖利率 02.17.2012yo9889
 
John Billings: Applying predictive risk approaches and models effectively
John Billings: Applying predictive risk approaches and models effectivelyJohn Billings: Applying predictive risk approaches and models effectively
John Billings: Applying predictive risk approaches and models effectivelyNuffield Trust
 
Tabela de conversao z-dpmo
Tabela de conversao   z-dpmoTabela de conversao   z-dpmo
Tabela de conversao z-dpmoHugo Oliveira
 
Market Watch TORONTO 2015 OCTOBER
Market Watch TORONTO 2015 OCTOBERMarket Watch TORONTO 2015 OCTOBER
Market Watch TORONTO 2015 OCTOBERChaba Tamasi
 
Communicated discounts (drinks wo alccols) 2017 2016
Communicated discounts (drinks wo alccols) 2017 2016Communicated discounts (drinks wo alccols) 2017 2016
Communicated discounts (drinks wo alccols) 2017 2016HIPERCOM
 
Résultats élections régionales 20151206
Résultats élections régionales 20151206Résultats élections régionales 20151206
Résultats élections régionales 20151206Grégory MACÉ
 
07.3 credit ratings and fico scores
07.3   credit ratings and fico scores07.3   credit ratings and fico scores
07.3 credit ratings and fico scorescrmbasel
 
TREB Market Watch for May 2016
TREB Market Watch for May 2016TREB Market Watch for May 2016
TREB Market Watch for May 2016Michelle Makos
 
Market Watch May 2016
Market Watch May 2016Market Watch May 2016
Market Watch May 2016Chaba Tamasi
 
Caída Publicidad EEUU 2009
Caída Publicidad EEUU 2009Caída Publicidad EEUU 2009
Caída Publicidad EEUU 2009Juan Varela
 
Valuation Of ASHOK LEYLAND
Valuation Of ASHOK LEYLANDValuation Of ASHOK LEYLAND
Valuation Of ASHOK LEYLANDAakash Singh
 
This is my scorecard, what I infer from my simplified worksheet (...)
This is my scorecard, what I infer from my simplified worksheet (...)This is my scorecard, what I infer from my simplified worksheet (...)
This is my scorecard, what I infer from my simplified worksheet (...)Giuseppe Piazzolla
 
whole food market fiveyeardata
whole food market  fiveyeardatawhole food market  fiveyeardata
whole food market fiveyeardatafinance44
 
Financial Model Manufacturing And Retail Businesses
Financial Model Manufacturing And Retail BusinessesFinancial Model Manufacturing And Retail Businesses
Financial Model Manufacturing And Retail BusinessesElisha A. A. (Capital) Ltd
 

Semelhante a STAR Report FY13-14 (20)
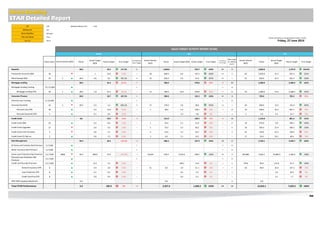
Correlation and volatility DJ EuroStoxx50 Oct 2014
Correlation and volatility DJ EuroStoxx50 Oct 2014Correlation and volatility DJ EuroStoxx50 Oct 2014
Correlation and volatility DJ EuroStoxx50 Oct 2014
 
Tx admit -psap_by_county_fy12_414978_7
Tx admit -psap_by_county_fy12_414978_7Tx admit -psap_by_county_fy12_414978_7
Tx admit -psap_by_county_fy12_414978_7
 
富邦投顧研究部核心持股2011年殖利率 02.17.2012
富邦投顧研究部核心持股2011年殖利率 02.17.2012富邦投顧研究部核心持股2011年殖利率 02.17.2012
富邦投顧研究部核心持股2011年殖利率 02.17.2012
 
John Billings: Applying predictive risk approaches and models effectively
John Billings: Applying predictive risk approaches and models effectivelyJohn Billings: Applying predictive risk approaches and models effectively
John Billings: Applying predictive risk approaches and models effectively
 
Tugas 1
Tugas 1Tugas 1
Tugas 1
 
Tabela de conversao z-dpmo
Tabela de conversao   z-dpmoTabela de conversao   z-dpmo
Tabela de conversao z-dpmo
 
Market Watch TORONTO 2015 OCTOBER
Market Watch TORONTO 2015 OCTOBERMarket Watch TORONTO 2015 OCTOBER
Market Watch TORONTO 2015 OCTOBER
 
Communicated discounts (drinks wo alccols) 2017 2016
Communicated discounts (drinks wo alccols) 2017 2016Communicated discounts (drinks wo alccols) 2017 2016
Communicated discounts (drinks wo alccols) 2017 2016
 
Matematicas Financieras: Tablas de tasas factores financieros (2020)
Matematicas Financieras: Tablas de tasas factores financieros (2020)Matematicas Financieras: Tablas de tasas factores financieros (2020)
Matematicas Financieras: Tablas de tasas factores financieros (2020)
 
Résultats élections régionales 20151206
Résultats élections régionales 20151206Résultats élections régionales 20151206
Résultats élections régionales 20151206
 
07.3 credit ratings and fico scores
07.3   credit ratings and fico scores07.3   credit ratings and fico scores
07.3 credit ratings and fico scores
 
TREB Market Watch for May 2016
TREB Market Watch for May 2016TREB Market Watch for May 2016
TREB Market Watch for May 2016
 
Market Watch May 2016
Market Watch May 2016Market Watch May 2016
Market Watch May 2016
 
Caída Publicidad EEUU 2009
Caída Publicidad EEUU 2009Caída Publicidad EEUU 2009
Caída Publicidad EEUU 2009
 
Valuation Of ASHOK LEYLAND
Valuation Of ASHOK LEYLANDValuation Of ASHOK LEYLAND
Valuation Of ASHOK LEYLAND
 
Trading model data
Trading model dataTrading model data
Trading model data
 
Roy Fisher Outlook 2012
Roy Fisher Outlook 2012Roy Fisher Outlook 2012
Roy Fisher Outlook 2012
 
This is my scorecard, what I infer from my simplified worksheet (...)
This is my scorecard, what I infer from my simplified worksheet (...)This is my scorecard, what I infer from my simplified worksheet (...)
This is my scorecard, what I infer from my simplified worksheet (...)
 
whole food market fiveyeardata
whole food market  fiveyeardatawhole food market  fiveyeardata
whole food market fiveyeardata
 
Financial Model Manufacturing And Retail Businesses
Financial Model Manufacturing And Retail BusinessesFinancial Model Manufacturing And Retail Businesses
Financial Model Manufacturing And Retail Businesses
 

STAR Report FY13-14

  • 1. LOB Weekly Effective FTE: 1.00 Site Manager Team Please click below to change between week / month Agent Points Value Points Actual Target (#/$) Points Target % to Target Pts Variance from Target Actual Volume (#/$) Points Actual Target (#/$) Points Target % to Target Pts Variance from Target Wkly Target for 100% by End FY Actual Volume (#/$) Points Actual Target (#/$) Points Target % to Target 50.0 29.2 171.2% 21 1,060.0 252.7 419% 807 29 2,690.0 1,197.8 224.6% 30 0 q 0.0 1 22.8 0.0% -23 28 840.0 6.6 197.3 426% 643 23 69 2,070.0 31.2 935.3 221% 10 5 p 50.0 0.6 6.4 781.3% 44 22 220.0 5.5 55.4 397% 165 6 62 620.0 26.3 262.5 236% 30.0 55.3 54.2% -25 390.0 478.6 81% -89 262 2,280.0 2,268.4 101% .72 / $1,000 $0 p 0.0 0.0 0.0 0 $0 0.0 0.0 0.0 0 0.0 $0 0.0 0.0 0.0 30 1 p 30.0 1.8 55.3 54.2% -25 13 390.0 16.0 478.6 81% -89 262 76 2,280.0 75.6 2,268.4 101% 20.0 18.7 107.2% 1 200.0 161.5 124% 39 19 705.0 765.2 92% 5 / $1,000 $0 p 0.0 0.0 0.0 0 $0 0.0 0.0 0.0 0 0.0 $0 0.0 0.0 0.0 10 2 q 20.0 0.3 3.3 606.1% 17 17 170.0 2.9 28.6 595% 141 3 40 400.0 13.5 135.4 295% 30 0 p 0.0 0.5 14.8 0.0% -15 1 30.0 4.3 128.1 23% -98 244 10 300.0 20.2 607.1 49% 5 0 p 0.0 0.1 0.6 0.0% -1 0 0.0 1.0 4.8 0% -5 12 1 5.0 4.5 22.7 22% 0.0 19.5 0.0% -20 121.0 169.1 72% -48 132 1,214.0 801.4 151% 25 0 p 0.0 0.2 6.0 0.0% -6 1 25.0 2.1 51.9 48% -27 69 19 475.0 9.8 246.1 193% 15 0 q 0.0 0.6 9.3 0.0% -9 5 75.0 5.3 80.2 93% -5 22 39 585.0 25.4 380.3 154% 5 0 q 0.0 0.6 3.1 0.0% -3 3 15.0 5.3 26.7 56% -12 30 24 120.0 25.3 126.5 95% 2 0 p 0.0 0.6 1.2 0.0% 3 6.0 5.1 10.2 59% 1 17 34.0 24.2 48.4 70% -96.7 63.2 -152.9% -160 686.5 547.3 125% 139 63 5,764.1 2,593.7 222% 6 / $100 $0 p 0.0 0.0 0.0 0 $0 0.0 0.0 0.0 0 0.0 $0 0.0 0.0 0.0 6 / $100 $0 p 0.0 0.0 0.0 0 $0 0.0 0.0 0.0 0 0.0 $0 0.0 0.0 0.0 12 / $100 -$806 q -96.7 480.0 57.6 -167.8% -154 $5,654 678.5 4,154.6 498.5 136% 180 58 $46,885 5,626.1 19,689.9 2,362.8 238% 12 / $100 $0 p 0.0 0.0 0.0 0 $0 0.0 0.0 0.0 0 0.0 $0 0.0 0.0 0.0 12 / $100 0 p 0.0 12.5 1.5 0.0% -2 $0 0.0 108.2 13.0 0% -13 32 $750 90.0 512.8 61.5 146% 8 0 p 0.0 0.4 3.6 0.0% -4 $1 8.0 3.9 31.1 26% -23 57 $6 48.0 18.4 147.3 33% 8 0 p 0.0 0.1 0.5 0.0% -1 $0 0.0 0.5 4.3 0% -4 11 $0 0.0 2.6 20.5 0% 8 0 p 0.0 0.0 0.0 0.0% 0 $0 0.0 0.0 0.3 0% 0 1 $0 0.0 0.2 1.7 0% 0.0 0.0 0% 0.0 3.3 185.9 2% -183 2,457.5 1,609.2 153% 848 186 12,653.1 7,626.5 166% All Melbourne Brent Stahlhut The Late Show Joe Liu SALES TARGET ACTIVITY REPORT (STAR) YTDQTDWeekly Mortgage Lending Funding Actual Volume (#/$) Deposits Transaction Accounts QNA Mortgage Lending Retail Savings QNA NTB 130% Capping Adjustment Loan Protection OTR Credit Cards Consumer Finance Personal Loan Protection Net Premium Personal Loan OTR Personal Overdraft Mortgage Lending OTR Personal Loan Funding Personal Overdraft OTR Friday, 27 June 2014 Total STAR Performance Credit Cards QNA Credit Cards Limit Increases Risk Management GI Home and Contents Net Premium Motor Insurance Net Premium Credit Cards Upgrades Home Loan Protection Net Premium Credit Card Plus Net Premium Credit Card Plus OTR General Insurance OTR Credit Cards CLI Opt Ins Direct Banking STAR Detailed Report