Beginners Guide to TikTok for Search - Rachel Pearson - We are Tilt __ Bright...
Tampa Bay Office Market Report - Q1 2012
1. Q1 2012 | OFFICE
TAMPA BAY FLORIDA
OFFICE RESEARCH REPORT Tampa Bay Florida
Market Poised for Steady Advance
EXECUTIVE SUMMARY
The Tampa Bay office market activity was steady during the first quarter of 2012. The market
continues to show signs of positive progress in its recovery as the economy improves. Tampa’s
unemployment rate continues to drop reporting in at 8.9% for the month ending in March.
The flight to quality is a dominant theme, as tenants seize the opportunity to lock in lower rates as
they relocate to Class A space. This trend is particularly prevalent in St. Petersburg’s Gateway
submarket, which posted the area’s lowest vacancy rate - 13%. Rates remain relatively flat overall
with concessions abating slightly during the first quarter. The Healthcare market remains strong,
as large medical practices move to facilities that have prime locations relative to the patient base
MARKET INDICATORS
they service. Meanwhile, construction of new office space – something not even contemplated
Q1 2012 Q2 2012* since 2007 – seems to be around the corner. In downtown Tampa, Trammell Crow is planning
construction of a 400,000 square foot project – SouthGate Office Tower. In Westshore, Crescent
VACANCY Resources has reintroduced their plans to build two 300,000 square-foot buildings, as has
Rubenstein’s with their Westview Center - three buildings totaling 580,000 square feet.
NET ABSORPTION
CONSTRUCTION
• Landlords are now meeting the market • Investment sale activity was quiet. Class A
OVERALL norms in terms of rates, tenant improvement buildings in top locations and single-tenant
RENTAL RATE
allowances and free rent. net lease deals continue to command the
CLASS A RENTAL
• Downtown Tampa: good things are lowest cap rates.
RATE
happening; downtown residential is now • Call centers continue to be active for
*Relative to prior period. Arrows compare over 95% occupied, the CAMLS project is significant blocks of space. Insurance
current quarter to the previous quarter historically open and operating, and Channelside Retail companies, technology firms, marine/
adjusted figures. All data in this report includes
will be sold and revitalized under new environmental activities and law firms are
buildings 10,000 square feet and greater.
ownership. driving demand for office space.
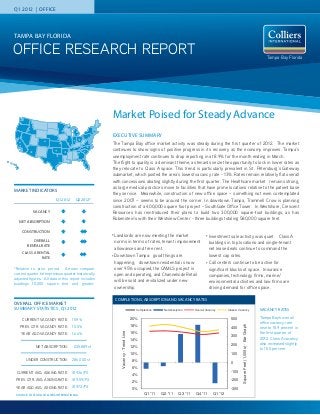
COMPLETIONS, ABSORPTION AND VACANCY RATES
OVERALL OFFICE MARKET
SUMMARY STATISTICS, Q1 2012 Completions Net Absorption Overall Vacancy Class A Vacancy VACANCY RATES
CURRENT VACANCY RATE: 15.9% 20% 500 Tampa Bay’s overall
office vacancy rate
18%
Square Feet (1,000s) - Bar Graph
PREV. QTR. VACANCY RATE: 15.5% 400 rose to 15.9 percent in
Vacancy - Trend Line
YEAR AGO VACANCY RATE: 16.4% 16% the first quarter of
300
14% 2012. Class A vacancy
200 also increased slightly
NET ABSORPTION: -235,889 sf 12%
to 15.5 percent.
10% 100
UNDER CONSTRUCTION: 286,000 sf 8% 0
6%
CURRENT AVG. ASKING RATE: $19.36/FS -100
4%
PREV. QTR. AVG. ASKING RATE: $19..59/FS 2% -200
YEAR AGO AVG. ASKING RATE: $19.72/FS 0% -300
SOURCE: COSTAR & COLLIERS INTERNATIONAL Q1 '11 Q2 '11 Q3 '11 Q4 '11 Q1 '12
2. RESEARCH REPORT | Q1 2012 | OFFICE | COLLIERS INTERNATIONAL TAMPA BAY FLORIDA
UNEMPLOYMENT TRENDS
VACANCY submarket at $16.85 per square foot. Tightening
market conditions and lower unemployment
Tampa Bay’s office vacancy rose slightly by 0.4
rates are expected to keep rental rates steady
percent during the first quarter of 2012,
Florida Tampa MSA USA for the remainder of 2012. Class A large blocks
14%
finishing the quarter at 15.9 percent. The
of space remain difficult to find which will bode
highest vacancy rates are located in the I-75
well for Landlords and their ability to begin a
12% Corridor at 17.3 percent, and North Pinellas at
slow increase in rental rates in 2013. We
16.9 percent. Lowest total vacancy rates are
10% continue to see concessions in the form of free
seen in the Gateway submarket for the second
rent and above average tenant improvements.
consecutive quarter of the year, at a rate of
8%
13.0 percent.
INVESTMENT SALE ACTIVITY
6% ABSORPTION
Healthcare REIT purchased a 95,000sf medical
4% Overall net absorption registered negative office facility at 3000 Medical Park Drive in
-235,889 square feet, reversing the positive Tampa for $16.865 million ($177 psf). Interstate
2% direction seen over the previous two quarters. Center on MLK in Tampa, a 344,896 sf office
The Gateway submarket vacated 74,904 facility sold for $17,250,000, $50.02/SF. And
0% square feet of office space, while the I-75 a trio of office buildings traded in Clearwater
Sep-07
Sep-08
Sep-09
Sep-10
Sep-11
Mar-07
Mar-08
Mar-09
Mar-10
Mar-11
Mar-12
Corridor saw a net positive absorption of for $9.412 million (approx. $145 psf). These
45,602 square feet. properties, at 83-93 Park Place Blvd., were
The Tampa Bay MSA unemployment rate RENTAL RATES sold to Johnson-Lancaster & Associates.
posted 8.9 percent March 2012, which
represents a 12 percent decrease from the Direct overall asking rates reached $19.36 in
Colliers International has Lakeside Technology
end of the fourth quarter 2011. The State of the first quarter of 2012, declining $0.20 from
Plaza, a 224,000 sf property in Westshore,
Florida rate was 8.6 percent in March 2012, the previous quarter. Overall Class A asking
while the national rate ended March 2012 at
listed on the market at the time of this writing.
rates ended the quarter at $23.20 per square
8.4 percent. Other properties are expected to come to
foot, down $0.09 from the fourth quarter of
market in the coming quarters, particularly in
Source: Florida Research & Economic 2011. The Westshore submarket continued to
the Tampa CBD and Westshore, due to pent up
Database command the highest rental rates at an average
demand and stabilizing fundamentals of
of $23.34 per square foot full service, while
well-leased office projects.
North Pinellas remained the most affordable
TRANSACTION UPDATE
SALES ACTIVITY
PROPERTY NAME CLASS BUYER NAME SIZE SF SALES PRICE SUBMARKET
The Pointe A Parkway Properties 252,000 $46,900,000 ($185.86/sf) Westshore
Interstate Corporate Center B Rialto Capital Management LLC 344,896 $17,250,000 ($50.02/sf) Northeast Tampa
5585 Rio Vista Dr* B Magellan Realty Partners 30,000 $2,600,000 ($86.67/sf) Bayside
4610 Eisenhower Blvd* A Girl Scouts of West Central Florida 24,000 $2,150,000 ($89.58/sf) Westshore
LEASING ACTIVITY
PROPERTY NAME CLASS TENANT NAME SIZE (SF) LEASE TYPE SUBMARKET
Thompson Center Waters* B Real Estate Investors 23,570 New Northwest Tampa
Park Tower* B GSA/ATF 14,275 Renewal/Expansion Tampa CBD
100 N. Tampa A KPMG 13,944 Renewal Tampa CBD
Wells Fargo Center* A BDG Architects 8,625 New Tampa CBD
Plaza Tower* B H&R Block Eastern Enterprises 3,737 New St Pete CBD
*Colliers International Transaction
P. 2 | COLLIERS INTERNATIONAL TAMPA BAY FLORIDA
3. RESEARCH REPORT | Q1 2012 | OFFICE | COLLIERS INTERNATIONAL TAMPA BAY FLORIDA
UPDATE SUBMARKET COMPARISONS
SUBMARKET BREAKDOWN
Total Net Absorp. New
Property Total Inventory Direct Vac. Net Absorp. YTD Under Avg. Direct Asking Rate Full
Bldgs. Vac. Current Completions
Class S.F. % S.F. Construc. S.F. Service
% Qtr. S.F. S.F.
TAMPA CBD
A 12 4,783,266 14.6% 15.5% -8,768 -8,768 0 0 $23.09/fs
B,C 62 3,640,074 12.1% 12.1% 10,101 10,101 0 0 $18.43/fs
Overall 74 8,423,340 13.5% 14.0% 1,333 1,333 0 0 $21.51/fs
WESTSHORE
A 40 7,603,852 17.9% 18.4% -29,120 -29,120 0 286,000 $26.08/fs
B,C 202 7,928,650 11.8% 12.1% 723 723 0 0 $19.18/fs
Overall 242 15,532,502 14.8% 15.2% -28,397 -28,397 0 286,000 $23.34/fs
I-75 CORRIDOR
A 43 6,737,143 15.6% 16.6% -34,984 -34,984 0 0 $21.52/fs
B,C 282 9,301,450 17.5% 17.8% 80,586 80,586 0 0 $17.47/fs
Overall 325 16,038,593 16.7% 17.3% 45,602 45,602 0 0 $19.09/fs
NORTH PINELLAS
A 15 1,319,383 19.5% 19.5% -15,243 -15,243 0 0 $19.16/fs
B,C 155 3,827,324 16.0% 16.0% 24,430 24,430 0 0 $15.73/fs
Overall 170 5,146,707 16.9% 16.9% 9,187 9,187 0 0 $16.85/fs
GATEWAY
A 24 3,077,170 4.8% 5.3% -32,803 -32,803 0 0 $21.22/fs
B,C 123 4,724,410 17.7% 18.0% -42,101 -42,101 0 0 $16.44/fs
Overall 147 7,801,580 12.6% 13.0% -74,904 -74,904 0 0 $17.60/fs
ST. PETERSBURG CBD
A 9 1,635,246 22.2% 22.4% -288 -288 0 0 $22.30/fs
B,C 55 2,168,690 9.4% 9.4% -1,932 -1,932 0 0 $19.76/fs
Overall 64 3,803,936 14.9% 15.0% -2,220 -2,220 0 0 $20.87/fs
TAMPA BAY OVERALL OFFICE MARKET
Total Net Absorp. Net New Under Overall Avg. Class A Avg.
Total Inventory Direct Vac.
Qtr. & Year Bldgs. Vac. Current Absorp. Completions Construction Direct Asking Direct Asking
S.F. %
% Qtr. S.F. YTD S.F. S.F. S.F. Rate F.S. Rate F.S.
2012 1Q 1,765 79,460,235 15.5% 15.9% -235,889 -235,889 0 286,000 $19.36/fs $23.20/fs
2011 4Q 1,763 79,406,735 15.2% 15.5% 429,696 641,362 0 250,000 $19.59/fs $23.29/fs
2011 3Q 1,763 79,406,735 15.8% 16.1% 324,789 211,666 0 0 $19.63/fs $23.35/fs
2011 2Q 1,763 79,406,735 16.1% 16.5% -41,720 -113,123 0 0 $19.60/fs $23.16/fs
2011 1Q 1,763 79,406,735 16.0% 16.4% -71,403 -71,403 0 0 $19.72/fs $23.18/fs
2010 4Q 1,763 79,406,735 15.9% 16.3% 249,115 100,838 0 0 $19.94/fs $23.44/fs
2010 3Q 1,763 79,406,735 16.1% 16.7% 287,218 -148,277 0 0 $19.98/fs $23.61/fs
2010 2Q 1,763 79,406,735 16.5% 17.0% -216,535 -435,495 0 0 $20.02/fs $23.58/fs
2010 1Q 1,762 79,377,701 16.0% 16.7% -218,960 -218,960 0 0 $20.08/fs $23.59/fs
COLLIERS INTERNATIONAL TAMPA BAY FLORIDA | P. 3
4. RESEARCH REPORT | Q1 2012 | OFFICE | COLLIERS INTERNATIONAL TAMPA BAY FLORIDA
SUBMARKET MAP
522 offices in
62 countries on
6 continents
United States: 147
Canada: 37
Latin America: 19
Asia Pacific: 201
EMEA: 118
• $1.8 billion in annual revenue
• 1.25 billion square feet under
management
• Over 12,300 professionals
TAMPA BAY CITY LEADER:
Ryan Kratz
Executive Vice President
Brokerage | Marketing | Operations
Corporate Office
311 Park Place Boulevard
Suite 600
Clearwater, FL 33759
John Gerlach, CCIM TEL +1 727 442 7184
Alan Feldshue Jeff Tolrud, CCIM
Managing Director Office Services Managing Director, Office Services Managing Director Investment
alan.feldshue@colliers.com jeff.tolrud@colliers.com Services
www.colliers.com/Alan.Feldshue www.colliers.com/Jeff.Tolrud john.gerlach@colliers.com
www.colliers.com/John.Gerlach
Carol Warren, CCIM Jim Allen Mia Jarrell
Senior Director Managing Director Managing Director, Office Services
Commercial Services Healthcare Services Group mia.jarrell@colliers.com
carol.warren@colliers.com jim.allen@colliers.com www.colliers.com/Mia.Jarrell
www.colliers.com/Carol.Warren www.colliers.com/Jim.Allen
Christopher Leonard, CCIM Ryan Kratz Mary Clare Codd, CCIM, SIOR RESEARCH CONTACT:
Director, Commercial Sales Executive Vice President Senior Office & Industrial Specialist
christopher.leonard@colliers.com Brokerage | Marketing | Operations maryclare.codd@colliers.com Matt Dolan
www.colliers.com/ ryan.kratz@colliers.com www.colliers.com/MaryClare.Codd
Christopher.Leonard www.colliers.com/Ryan.Kratz GIS & Research Administrator
Claire Calzon Jim Parker, CCIM Melanie Jackson Market: Tampa Bay
Managing Director Director Commercial Services Senior Associate Office Services TEL +1 813 221 2290
Office Services jim.parker@colliers.com melanie.jackson@colliers.com
claire.calzon@colliers.com www.colliers.com/Jim.Parker www.colliers.com/Melanie.Jackson FAX +1 813 224 9403
www.colliers.com/Claire.Calzon
EMAIL matt.dolan@colliers.com
Mackenzie Gerlach Joanne LeBlanc Kevin Yeager
Associate, Investment Services Associate, Office Services Senior Associate, Office Services
mackenzie.gerlach@colliers.com joanne.leblanc@colliers.com kevin.yeager@colliers.com
www.colliers.com/ www.colliers.com/ www.colliers.com/Kevin.Yeager
Mackenzie.Gerlach Joanne.LeBlanc
Copyright @ 2012 Colliers International
The information contained herein has been obtained from sources deemed reliable. While every reasonable effort has been made to ensure its accuracy,
we cannot guarantee it. No responsibility is assumed for any inaccuracies. Readers are encouraged to consult their professional advisors prior to acting
Tampa Bay Florida
on any of the material contained in this report.
This report includes owner and non-owner occupied space 10,000 sf and greater. Directional arrows compare current quarter to previous quarter Accelerating success.
numbers. Arrows show change when there is a 10 cent or more change in lease rate or 0.5% or more change in vacancy rate. Due to continual updates
and refinements in the historical database, some of the data in this report may not match data published in previous reports. Sources: Costar Property
and Colliers International Tampa Bay Florida.
www.colliers.com/marketname