
Recomendados
Recomendados
Mais conteúdo relacionado
Mais procurados
Mais procurados (20)
Destaque
Destaque (14)
Semelhante a Understanding Balance Sheets
Semelhante a Understanding Balance Sheets (20)
Mais de Fred Mmbololo
Mais de Fred Mmbololo (19)
Último
Último (20)
Understanding Balance Sheets
- 1. Summary Purposes of the Balance Sheet 1. A balance sheet, or statement of financial position, summarizes the financial position of a company at a particular date by reporting the economic resources (assets), the economic obligations (liabilities), and equity. It reports a company's resource structure (major classes and amounts of assets) and its financial structure (major classes and amounts of liabilities and equity). It is a detailed explanation of the basic accounting equation: Assets = Liabilities + Stockholders' Equity. 2. The balance sheet information helps external users (a) assess the company's liquidity, financial flexibility, and operating capability, and (b) evaluate its income-producing performance during the period. Liquidity is the speed with which assets can be converted into cash to pay bills. Information about liquidity helps users evaluate the timing of cash flows. This is important in evaluating the amount of future cash flows. 3. A company's capital, its assets less its liabilities, is also called its net assets or owners' equity. By comparing beginning owners' equity with ending owners' equity, the financial statement user can tell whether capital for the accounting period was increased or decreased. Recognition in the Balance Sheet 4. Recognition is the process of formally recording and reporting an element in the financial statements. To be recognized, an item must (a) meet the definition of an element as specified in FASB Statement of Concepts No. 6, (b) be measurable, (c) be relevant, and (d) be reliable. Elements of the Balance Sheet 5. The elements of the balance sheet are the broad classes of items comprising it. These items and their definitions are: a) Assets: The probable future economic benefits obtained or controlled by a company as a result of past transactions or events. b) Liabilities: The probable future sacrifices of economic benefits arising from the present obligations of a company to transfer assets or provide services in the future as a result of past transactions or events. c) Stockholders’ equity: The residual interest in the assets of a company after the liabilities has been deducted. Measurement (Valuation) of the Elements of a Balance Sheet 6. Assets and liabilities must have a monetary value for balance sheet presentation. The FASB has identified five alternative valuation methods. 1
- 2. a) Historical cost is the exchange price of the asset at the time of the original transaction reduced by any recorded depreciation, amortization, or impairment to date. This is the most commonly used valuation. b) Fair Value is the price that a company would receive to sell an asset (or transfer a liability) in an orderly transaction between market participants on the date of measurement. Fair value may be used on a company’s balance sheet to report the value of its “financial” assets (and liabilities), such as cash, accounts receivable, and notes receivable. To increase consistency and comparability in fair value measurements, the FASB established a hierarchy that prioritizes the inputs a company is to use in its valuation method. c) Present value is the net amount of the discounted future cash inflows less the discounted future cash outflows relating to the asset. Reporting Classifications on the Balance Sheet 7. The balance sheet is arranged to be useful to a company’s external users. The individual categories (assets, liabilities, and stockholders’ equity) are further subdivided to provide useful information. These subdivisions are briefly explained below. 8. Current assets are cash and other assets that a company expects to convert into cash, sell, or consume within one year or the normal operating cycle, whichever is longer. An operating cycle, usually a year or less, is the average time taken by a company to spend cash for inventory, process and sell the inventory, and collect the cash from the sale. Current assets are presented in order of liquidity. 9. Current liabilities are obligations that a company expects to liquidate within one year or the operating cycle (if longer) through the use of current assets or the creation of other current liabilities. 10. Working capital is the difference between a company's current assets and its current liabilities. A company's working capital is a measure of the short-run liquidity of the company. 11. Long-term investments are investments that the company plans to hold for more than one year or its operating cycle, if longer. 12. The property, plant, and equipment section of a company's balance sheet includes all tangible assets (fixed assets) used in operations. Except for land, these assets are either depreciated, amortized (for leased assets), or depleted (for natural resource assets). In these cases, a contra-asset account is deducted from the original asset cost in order to display both the historical cost and the book value. 13. Intangible assets are noncurrent economic resources that are used in the operations but that have no physical existence. The value of this type of asset lies in the special right of the company to its use. Intangible assets with finite useful lives (e.g., patents) are amortized over their useful lives, and disclosed on the balance sheet at book value. Intangible assets with indefinite lives (e.g., goodwill) are not amortized but are reviewed for impairment at least annually. They are reported at their historical cost or, if impaired, at their lower fair value. 2
- 3. 14. Long-term liabilities (noncurrent liabilities) are obligations that are not expected to require the use of current assets or not expected to create current liabilities within one year or the operating cycle, if longer. Bonds are usually sold for more than face value (premium) or less than face value (discount). On a balance sheet, bonds are reported at their book value. The book value is the face value of the bonds plus any unamortized premium or less any unamortized discount. 15. The stockholders' equity section of a corporation's balance sheet consists of three main categories: contributed capital, retained earnings, and accumulated other comprehensive income. Contributed capital represents amounts owners have invested in the business. Contributed capital is often separated into capital stock and additional paid-in capital. Corporations may issue two types of capital stock, common and preferred, each of which has distinguishing characteristics. 16. Retained earnings represent the cumulative amount of past net income kept in the business. 17. Accumulated other comprehensive income (loss) includes (a) unrealized gains or losses in the market value of investments in available-for-sale securities, (b) translation adjustments from converting the financial statements of a company's foreign operations into U.S. dollars, (c) certain gains and losses on "derivative" financial instruments, and (d) certain pension liability adjustments. Statement of Changes in Stockholders’ Equity 18. FASB Statement of Concepts No. 6 suggests that financial statements include information about (a) investments by owners, and (b) distributions to owners. To disclose this information as well as the retained earnings changes, a statement of changes in stockholders' equity is often presented as a financial statement. The statement of changes reconciles beginning balances of capital stock, additional paid-in capital, retained earnings, and accumulated other comprehensive income to their ending balances by showing the changes in each item. Other Disclosure Issues 19. Because all of the relevant financial information pertaining to a company's activities cannot be disclosed directly in the body of the financial statements, a company will make additional disclosures in the notes to the financial statements. 20. APB Opinion No. 22 requires disclosure in a company’s notes of information related to its accounting policies. This disclosure includes revenue recognition and asset allocation principles that involve: (a) a selection from existing alternatives, (b) principles peculiar to a specific industry, or (c) an innovative application of an accounting principle. 21. A company discloses contingent liabilities (loss contingencies) in the notes to the financial statements if there is only a reasonable possibility that the loss may have been incurred or if the amount of the loss cannot be reasonably estimated. If it is probable that the loss has been incurred and if the amount can be reasonably estimated, an estimated loss from a loss contingency is accrued and reported directly on the balance sheet as a liability or a reduction of an asset. Gain contingencies are not reported in the financial statements and should be judiciously explained if disclosed in the notes. Gain 3
- 4. contingencies are not reported in a company’s financial statements and, if disclosed in a note, should be carefully explained in order to avoid misleading implications as to the likelihood of future revenues or gains. 22. Another common note to the financial statements is a description of an important event that occurs between the balance sheet date and the date of issuance of the annual report. This is called a subsequent event. Subsequent events must be disclosed so that users may interpret the financial statements in light of the most recent company information. If a subsequent event provides information about conditions that existed on the balance sheet date and significantly affect the estimates used in the preparation of the financial statements, the company adjusts the statements themselves. 23. Most users of financial statements are interested in evaluating trends of the company over time. For this reason, financial statements are usually prepared on a comparative basis by presenting information for the current and preceding year side by side. 24. Through the SEC's "integrated disclosures" provision, companies regulated by the SEC now satisfy certain Form 10-K disclosure requirements by reference to information included in the annual report. Therefore, these companies include (a) comparative balance sheets for two years and comparative income statements and statements of cash flows for three years; (b) a five-year summary of critical accounting information; (c) management's discussion and analysis (MD&A) of the company's financial condition, changes in financial condition, and results of operations; and (d) disclosures on common stock market prices and dividends. Each company’s chief executive officer and chief financial officer both must “certify” that the company’s annual report in the Form 10-K (or interim report within the company’s Form 10-Q) is both complete and accurate. 25. The IASB sets international accounting standards for published financial statements that are similar to those in the United States. Under the International Accounting Standards, a balance sheet, statement of changes in equity, income statement, and statement of cash flows are required as well as related notes and explanatory materials. In general, classification of items and disclosures are similar to that required under U.S. GAAP. However, on the balance sheet, the liabilities and owners' equity sections are usually ordered differently. 4
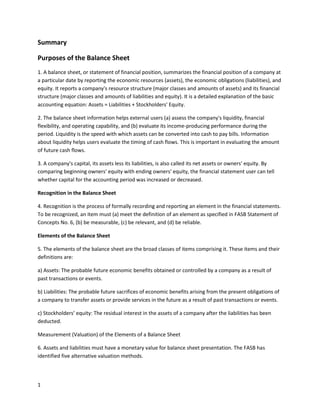
- 5. Examples of balance sheets using 100 ftse companies: Consolidated balance sheet At 28 February 2013 Whitbread 28 February 1 March 2013 2012 £m £m ASSETS Non-current assets Intangible assets Property, plant and equipment Investment in joint ventures 215.4 206.6 2,748.9 2,580.5 24.0 18.7 Investment in associate 1.7 1.6 Derivative financial instruments 7.1 - Trade and other receivables 5.3 3.6 Other financial assets - - 3,002.4 2,811.0 Current assets Inventories Trade and other receivables Cash and cash equivalents Derivative financial instruments 26.5 23.1 102.1 85.0 40.8 40.3 1.4 170.8 Assets held for sale Total assets 148.4 1.5 0.6 3,174.7 2,960.0 9.0 14.2 10.3 10.7 LIABILITIES Current liabilities Financial liabilities Provisions Derivative financial instruments Trade and other payables 6.6 37.7 15.4 347.6 321.3 409.2 Income tax liabilities 4.6 368.2 Non-current liabilities Financial liabilities 502.9 530.4 Provisions 32.6 37.1 Derivative financial instruments 18.7 20.1 Deferred income tax liabilities 106.7 105.9 Pension liability 541.7 598.7 Trade and other payables 17.6 16.4 1,220.2 1,308.6 Total liabilities 1,629.4 1,676.8 Net assets 1,545.3 1,283.2 Equity Share capital 148.3 147.5 Share premium 55.1 53.7 Capital redemption reserve 12.3 12.3 3,408.8 3,163.0 Retained earnings Currency translation reserve Other reserves Equity attributable to equity holders of the parent Non-controlling interest Total equity 5 4.7 3.7 (2,094.7) (2,103.4) 1,534.5 1,276.8 10.8 6.4 1,545.3 1,283.2
- 6. MARKS & SPENSER CONSOLIDATED BALANCE SHEET AS AT 31/03/2012 As at 31 March 2012 As at 2 April 2011 £ millions ASSETS Non-current assets Intangible assets Property, plant and equipment Investment Property Investments in joint ventures & associates Other financial assets Retirement benefit assets Trade and other receivables Derivative financial instruments 584.30 4,789.90 15.90 14.40 3.00 91.30 270.20 44.20 5,813.20 527.70 4,662.20 16.00 13.00 3.00 182.60 276.10 21.80 5,702.40 681.90 260.50 253.00 67.00 1.60 196.10 1,460.10 7,273.30 685.30 215.90 250.30 18.40 1.60 470.20 1,641.70 7,344.10 (1,449.10) (327.70) (71.90) (60.50) (8.40) (87.80) (2,005.40) (1,347.60) (602.30) (71.90) (50.70) (22.70) (115.00) (2,210.20) (545.30) (30.00) (13.30) (280.80) (1,948.10) (27.20) (24.00) (195.70) (14.10) (262.30) (1,924.10) (37.50) (22.00) (196.50) (2,489.10) (2,456.50) (4,494.50) (4,666.70) 2,778.80 2,677.40 401.40 294.30 2,202.60 14.80 (6,114.30) 5,991.40 2,790.20 (11.40) 396.20 255.20 2,202.60 (11.30) (6,042.40) 5,873.20 2,673.50 3.90 2,778.80 2,677.40 Current assets Inventories Other financial assets Trade and other receivables Derivatives Current tax assets Cash and cash equivalents Total assets Current liabilities Trade and other payables Borrowings Partnership liability to M & S Uk pension scheme Derivative financial instruments Provisions Current tax liabilities Net working capital = Current assets minus current liabilities Non-current liabilities Retirement benefit deficit Trade & Other payables Borrowings & other financial liabilities Derivatives financial instruments Provisions Deferred tax liabilities Total liabilities Net assets Equity Issued Share Capital Share Premium account Capital redemption reserve Hedging reserves Other reserves Retained earnings Total attributable to equity shareholders of the company Non-controlling interests Total Equity 6
- 7. KINGFISHER CONSOLIDATED BALANCE SHEET AS AT 28/01/2012 £ millions Non-current assets Goodwill Other intangible assets Property, plant and equipment Investment Property Investments in joint ventures & associates Post employment benefits Deferred tax assets Derivatives Other receivables 2011/12 2010/11 2,397.00 123.00 3,667.00 55.00 271.00 25.00 23.00 66.00 17.00 6,644.00 2,395.00 86.00 3,632.00 32.00 259.00 27.00 62.00 15.00 6,508.00 1,844.00 531.00 26.00 1.00 587.00 2,989.00 9,633.00 1,791.00 513.00 15.00 45.00 731.00 3,095.00 9,603.00 (2,356.00) (367.00) (6.00) (305.00) (16.00) (3,050.00) (2,519.00) (196.00) (11.00) (372.00) (27.00) (3,125.00) (61.00) (30.00) (121.00) (375.00) (8.00) (269.00) (43.00) (40.00) (856.00) (76.00) (577.00) (17.00) (238.00) (52.00) (58.00) (1,018.00) (3,906.00) (4,143.00) 5,727.00 5,460.00 Share Capital Share Premium Own Shares held Retained earnings Other reserves Total attributable to equity shareholders of the company Non-controlling interests 372.00 2,199.00 (134.00) 2,869.00 413.00 371.00 2,194.00 (42.00) 2,390.00 539.00 5,719.00 8.00 5,452.00 8.00 Total Equity 5,727.00 5,460.00 Current assets Inventories Trade and other receivables Derivatives Current tax assets Cash and cash equivalents Total assets Current liabilities Trade and other payables Borrowings Derivatives Current tax liabilities Provisions Net working capital = Current assets minus current liabilities Non-current liabilities Other payables Borrowings Derivatives Deferred tax liabilities Provisions Post employment benefits Total liabilities Net assets Equity 7
- 8. REUTERS GROUP CONSOLIDATED BALANCE SHEET AS AT 31/12/2012 2012 2011 1,423.00 1,682.00 8,135.00 16,256.00 360.00 515.00 50.00 28,421.00 1,509.00 1,640.00 8,471.00 15,932.00 425.00 535.00 50.00 28,562.00 1,301.00 1,835.00 72.00 641.00 3,849.00 302.00 4,151.00 422.00 1,984.00 100.00 641.00 3,147.00 767.00 3,914.00 32,572.00 32,476.00 Current Indebtedness Payables, Accruals & Provisions Deferred Revenue Other financial liabilities Current tax liabilities Excluding Liabilities Associated with Assets Held for Sale Liabilities Associated with Assets Held for Sale (1,008.00) (2,633.00) (1,224.00) (95.00) (4,960.00) (434.00) (2,675.00) (1,379.00) (81.00) (4,569.00) (35.00) (35.00) Current Liabilities (4,995.00) (4,604.00) (844.00) (690.00) (6,223.00) (2,514.00) (37.00) (1,305.00) (7,160.00) (2,513.00) (27.00) (1,422.00) (15,074.00) (15,726.00) Capital Retained earnings Accumulated Other Comprehensive Loss Total attributable to equity shareholders of the company Non-controlling interests Total Equity (10,371.00) (8,311.00) 1,537.00 (17,145.00) (353.00) (17,498.00) (10,288.00) (7,633.00) 1,516.00 (16,405.00) (345.00) (16,750.00) Total Liabilities and Equity (32,572.00) (32,476.00) £ millions Non-current assets Computer Hardware & Other Property, Net Computer Software, Net Other Identifiable Intangible Assets, Net Goodwill Other Financial assets Other Non-current Assets Deferred tax assets Current assets Cash and cash equivalents Trade and other receivables Other financial assets Prepaid Expenses & Other current assets Current assets Excluding Assets Held for Sale Assets Held for Sale Current Assets Total assets Liabilities and Equity Net working capital = Current assets minus current liabilities Non-current liabilities Long-Term Indebtedness Provisions & Other Non-current liabilities Other financial Liabilities Deferred tax liabilities Total liabilities Equity 8
- 9. ITV CONSOLIDATED BALANCE SHEET AS AT 31/12/2012 2012 Assets and Liabilities Non-current assets Gross Property, plant and equipment Accumulated Depreciation Net Property, plaint and equipment Goodwill Long-Term Investments Deferred tax Assets, Long term Other Iong-term assets Other financial assets 325.00 (169.00) 156.00 751.00 253.00 93.00 162.00 36.00 1,451.00 Current assets Cash and Equivalents Trading Asset Securities 690.00 - Total Cash & Short term investments Accounts receivable Other receivables Total receivables Inventory Prepaid expenses Other current assets Total current assets 690.00 278.00 43.00 321.00 96.00 58.00 179.00 1,344.00 Total assets 2,795.00 Current Liabilities Current portion of Capital Lease Obligations Other current liabilities Total Current liabilities Net working capital = Current assets minus current liabilities (7.00) (699.00) (706.00) 638.00 Non Current liabilities Borrowings Provisions Other Non-current liabilities Other liabilities Total liabilities Net assets (632.00) (12.00) (613.00) N/A (1,257.00) (1,963.00) 832.00 Equity: Common Stock Additional Paid in Capital Retained earnings Comprehensive Income & Other Total Common Equity Minority Interest Total Equity Total liabilities and Equity 9 391.00 122.00 1.00 303.00 817.00 15.00 832.00 2,795.00
- 10. TESCO CONSOLIDATED BALANCE SHEET AS AT 25/02/2012 £ millions Non-current assets Goodwill & Other intangible assets Property, plant and equipment Investment Property Investments in joint ventures & associates Other investments Loans & advances to customers Derivatives financial instruments Deferred tax assets 2012 4,618.00 25,710.00 1,991.00 423.00 1,526.00 1,901.00 1,726.00 23.00 37,918.00 Current assets Inventories Trade and other receivables Loans & advances to customers Derivative financial instruments Current tax assets Short-term investments Cash and cash equivalents 3,598.00 2,657.00 2,502.00 41.00 7.00 1,243.00 2,305.00 12,353.00 Assets of the disposal group and non-current assets classified as held for sale 510.00 12,863.00 Total assets 50,781.00 Current liabilities Trade and other payables (11,234.00) Financial Liabilities Borrowings Derivative financial instruments & other liabilities Customer deposits & deposits by banks Current tax liabilities Provisions Liabilities of the disposal group classified as held for sale Net current liabilities Net working capital = Current assets minus current liabilities (1,838.00) (128.00) (5,465.00) (416.00) (99.00) (19,180.00) (69.00) (6,386.00) (6,386.00) Non-current liabilities Financial liabilities Borrowings Derivative financial instruments & other liabilities Post employment benefits Deferred tax liabilities Provisions Total non current liabilities Net assets (9,911.00) (688.00) (1,872.00) (1,160.00) (100.00) (13,731.00) 17,801.00 Equity Share Capital Share Premium Other reserves Retained earnings Equity attributable to owner's of the parent Non-controlling interests Total Equity 10 402.00 4,964.00 40.00 12,369.00 17,775.00 26.00 17,801.00