TTK Healthcare Q4FY15: Net profit up 40.48% y/y to INR45.67m; Buy
•
1 gostou•371 visualizações

TTK Healthcare: Q4FY15 net profit up 40.48% y/y to INR45.67m, Firstcall recommend 'buy'

Recomendados
Recomendados
Mais conteúdo relacionado
Mais procurados
Mais procurados (20)
Semelhante a TTK Healthcare Q4FY15: Net profit up 40.48% y/y to INR45.67m; Buy
Semelhante a TTK Healthcare Q4FY15: Net profit up 40.48% y/y to INR45.67m; Buy (19)
Mais de IndiaNotes.com
Mais de IndiaNotes.com (20)
Último
Último (20)
TTK Healthcare Q4FY15: Net profit up 40.48% y/y to INR45.67m; Buy
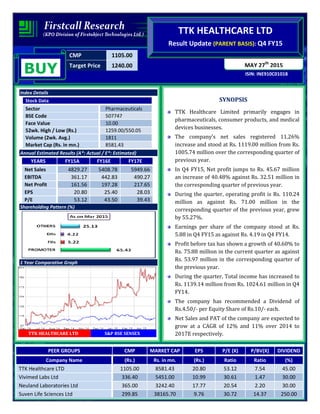
- 1. CMP 1105.00 Target Price 1240.00 ISIN: INE910C01018 MAY 27th 2015 TTK HEALTHCARE LTD Result Update (PARENT BASIS): Q4 FY15 BUY Index Details Stock Data Sector Pharmaceuticals BSE Code 507747 Face Value 10.00 52wk. High / Low (Rs.) 1259.00/550.05 Volume (2wk. Avg.) 1811 Market Cap (Rs. in mn.) 8581.43 Annual Estimated Results (A*: Actual / E*: Estimated) YEARS FY15A FY16E FY17E Net Sales 4829.27 5408.78 5949.66 EBITDA 361.17 442.83 490.27 Net Profit 161.56 197.28 217.65 EPS 20.80 25.40 28.03 P/E 53.12 43.50 39.43 Shareholding Pattern (%) 1 Year Comparative Graph TTK HEALTHCARE LTD S&P BSE SENSEX SYNOPSIS TTK Healthcare Limited primarily engages in pharmaceuticals, consumer products, and medical devices businesses. The company’s net sales registered 11.26% increase and stood at Rs. 1119.00 million from Rs. 1005.74 million over the corresponding quarter of previous year. In Q4 FY15, Net profit jumps to Rs. 45.67 million an increase of 40.48% against Rs. 32.51 million in the corresponding quarter of previous year. During the quarter, operating profit is Rs. 110.24 million as against Rs. 71.00 million in the corresponding quarter of the previous year, grew by 55.27%. Earnings per share of the company stood at Rs. 5.88 in Q4 FY15 as against Rs. 4.19 in Q4 FY14. Profit before tax has shown a growth of 40.60% to Rs. 75.88 million in the current quarter as against Rs. 53.97 million in the corresponding quarter of the previous year. During the quarter, Total income has increased to Rs. 1139.14 million from Rs. 1024.61 million in Q4 FY14. The company has recommended a Dividend of Rs.4.50/- per Equity Share of Rs.10/- each. Net Sales and PAT of the company are expected to grow at a CAGR of 12% and 11% over 2014 to 2017E respectively. PEER GROUPS CMP MARKET CAP EPS P/E (X) P/BV(X) DIVIDEND Company Name (Rs.) Rs. in mn. (Rs.) Ratio Ratio (%) TTK Healthcare LTD 1105.00 8581.43 20.80 53.12 7.54 45.00 Vivimed Labs Ltd 336.40 5451.00 10.99 30.61 1.47 30.00 Neuland Laboratories Ltd 365.00 3242.40 17.77 20.54 2.20 30.00 Suven Life Sciences Ltd 299.85 38165.70 9.76 30.72 14.37 250.00
- 2. QUARTERLY HIGHLIGHTS (PARENT BASIS) Results Updates- Q4 FY15, TTK Healthcare Limited primarily engages in pharmaceuticals, consumer products, and medical devices businesses, reported its financial results for the quarter ended 31st March, 2015. The company’s net profit jumps to Rs. 45.67 million against Rs. 32.51 million in the corresponding quarter ending of previous year, an increase of 40.48%. Revenue for the quarter rose by 11.26% to Rs. 1119.00 million from Rs. 1005.74 million, when compared with the prior year period. Reported earnings per share of the company stood at Rs. 5.88 a share during the quarter against Rs. 4.19 in the corresponding period of the previous year. Profit before interest, depreciation and tax is Rs 110.24 million as against Rs. 71.00 million in the corresponding period of the previous year. Break up of Expenditure Months Mar-15 Mar-14 % Change Net Sales 1119.00 1005.74 11.26 PAT 45.67 32.51 40.48 EPS 5.88 4.19 40.48 EBITDA 110.24 71.00 55.27 Break up of Expenditure (Rs in millions) Q4 FY15 Q4 FY14 % CHNG Cost of Materials Consumed 70.35 60.44 16% Purchase of stock-in-trade 421.40 415.36 1% Employee Benefits Expense 189.93 158.56 20% Depreciation & Amortization Expense 24.72 9.24 168% Marketing Expenses 135.57 140.38 -3% Other Expenses 210.25 193.22 9%
- 3. Segment Revenue COMPANY PROFILE The company was incorporated in 1958 and is headquartered in Chennai, India. TTK Healthcare Limited operates as a subsidiary of TT Krishnamachari & Co., Ltd. TTK Healthcare Limited primarily engages in pharmaceuticals, consumer products, and medical devices businesses. The company’s Pharmaceuticals division deals in herbal and allopathic formulations in various therapeutic areas. It offers delivery care, female healthcare, haematinic, pain management, neurotrophic, gastro intestinal, male and female fertility, nutrition, cardiac care, derma, urinary specialties, and respiratory care products, as well as calcium supplements. The company’s Consumer Products division is involved in the marketing of products under its own brands, including Woodward's Gripe Water and Baby Soap, EVA deodorants and talc products, and the Good Home range of homecare products; and handling the distribution of Brylcreem haircare and toiletry products. Its Medical Devices division manufactures and distributes heart valve prosthesis; and focuses on the development of orthopedic implants and instruments under the Altius brand name. Product range of the company includes: Personal care • Eva range of women’s personal care products Pharmaceuticals • Calcium Supplement Range
- 4. • Delivery Care Range • Women's Care Range • Haematinic Range • Pain Management Range • Neurotrophic Range • Gastro Intestinal Range • Male Fertility Range • Nutritional Range • Cardiac Care Range Baby Care • Woodward’s Baby Bath • Woodward’s Gripe Water Animal Care • Livestock- Wide range of medicines, tonics and productivity boosters. • Poultry- High quality medicines and feed supplements for good productivity • Medicines, tonics and supplements for Pets. • Heart Valve - India's first indigenous heart valve prosthesis - the tilting-disc TTK Chitra Heart Valve. Food • TTK Ready-to-fry Snack Pellets are available in a variety of flavors, shapes, colours and designs.
- 5. FINANCIAL HIGHLIGHT (PARENT BASIS) (A*- Actual, E* -Estimations & Rs. In Millions) Balance Sheet as at March 31, 2014 -2017E FY14A FY15A FY16E FY17E SOURCES OF FUNDS Shareholder's Funds Share Capital 77.66 77.66 77.66 77.66 Reserves and Surplus 991.60 1105.05 1215.56 1342.04 1. Sub Total - Net worth 1069.26 1182.71 1293.22 1419.70 Non Current Liabilities Long term Borrowings 158.66 159.84 167.83 177.90 Deferred Tax Liabilities 29.47 22.26 24.26 25.72 Other Long term Liabilities 84.18 96.56 107.18 116.83 2. Sub Total - Non Current Liabilities 272.31 278.66 299.28 320.45 Current Liabilities Short term Borrowings 132.40 223.01 278.76 326.15 Trade Payables 299.46 300.69 318.73 331.48 Other Current Liabilities 589.53 724.73 833.44 933.45 Short Term Provisions 36.45 42.17 46.81 49.62 3. Sub Total - Current Liabilities 1057.84 1290.60 1477.74 1640.70 Total Liabilities (1+2+3) 2399.41 2751.97 3070.23 3380.85 APPLICATION OF FUNDS Non-Current Assets a) Fixed Assets 556.35 975.72 1114.82 1255.47 b) Long Term loans and advances 214.32 115.25 140.61 163.10 1. Sub Total - Non Current Assets 770.67 1090.97 1255.43 1418.57 Current Investment 1.34 1.34 1.54 1.76 Inventories 339.51 373.77 403.67 427.89 Trade receivables 382.99 444.13 501.87 562.09 Cash and Bank Balances 840.59 773.00 834.84 893.28 Short-terms loans & advances 64.31 68.76 72.89 77.26 2. Sub Total - Current Assets 1628.74 1661.00 1814.81 1962.28 Total Assets (1+2) 2399.41 2751.97 3070.23 3380.85
- 6. Annual Profit & Loss Statement for the period of 2014 to 2017E Value(Rs.in.mn) FY14A FY15A FY16E FY17E Description 12m 12m 12m 12m Net Sales 4161.80 4829.27 5408.78 5949.66 Other Income 61.24 65.68 69.62 73.80 Total Income 4223.04 4894.95 5478.40 6023.46 Expenditure -3964.76 -4533.78 -5035.58 -5533.18 Operating Profit 258.28 361.17 442.83 490.27 Interest -29.88 -36.42 -41.52 -45.26 Gross profit 228.40 324.75 401.31 445.02 Depreciation -31.74 -61.40 -77.36 -92.84 Profit Before Tax 196.66 263.35 323.94 352.18 Tax -72.77 -101.79 -126.66 -134.53 Net Profit 123.89 161.56 197.28 217.65 Equity capital 77.66 77.66 77.66 77.66 Reserves 946.46 1060.40 1198.25 1342.04 Face value 10.00 10.00 10.00 10.00 EPS 15.95 20.80 25.40 28.03 Quarterly Profit & Loss Statement for the period of 30th Sep, 2014 to 30th June, 2015E Value(Rs.in.mn) 30-Sep-14 31-Dec-14 31-Mar-15 30-Jun-15E Description 3m 3m 3m 3m Net sales 1204.31 1208.29 1119.00 1298.04 Other income 15.90 15.10 20.14 22.15 Total Income 1220.21 1223.39 1139.14 1320.19 Expenditure -1138.79 -1131.66 -1028.90 -1199.39 Operating profit 81.42 91.73 110.24 120.81 Interest -7.56 -9.41 -9.64 -10.99 Gross profit 73.86 82.32 100.60 109.82 Depreciation -12.24 -13.06 -24.72 -27.34 Profit Before Tax 61.62 69.26 75.88 82.48 Tax -23.81 -27.35 -30.21 -31.82 Net Profit 37.81 41.91 45.67 50.66 Equity capital 77.66 77.66 77.66 77.66 Face value 10.00 10.00 10.00 10.00 EPS 4.87 5.40 5.88 6.52
- 7. Ratio Analysis Particulars FY14A FY15A FY16E FY17E EPS (Rs.) 15.95 20.80 25.40 28.03 EBITDA Margin (%) 6.21 7.48 8.19 8.24 PBT Margin (%) 4.73 5.45 5.99 5.92 PAT Margin (%) 2.98 3.35 3.65 3.66 P/E Ratio (x) 69.27 53.12 43.50 39.43 ROE (%) 12.10 14.20 15.46 15.33 ROCE (%) 22.05 27.78 30.20 30.31 Debt Equity Ratio 0.28 0.34 0.35 0.36 EV/EBITDA (x) 31.09 22.68 18.50 16.71 Book Value (Rs.) 131.87 146.54 164.29 182.81 P/BV 8.38 7.54 6.73 6.04 Charts
- 8. OUTLOOK AND CONCLUSION At the current market price of Rs. 1105.00, the stock P/E ratio is at 43.50 x FY16E and 39.43 x FY17E respectively. Earnings per share (EPS) of the company for the earnings for FY16E and FY17E are seen at Rs. 25.40 and Rs. 28.03 respectively. Net Sales and PAT of the company are expected to grow at a CAGR of 12% and 11% over 2014 to 2017E respectively. On the basis of EV/EBITDA, the stock trades at 18.50 x for FY16E and 16.71 x for FY17E. Price to Book Value of the stock is expected to be at 6.73 x and 6.04 x for FY16E and FY17E respectively. We recommend ‘BUY’ in this particular scrip with a target price of Rs. 1240.00 for Medium to Long term investment. INDUSTRY OVERVIEW The Indian pharmaceuticals market is third largest in terms of volume and thirteen largest in terms of value, as per a pharmaceuticals sector analysis report by equity master. The market is dominated majorly by branded generics which constitute nearly 70 to 80 per cent of the market. Considered to be a highly fragmented industry, consolidation has increasingly become an important feature of the Indian pharmaceutical market. India has achieved an eminent global position in pharma sector. The country also has a huge pool of scientists and engineers who have the potential to take the industry to a very high level. The UN-backed Medicines Patents Pool has signed six sub-licenses with Aurobindo, Cipla, Desano, Emcure, Hetero Labs and Laurus Labs, allowing them to make generic anti-AIDS medicine Tenofovir Alafenamide (TAF) for 112 developing countries. The Indian pharmaceutical industry is estimated to grow at 20 per cent compound annual growth rate (CAGR) over the next five years, as per India Ratings, a Fitch Group company. Indian pharmaceutical manufacturing facilities registered with US Food and Drug Administration (FDA) as on March 2014 was the highest at 523 for any country outside the US. We expect the domestic pharma market to grow at 10-12 per cent in FY15 as compared to 9 per cent in FY14, as per a recent report from Centrum Broking. The domestic pharma growth rate was 11.9 per cent in October 2014, highlighted the report. Gujarat clocked the highest growth rate in pharmaceuticals market at 22.4 per cent during November 2014, surpassing the industry growth rate, which grew by 10.9 per cent, as per data from the market research firm AIOCD Pharma softtech AWACS.
- 9. Outlook The Indian pharma market size is expected to grow to US$ 85 billion by 2020. The growth in Indian domestic market will be on back of increasing consumer spending, rapid urbanization, raising healthcare insurance and so on. Going forward, better growth in domestic sales will depend on the ability of companies to align their product portfolio towards chronic therapies for diseases such as such as cardiovascular, anti-diabetes, anti-depressants and anti-cancers are on the rise. Moreover, the government has been taking several cost effective measures in order to bring down healthcare expenses. Thus, governments are focusing on speedy introduction of generic drugs into the market. This too will benefit Indian pharma companies. In addition, the thrust on rural health programmes, life saving drugs and preventive vaccines also augurs well for the pharma companies. Disclaimer: This document is prepared by our research analysts and it does not constitute an offer or solicitation for the purchase or sale of any financial instrument or as an official confirmation of any transaction. The information contained herein is from publicly available data or other sources believed to be reliable but we do not represent that it is accurate or complete and it should not be relied on as such. Firstcall Research or any of its affiliates shall not be in any way responsible for any loss or damage that may arise to any person from any inadvertent error in the information contained in this report. Firstcall Research and/ or its affiliates and/or employees will not be liable for the recipients’ investment decision based on this document.
- 10. Firstcall India Equity Research: Email – info@firstobjectindia.com C.V.S.L.Kameswari Pharma & Diversified U. Janaki Rao Capital Goods B. Anil Kumar Auto, IT & FMCG M. Vinayak Rao Diversified C. Bhagya Lakshmi Diversified G. Amarender Diversified Firstcall Research Provides Industry Research on all the Sectors and Equity Research on Major Companies forming part of Listed and Unlisted Segments For Further Details Contact: Tel.: 022-2527 2510/2527 6077 / 25276089 Telefax: 022-25276089 040-20000235 /20000233 E-mail: info@firstobjectindia.com www.firstcallresearch.com