SlideShare a Scribd company logo
1 of 9
Download to read offline
IOSR Journal of Agriculture and Veterinary Science (IOSR-JAVS)
e-ISSN: 2319-2380, p-ISSN: 2319-2372. Volume 5, Issue 1 (Sep.- Oct. 2013), PP 62-70
www.iosrjournals.org

Genotype × Environment Interaction and Stability Analysis in
Mungbean
Disharee Nath* and Tapash Dasgupta
Department of Genetics and Plant Breeding Institute of Agricultural Science University of Calcutta 51/2 Hazra
Road Kolkata – 700019, West Bengal, India

Abstract: Mungbean is an important grain legume widely grown in India. Thirty genotypes of mungbean
developed through mutation breeding from three parents namely B1, B105 and SML32 were evaluated on seven
environments of West Bengal, India. Stability parameters were computed to know genotype x environment
interaction and genotypic performance for yield per plant and its components. Wide range of variation was
observed for seed yield and components across environments. Genotypes were grown best in sandy-loam
textured soil coupled with low pH (5.7), indicating acidity and moderate water holding capacity, accompanied
with higher proportion of available nitrogen percentage, moderate P2O5 and organic C. The analysis of
variance showed highly significant variance for genotypes, environments and genotype x environment
interaction. The significance of genotype x environment interaction accentuated the implication of stability
analysis in crop improvement programme. The analysis of variance exhibited comparatively higher magnitudes
of linear components than the non linear components and thus the characters were predictable in nature.
Identification of stable genotypes over environments was done by stability analysis following model of Eberhart
and Russell. Sustainability index was also estimated for searching the stable genotypes. In most of the cases, the
stability for yield components was concomitant with stability for seed yield per plant. Four mutant genotypes
namely CUM1, CUM4, CUM10 and CUM13 registered average stability coupled with high mean performance
for seed yield per plant and components consistently, based on regression parameters and sustainability index.
Keywords: Genotype x environment interaction, Mungbean, Stability, Sustainability index

I.

Introduction

Mungbean (Vigna radiata L. Wilczek ), a short duration grain legume, is one of the most important
pulse crops grown all over India. Mungbean ranks third among pulse crops of India covering approximately 3
million hectares, with the production of about 1 million tonnes accounting for 12% of the total pulse acreage.
The earlier research works were more focused to improve the crop largely through simple procedures of
selection with or without hybridization from local collections. The existing genetic variability of mungbean is a
great concern for which conventional selection may not be effective.
Mutation breeding is already an established technology. Ionizing radiation such as X-rays, γ-rays,
neutrons have already been used in mungbean for inducing variations (Nilan and Konzak, 1961; Matsumura et
al., 1963; Juran et al., 1986; Klu et al., 1997). In other crops also successful reports are available like in wheat
(Giroux, 1998), rice (Chakraborty, 1995), sweet corn and maize (Hannah et al., 1993) and pea (Macleod, 1994).
Yield, a complex quantitative character, depends upon interactions of multiple component characters.
Undesirable linkage among yield components sometimes deters the overall improvement of yield (Webb et al.,
1968). Mutagenic treatments can cause alterations in negative association of characters (Hensz, 1991; Lapade et
al., 1995) which were originally undesirable from the production point of view. On the contrary, it is true that
only few mutants in general, turn out to be useful or desirable when any mutagen is exercised for improvement.
Nevertheless, the resultant mutants seemed to be very precious which otherwise may not be possible to achieve.
An ideal variety always combines high yield with stability of performance (Eberhart and Russell,
1966). The genotype × environment is the main bottleneck which can vitiate entire efforts of a plant breeder for
boosting higher yield. Thus, breeding for climate or environment resilient varieties is crucial (Allard and
Bradshaw, 1964). Several methods of simultaneous selection for yield and stability and relations among them
were discussed by Kang and Pham (1991) and Kang (1998).
The phenotype has been confidently defined as a linear function of genotype, environment and
interaction between two (Lu et al., 1986; Scheiner, 1993). The works of various scientists viz., Immer and
Power (1934), Salmon (1951), Horner and Frey (1957) and Sandison and Barlett (1958) reflected that variety ×
season interactions were basic estimates of adaptability. Yates and Cochran (1938) subdivided the genotype ×
environment interactions into linear and nonlinear partitions. Eberhart and Russell (1966) developed a model
based on the regression technique for measuring the stability of populations grown from single and thee-way
crosses of maize. Numerous statistics, parametric as well as non–parametric have been proposed for the
measurement of yield stability (Wricke, 1962; Finlay and Wilkinson, 1963; Eberhart and Russell, 1966; Perkins
www.iosrjournals.org

62 | Page
Genotype × Environment Interaction and Stability Analysis in Mungbean
and Jinks, 1968; Hanson, 1970; Tai, 1971 and Nassar and Huhn, 1987). Depending upon the final goal of the
breeder and the character under consideration, two concepts of stability were of great importance for biological
and agronomic concept (Backer, 1981). The concept of genotype-environment interactions leads to measure the
agronomic stability of the genotype. Under the biological concept stable genotype is one, whose phenotype
shows little deviation from the expected character level when performance of genotype is tested over a number
of environments.
Plant improvement involves jointly the manipulation of genetic characteristics to
optimize productivity in relation to the limitations of the environmental factors. However, lack of intensive
systematic research efforts on mungbean stands as a barrier to its improvement, which needs a comprehensive
and diversified approach. Elite or promising varieties with advantageous yield contributing characters adaptable
for West Bengal, India as a whole still are of in need. The present study, aimed at identifying stable elite and
promising mutant lines, especially for agro-climatic situations of West Bengal, India.

II.

Materials and Methods

The elite mutant lines chosen in the investigation were (Table 1) developed from three parents namely
B1, B105 and SML32 at Agricultural Experimental Farm of Calcutta University, Baruipur, South 24-Parganas,
West Bengal, India (Latitude: 22.3497N, Longitude: 88.4392E, Altitude: 29”). The lines along with their parents
(checks) were grown in different agro-ecological locations over seasons following normal cultural practices.
Lines were grown in three replications in RBD design and spacing of 45 cm was maintained between family
rows and 10 cm between plants in a row of 3m long. Ten randomly selected plants of each genotype from each
replication excluding the border plants were chosen and tagged for recording observation. Altogether
experiments were conducted at different locations and seasons which constituted seven environments and were
referred as E1, E2, E3, E4, E5, E6, and E7.
II.I Observations recorded
Ten plants from each replication were selected for data recording and finally averaged. The data of
each mutant included yield and yield components namely 1) Number of pods per plant; 2) Number of pods per
cluster; 3) Pod length (cm); 4) Number of seeds per pod; 5) Number of seeds per plant; 6) 100-seeds weight (g);
7) Seed yield per plant (g).
II.II Stability Analysis
The stability analysis was done according to the models of Eberhart and Russell (1966). The model is
defined as follows :
Where, Yij = mean of the ith genotype at the jth environment, (i =1,2,….,v; j = 1,2,…..n)
µi = mean of the ith genotype over all environments,
bi = regression coefficient that measures the response of the ith genotype to varying
environments,
δij = deviation from regression of the ith genotype at the jth environment and
Ij = environmental index obtained as the mean of all the genotypes at the jth
environment minus the grand mean

II.III Stability Parameters
In the present study an overview of the parametric stability measures and their underlying stability
concepts are presented in Table 2.
II.IV Measurement of two parameters by Eberhart and Russell (1966) method
The first stability parameter is a regression coefficient and was estimated as follows :
bi =
=
=
The estimated value of bi for each genotype was tested by the following formula and against table value
of t at pooled error d.f. :

www.iosrjournals.org

63 | Page
Genotype × Environment Interaction and Stability Analysis in Mungbean

As a second measure, they considered the deviation from regression as follows:

and
= estimate of the pooled error (or the variance of a genotype mean of the jth environment ).
The deviation from regression for each genotype was tested by the following formula:
Eberhart and Russell (1966) defined desirable criteria for stability as bi ≈ 1 and s2di ≈ 0 while genotypes
with bi < 1.0 usually had below average stability.
II.V Measurement of Sustainability Index (S.I.)
Sustainability index was estimated by following the formula used by other workers (Singh and
Agarwal, 2003; Gangwar et al., 2004 and Tuteja, 2006, Atta et al., 2009).
Where Y = Average performance of a genotype, σn = Standard deviation and Y M = Best performance of a
genotype in a year.
The values of sustainability index were divided arbitrarily into 5 groups viz. very low (upto 20%), low
(21 - 40%), moderate (41 - 60%), high (61-80%) and very high (above 80%).

III.

Results and Discussion

Inconsistency of seed yield often experienced in mungbean, is due to its differential response of
genotypes to various growing season or conditions. In general, productivity of a plant is influenced by several
factors such as climate, soil type, photoperiodic response and micro-environments (Hamblin et al., 1978). Thus,
the significance of genotype x environment interaction for obvious reason deserves high priority in any crop
improvement program. Promising genotypes need to be evaluated in multi-environmental test over several years
for identification of the stable and widely adapted genotypes. The present study was undertaken to assess
genotype x environment interaction for seed yield/plant and its component character for identifying stable and
superior genotypes over varied environments.
The environmental influence disguised expression of the characters and varied genotypic responses
were observed over seven environments in different seasons. The tested genotypes when averaged over all
environments exhibited a wide range of variation for yield and yield components. The range of variation
between environments was almost double for some characters like pods / plant and seeds / plant. For other
characters also, quite high range of variation was observed (Table 3). This confirmed considerable genetic
variability of genotypes.
The environment six (E6) was found to be more favourable environment for better expression of
characters for almost all the traits including yield (Table 3).
III.I Stability analysis
The importance of genotype x environment interaction has been widely discussed by Comstock and
Mall (1963) for quantitative characters. The importance of genotype x environment interactions is well
recognized well and these are known to be heritable (Jinks and Mather, 1955). The significance of linear
regression analysis of genotype x environment interaction has not been understood earlier in crop breeding
program. So, nature and extent of genotype x environment interaction turn up to be of momentous importance,
especially, when the issue of stability analysis comes into focus. The present study dealt with analyzing
performance of 30 genotypes over different environments adopting the approach of regression analyses of
Eberhart and Russell (1966).
The analysis of variance indicated that highly significant differences were present among genotypes
and environment for seven characters (Table 4). The linear component of environments registered highly
significant variation for the characters like number of pods per plant, pod length, number of seeds per pod,
number of seeds per plant and seed yield per plant (Table 4). The significance of genotype x environment
interactions and its linear components for pods per plant, seeds per plant and seed yield per plant indicated that
the genotypes responded differently in varying environments. Similar observation was also reported by Singh
and Nanda (1997) and Manivannan et al. (1998) in mungbean.
www.iosrjournals.org

64 | Page
Genotype × Environment Interaction and Stability Analysis in Mungbean
The analysis of variance revealed that though the magnitudes of non linear [environment + (genotype x
environment)] components were significant, but were lower in comparison to linear genotype x environment for
all the characters except pod length. Thus, the performance of genotypes on different environments can be
predicted for the trait like seed yield per plant, being insignificant non-linear component or higher ratio of linear
component compared to non-linear component. A significant g X e interaction may be either crossover, in which
a significant change in rank occurs from one environment to others, or a non-crossover g X e interaction, in
which the ranking of genotypes remains constant across environments and the interaction was significant
because of change in the magnitude of response (Baker, 1988; Blum, 1983; Matus et al., 1997). In present study,
the significant g X e interaction seems to be of a crossover nature.
The present data indicated that the identification of stable genotypes in respect to each of these
characters would be effective following stability model of Eberhart and Russell (1966).
The environmental index, as suggested by Eberhart and Russell (1966), was also carried out (Table 5).
Environment 6 (E6) exhibited highest environmental index for all the characters. On the contrary, E1 showed
highly negative value for all the traits. In spite of many objections to this environmental index (Tai, 1971;
Hardwick and Wood, 1972), it has been shown that, generally interpretation of a set of data dependent little on
whether independent or dependent values were used for the index in calculating the regression slopes (Perkins
and Jinks, 1973; Fripp and Caten, 1973).
III.II Identification of stable genotypes by stability analysis
In the present study, an attempt has been made to identify stable genotypes on the basis of seed yield
per plant and other yield components from 30 genotypes following the approach of stability analysis viz.
regression coefficient (bi) and deviation mean square (s2di) (Eberhart and Russell, 1966). Usefulness of the
parameter S2di as was questioned sometimes its importance was not considered (Lin. et al., 1986). The relative
performance of the genotypes for individual yield and its component traits were discussed below.
The genotypes, which were found to be stable on the basis of the approach of stability analysis for all
or most of the characters, were considered to be highly stable. This kind of treatment was considered because
the genotypes with complete agreement with all the characters discussed here would likely to express high level
of stability over environments but no such genotype was found to be considered as highly stable.
The relative stability performance of individual genotype for yield and its important components viz.
number of pods per plant, number of pods per cluster, pod length, number of seeds per pod, number of seeds per
plant, 100 seed weight and seed yield per plant were considered here to identify stable genotypes.
Seed yield : Horizontal line passing through bi=1.0 and vertical line passing through population mean of 16.51,
for average seed yield/plant (gm) were two reference lines against which comparison was done. The proportion
of genotype showing predictable behavior across the environments was 66.35%. The performance of seed yield
was found best in E6 in all the genotypes. The genotypes recorded to be average stable were CUM2, CUM4,
CUM10, CUM19, CUM26 and CUM30 having bi values close to 1 and seed yield per plant more than the
population mean (Table 3, Table 6, Figure1).
Out of these stable genotypes CUM2, CUM4 and CUM10 also showed deviation from regression close
to 1. All three mutants were gamma irradiated materials from parent B105. So, these three genotypes were
considered as most desirable stable mutant among 30 genotypes.
Pods per plant: The average number of pods per plant over all the genotypes and environments were found to be
34.65 (Table 6). Total 19 genotypes surpassed population mean and in 9 out of 19 genotypes namely CUM1,
CUM4, CUM13, CUM14, CUM15, CUM16, CUM17, CUM18 and CUM23 bi values were close to 1.
Pods per cluster: The mutant CUM1 exhibited highest mean followed by genotypes CUM12 and CUM11. Out
of 18 genotypes showing high mean performance higher than general mean, 8 genotypes namely CUM1,
CUM4, CUM10, CUM13, CUM20, CUM25, CUM26 and CUM27 also exhibited bi value close to 1.
Pod length: The pod lengths of eighteen genotypes were higher than the general mean (6.55) across
environments. 36% genotype turned out to be predictable across the environments. Seven genotype namely,
CUM1, CUM4, CUM5, CUM10, CUM24, CUM28 and CUM30 were adapted to all environments, having
high mean value and bi value close to 1 (Table 6).
Seeds per pod : Among twenty two genotypes which surpassed general mean across environments, seven
genotypes namely CUM1, CUM4, CUM10, CUM13, CUM17, CUM22 and CUM28 were recorded to exhibit
average stability having bi value, close to 1 (Table 6). Performance of genotypes was predictable as their linear
components were significant, and the proportion of genotypes showing predictability was 62.39%.
Seeds per plant : Environment six (E6) emerged as the best environment due to high mean (Table 3). It is
interesting to note that almost all the linear and nonlinear components were highly significant (Table 4) for
seeds/ plant. Among the twenty one genotypes that showed higher mean performance over the general mean,
only ten namely CUM1, CUM2, CUM4, CUM8, CUM10, CUM21, CUM22, CUM26, CUM29 and CUM30
were specifically adapted to all environments having high mean value and bi value close to 1 (Table 6).
www.iosrjournals.org

65 | Page
Genotype × Environment Interaction and Stability Analysis in Mungbean
100 seed weight: Twenty nine genotypes albeit, showed mean values higher than the general mean, but ten were
widely adapted to all environments having bi value close to 1.
Sustainability index was estimated to identify the stable genotypes on the basis of seed yield (Table 7).
Genotypes namely, CUM1, CUM6, CUM7, CUM9, CUM16, CUM20, CUM21, CUM25, CUM26, CUM27,
CUM28 and CUM29 showed very high sustainability index (%). On the contrary, some genotypes namely,
CUM2, CUM4, CUM5, CUM8, CUM10, CUM12, CUM13, CUM15, CUM17, CUM18, CUM19, CUM22,
CUM23, CUM24, and CUM30 were found high sustainability index (%) was estimated indicating these
genotypes were stable across the environments which were characterized with wide adaptability and high mean.
The comparative study between the two stability models revealed that the genotypes CUM1, CUM4,
CUM10 and CUM13 which were characterized with wide adaptability for some traits including seed yield as per
Eberhart and Russell (1966) model, also corroborates with high sustainability index (%). So, any of the
techniques can be considered for identifying wide adaptable genotypes.
In general, genotypes did not show wide adaptability uniformly for all characters. However, four
genotypes namely CUM1, CUM4, CUM10 and CUM13 registered average stability coupled with high mean
performance for seed yield per plant and some yield components consistently. Out of these 4 mutant lines, three
genotypes namely CUM1, CUM4 and CUM10 were developed from variety B105. On the contrary, the
genotype CUM13 was selection from irradiated population of variety B1. Both B1 and B105 were widely
adapted varieties to different environments and same adaptability pattern existed in mutant lines evolved from
these two varieties. The four genotypes CUM1, CUM4, CUM10 and CUM13, therefore, could be considered to
be outstanding for cultivation in all environments having average stability and high yield.

Reference
[1]
[2]
[3]
[4]
[5]
[6]
[7]
[8]
[9]
[10]
[11]
[12]
[13]
[14]
[15]
[16]
[17]
[18]
[19]
[20]
[21]
[22]
[23]
[24]
[25]
[26]
[27]
[28]
[29]
[30]
[31]
[32]

Nilan RA, Konzak CF (1961). Increasing the efficiency of mutation induction. Mutation and Plant Breeding 891: 437-460.
Matsumura S, Kondo S, Mabuchi T (1963). Radiation genetics in wheat- VIII. Radiation Botany 3: 29-40.
Juran HM, Nath P, Banerjee BK, Datta SK (1986). Gamma ray induced dwarf mutant of winged bean, grown in Sri Lanka. 2nd Int.
Symposium on winged bean. Colombo, Sri Lanka. January1981. 34.
Klu GYP, Jacobsen E, Harton AM (1997). Induced mutations in winged bean. Euphytica 98: 99-107.
Giroux MJ, Morris CF (1998). Wheat grain hardness results from highly conserved mutations in the friabilin components
puroindoline a and b. Proc. Natl. Acad. Sci. 95: 6262-6266.
Chakraborty SN (1995). Mutation breeding in India with particular reference to PNR rice varieties. J. Nuclear Agric. Biol. 24: 73-82.
Hannah C, Giroux M, Boyer C (1993). Biotechnological modification of carbohydrates for sweet corn and maize improvement.
Scientia Horticulturea. 55: 177-197.
MacLeod MR (1994). Analysis of an allelic series of mutants at the r locus of pea. Ph. D., Univ. East Arglia, U.K.
Webb BD, Bollich CN, Adair CR, Jahnstoneth NR (1968). Characteristics of rice varieties in the Deptt. of Agriculture collection.
Crop. Sci. 8 : 361 - 5.
Hensz RA (1991). Mutation breeding of grape fruit. In: Proc. Plant Mutation Breed. for Crop Improvement. Vol. I. Internl. Symp.
IAFA and Food Aric. Org. of the UN. IEAE SM-311, Vienna, 533-536.
Lapade AG, Veluz AMS, Santos IS (1995). Genetic improvement of the Queen variety of pineapple through induced mutation and i n
vitro culture techniques. In: Proc. Induced mutations and Molec. Techn. For crop improvement. International Symp. IAEA and Food
Agric. Org. oh the UN, IAEA, Vienna. 684-687.
Eberhart SA, Russell WA (1966). Stability parameter for comparing varieties. Crop Sci. 6: 36 -40.
Allard RW, Bradshaw AD (1964). Implication of genotype-environment interaction in applied breeding. Crop Sci. 4: 503-508.
Kang MS, Pham HN (1991). Simultaneous selection for high yielding and stable crop genotypes. Agron. J. 83: 161-165.
Kang MS (1998). Using genotype by environment interaction for Crop cultivar development. Adv. Agron. 35: 199-252.
Lu HY, Wu HP (1986). Studies of genotype-environment interaction of Arabidopsis thaliana. Bot. Bull. Academia Sinica. 27: 187207.
Scheiner SM (1993). Genetics and Evolution of Phenotypic Plasticity. Annual Review of Ecology and Systematics l. 24: 35-68.
Immer FR, Powers LR (1934). Statistical determination of barley varietals adaptation. J. American Soc. Agron. 26: 403-419.
Salmon SC (1951) Analysis of variance and long time variety tests of wheat. Agron. J. 43: 562-570.
Horner TW, Frey KJ (1957). Methods for determining natural areas for oat varietals recommendation. Agron. J. 49: 313-315.
Sandison A, Barlett BO (1958) Comparison of varieties for yield. J. Nat. Inst. Agric. Bot. 8: 351-357.
Yates F, Cochran WG (1938). The analysis of groups of experiments. J. Agric. Sci. 28: 556-580.
Wricke G (1962). Über eine Methode zur Erfassung der ökologischen Streubreite in Feldversuchen, Z. Pflangenzuechd. 47: 92-96.
Finlay KW, Wilkinson GN (1963). The analysis of adaptation in a plant breeding program. Australian J. Agric. Res. 14: 742-754.
Perkins JM, Jinks JL (1968). Environmental and genotype environmental components of variability. III Multiple lines and cro sses,
Heredity 23: 339-346.
Hanson WD (1970). Genotype stability. Theor. Appl Genet. 40: 226-231.
Tai GCC (1971). Genotype stability analysis and its application to potato regional trials. Crop Sci. 11: 184-190.
Nassar R, Huhn M (1987) Studies on estimation of phenotype stability. Test of significance for nonparametric measures of
phenotypic stability. Biometry 43: 45-54.
Backer HC (1981). Biometrical and Empirical relations between different concept of phenotypic stability. Quantitative Genetics and
Breeding Methods. Versailles, INRA. pp 307-314.
Singh P, Agarwal DK (2003). Sustainability index as an aid for determining the genotypic stability in diploid cotton ( Gossypium
arboreum). J. Cotton Res. Dev. 17: 90-92.
Gangwar B, Katyal V, Anand KV (2004). Stability and efficiency of cropping systems in Chatisgarh and Madhya Pradesh. Indian J.
Agric. Sci. 74: 521-528.
Tuteja OP (2006). Comparative studies on stability parameters and sustainability index for selecting stable genotypes in upland
cotton (Gossypium hirsutum L.). Indian J. Genet. 66(3): 221-224.

www.iosrjournals.org

66 | Page
Genotype × Environment Interaction and Stability Analysis in Mungbean
[33]
[34]
[35]
[36]
[37]
[38]
[39]
[40]
[41]
[42]
[43]
[44]
[45]

Atta BM, Shah TM, Abbas G, Haq MA (2009). Genotype x Environment interaction for seed yield in kabuli chickpea (Cicer
arietinum L.) genotypes developed through mutation breeding. Pak. J. Bot. 41(4): 1883-1890.
Hamblin J, Knight R, Atkinson MJ (1978). The influence of systematic micro-environmental variation on individual plant yield
within selection plots. Euphytica. 27 (2): 497-503.
Comstock RE, Moll RH (1963). Genotype-environment interaction stat. Genet. Pl. Breed. 982: 164-196.
Jinks JL, Mather K (1955). Stability in development of heterozygotes and homozygotes. Proc. R. Soc. 143 : 561-578
Singh B, Nanda P (1997). Stability analysis for seed yield in green gram (Vigna radiata (L.) Wilczek). Environment and Ecology
15(3): 595-597 .
Manivannan N, Ramasamy A, Nadarajan N (1998). Phenotypic stability analysis in greengram (Phaseolus radiatus). Indian Journal
of Agricultural Sciences 68(1): 31-32 .
Baker RJ (1988). Differential response to environmental stress. Proceed 2 nd Internat. Conf. Quantitative Genetics. pp 492-504,
Sinauer, Sunderland, M.A.
Blum A (1983). Genetic and physiological relationship in plant breeding for drought resistance. In: Plant production and management
under drought conditions. (Eds.) J.T. Stone and W.O. Willis, Elsevier, Amsterdam, pp. 195-205.
Matus A, Slinkard AF, Kessel C. (1997). Genotype x environment interaction for carbon isotope discrimination in spring wheat. Ibid.
37(1): 97-102.
Hardwick RC, Wood JT (1972). Regression methods for studying genotype-environment interactions. Heredity 28: 209-222.
Perkins JM, Jinks JL. (1973) The assessment and specificity of environmental and genotype-environmental components of
variability. Heredity 30: 111-126.
Fripp YJ, Caten CE (1973). The relationship between mean expression and sensitivity to change in environment. Heredity 30: 341349.
Lin CS, Binns MR, Lefkovitch LP (1986). Stability analysis : Where do we stand? Crop Sci. 26 : 894-900.

Table 1: List of the elite mutant lines
Line

Developed from

Treatment dosage

Line

Developed from

Treatment dosage

CUM 1

B 105

45 KR γ ray

CUM 16

B1

60 KR γ ray

CUM 2

B 105

15 KR γ ray

CUM 17

B1

1.50% EMS

CUM 3

B 105

1.50% EMS

CUM 18

B1

45 KR γ ray

CUM 4

B 105

30 KR γ ray

CUM 19

B1

1.00% EMS

CUM 5

B 105

60 KR γ ray

CUM 20

B1

60KR γ ray

CUM 6

B 105

30 KR γ ray

CUM 21

SML 32

15 KR γ ray

CUM 7

B 105

1.50% EMS

CUM 22

SML 32

30 KR γ ray

CUM 8

B 105

0.50% EMS

CUM 23

SML 32

0.50% EMS

CUM 9

B 105

15 KR γ ray

CUM 24

SML 32

45 KR γ ray

CUM 10

B 105

1.00% EMS

CUM 25

SML 32

0.50% EMS

CUM 11

B1

30 KR γ ray

CUM 26

SML 32

15 KR γ ray

CUM 12

B1

45 KR γ ray

CUM 27

SML 32

45 KR γ ray

CUM 13

B1

15 KR γ ray

CUM 28

SML 32

15 KR γ ray

CUM 14

B1

0.50% EMS

CUM 29

SML 32

30 KR γ ray

CUM 15

B1

30 KR γ ray

CUM 30

SML 32

15 KR γ ray

Table 2: Stability parameters and their underlying stability concepts
Stability parameters

Symbol

Stability concept involved

Regression coefficient
Deviation mean square

bi
s2d

Biological/ Agronomic
Agronomic

Table 3: Summary of yield and its components over the seven environments for the genotypes of
mungbean
Pods / plant
Average value
Range
Environment with
Highest Mean
Lowest Mean

Pods / cluster

Pod length

Seeds /pod

Seeds / plant

34.65
28.73 –
53.17

6.14
5.99 – 6.38

6.55
6.21 – 7.29

11.41
10.61 – 12.76

538.58
435.04 –
857.28

E6
E3

E7
E3

E6
E3

E6
E3

www.iosrjournals.org

E6
E1

100 seed
weight
4.22
4.08 – 4.31

E6
E3

Seed yield
16.51
15.20 –
18.93
E6
E1

67 | Page
Genotype × Environment Interaction and Stability Analysis in Mungbean
Table 4: Analysis of variance (mean square) for yield and yield components (Eberhart And Russell, 1966)
Sources of variation

d. f.

Genotypes
Environments
Genotype × Environment
Environment +( Genotype ×
Environment)
Environments (linear)
Genotype × Environment
(linear)
Pooled deviation
Pooled error

32
6
192
198
1
32
165
224

Pods /
plant
71.72**+
+
2396.60*
*
12.88**+
+
85.11**+
+
14379.66
**
19.14**+
+
11.27**
5.01

Pods /
cluster
0.59
0.57
0.23

Pod
length
0.43
4.05**+
+
0.15

Seeds
/pod
1.59**
+
14.75*

0.23

0.27

0.93

3.44
0.42

24.32**
++
0.09

88.49*
*++
0.73

0.18
0.06

0.16
0.04

0.44
0.12

++
3618.39**++
27408.29**+
+
473213.40**
++
10603.92**+
+
2153.83**
720.32

*++
0.50

Seeds / plant
45408.87**+
+
788685.25**

100 seed
weight
1.37*
0.31
0.05

Seed
yield
36.59*+
61.42**+
+
4.20**

0.06

5.93**++

1.85
0.07

368.55**
++
6.96**++

0.05
0.03

3.53**
2.60

Linear component (%)

62.94

70.00

36.00

62.39

83.12

58.33

66.35

Non-linear component (%)

37.06

30.00

64.00

37.61

16.88

41.67

33.65

Significant against polled error at 5% is denoted by * Significant against polled error at 1% is denoted by**
Significant against polled deviation at 5% is denoted by + Significant against polled deviation at 1% is denoted by ++

Table 5: Estimates of environmental additive effects (Ig) for seven environments for seed yield and its
component of mungbean
E1

Seed
yield
-1.31

Pods /
plant
-4.30

E2

-1.29

-1.75

0.05

E3

-0.14

-5.92

-0.15

E4

0.04

-3.35

-0.11

E5

1.13

1.54

-0.02

E6

2.42

18.52

E7

-1.30

-4.74

Location

Pods /
cluster
-0.07

Seeds
/pod
-0.11

Seeds /
plant
-103.49

0.02

0.06

-65.70

0.06

-0.30

-0.79

-89.58

-0.13

-0.16

-0.44

-96.97

-0.04

-0.02

-0.07

92.11

0.05

0.04

0.78

1.36

318.75

0.10

0.24

0.03

0.05

-54.79

0.06

Pod length
-0.08

100 seed
weight
-0.01

Table 6: Estimates of stability parameters according to Eberhart And Russell (1966) model for yield and
yield components of mungbean
Line
CUM1
CUM2
CUM3
CUM4
CUM5
CUM6
CUM7
CUM8
CUM9
CUM10
B105
CUM11
CUM12
CUM13
CUM14
CUM15
CUM16
CUM17
CUM18
CUM19
CUM20
B1
CUM21
CUM22
CUM23
CUM24
CUM25
CUM26
CUM27
CUM28
CUM29
CUM30
SML32
Grand mean

μi = mean

Seed yield
μi
16.73
16.52
17.95
16.32
16.50
15.53
15.77
16.03
16.11
16.60
10.50
19.14
20.00
19.22
19.16
17.43
16.84
17.41
17.57
17.15
17.08
10.75
15.73
16.39
16.51
17.36
15.92
17.01
17.32
16.59
16.58
16.58
10.47
16.51

bi
0.52
0.88
1.87
0.93
0.64
0.43
0.30
0.79
0.44
1.10
0.01
3.19
2.38
1.22
3.23
1.35
0.37
1.72
1.37
1.17
0.71
-0.02
0.28
0.79
0.96
1.64
0.59
0.86
0.86
0.57
0.62
1.27
-0.02
-

Pods per plant
μi
bi
35.53
1.04
35.53
1.24
33.13
1.16
36.20
1.15
33.12
1.18
33.77
1.04
34.76
1.20
36.13
1.25
36.05
1.20
34.82
1.24
24.96
0.44
40.80
1.28
38.88
1.04
36.03
1.02
34.91
1.10
35.71
1.12
34.93
1.05
35.03
1.14
35.07
1.11
34.10
1.07
38.90
1.10
27.33
0.49
35.59
0.89
36.16
0.88
34.93
1.00
35.20
0.84
34.38
0.85
35.33
0.90
35.26
0.71
35.84
0.86
37.38
0.86
35.12
0.84
26.48
0.70
34.65
-

Pods per cluster
μi
bi
6.74
1.03
6.31
-2.03
6.12
-0.12
6.43
1.32
6.08
0.42
6.41
-0.71
6.07
0.16
6.10
0.17
6.37
0.27
6.14
0.90
5.70
0.82
6.56
0.72
6.74
1.54
6.15
1.10
5.93
2.66
6.04
1.95
6.29
2.55
6.23
3.65
6.24
2.43
6.09
1.85
6.19
1.03
5.52
-0.11
6.19
0.50
5.97
-0.17
5.79
-0.35
5.84
-1.80
6.22
1.07
6.17
1.15
6.31
0.91
6.06
-1.95
6.20
0.39
6.17
-0.42
5.39
-0.44
6.14
-

bi = regression coefficient
www.iosrjournals.org

Pod length
μi
7.03
6.36
6.28
6.81
6.60
6.54
6.23
6.34
6.78
6.57
6.34
6.63
6.77
6.44
6.54
6.60
6.55
6.39
6.46
6.60
6.48
6.09
6.72
6.95
6.58
6.68
6.55
6.81
6.54
6.77
6.46
6.66
5.75
6.55

bi
0.98
1.69
1.40
1.03
1.13
0.75
1.69
1.43
0.90
1.36
0.18
0.88
0.42
1.30
1.08
0.78
0.73
0.41
1.41
1.41
1.42
0.57
0.92
0.68
0.75
1.01
0.86
0.70
1.11
1.23
1.05
0.98
1.05
-

Continued
68 | Page
Genotype × Environment Interaction and Stability Analysis in Mungbean
Table 6: Estimates of stability parameters according to Eberhart And Russell (1966) model for yield and
yield components of mungbean
Line
CUM1
CUM2
CUM3
CUM4
CUM5
CUM6
CUM7
CUM8
CUM9
CUM10
B105
CUM11
CUM12
CUM13
CUM14
CUM15
CUM16
CUM17
CUM18
CUM19
CUM20
B1
CUM21
CUM22
CUM23
CUM24
CUM25
CUM26
CUM27
CUM28
CUM29
CUM30
SML32
Grand mean

Seeds per pod
μi
bi
11.57
1.28
11.32
1.40
11.42
0.90
11.41
0.98
11.82
1.43
11.22
0.98
11.18
1.89
11.57
1.77
11.75
0.31
11.72
1.19
10.26
0.28
11.82
0.27
12.43
1.05
11.44
1.22
11.30
1.43
11.10
1.59
11.34
1.27
11.41
0.99
11.64
1.50
11.51
1.68
11.91
1.38
10.24
0.70
11.18
0.24
11.51
0.98
11.68
0.54
11.52
0.89
11.79
0.37
11.41
0.34
11.60
-0.11
11.56
0.97
11.73
0.30
12.11
0.80
10.21
0.47
11.41
-

Seeds per plant
μi
bi
539.95
1.23
541.96
1.20
542.85
1.43
549.40
1.05
519.12
1.17
505.15
1.24
523.21
1.27
537.65
1.14
574.68
0.40
541.91
1.22
297.17
0.75
627.47
0.85
610.33
0.86
636.81
0.54
636.25
0.71
591.84
0.58
567.10
0.67
588.30
0.61
615.46
0.60
592.47
0.62
552.23
0.64
306.76
0.79
537.55
1.11
579.99
1.10
526.76
1.24
576.37
1.33
521.69
1.27
571.48
1.19
534.14
1.29
553.30
1.11
551.68
1.18
537.23
1.25
342.67
0.74
538.58
-

μi = mean

100 seed weight
μi
bi
4.30
0.95
4.30
1.09
4.38
1.66
4.34
0.83
4.36
0.89
4.27
1.08
4.30
1.87
4.44
2.34
4.48
0.08
4.35
0.65
2.50
1.54
4.47
1.30
4.83
0.66
4.40
1.18
4.33
1.19
4.27
2.45
4.35
3.63
4.23
1.85
4.32
1.64
4.31
2.03
4.28
1.50
3.14
1.36
4.31
0.81
4.21
0.02
4.30
0.34
4.23
0.31
4.28
-0.05
4.40
-0.56
4.37
-0.40
4.28
0.21
4.33
0.14
4.38
-3.15
3.08
1.59
4.22
-

bi = regression coefficient

Table 7: Estimates of sustainability index for seed yield in 33 genotypes of mungbean
Genotypes

Mean Yield

Standard Deviation

Sustainability
Index (%)

Stability

1.31

Best performance of
a genotype in any
year
18.72

CUM1

16.73

CUM2

16.52

82.39

Very High

1.80

19.28

76.33

High

CUM3
CUM4

17.95

3.50

24.46

59.08

Moderate

16.32

1.46

18.94

78.46

High

CUM5

16.5

1.78

20.21

72.86

High

CUM6

15.53

0.68

16.86

88.09

Very High

CUM7

15.77

0.52

16.81

90.72

Very High

CUM8

16.03

1.23

18.91

78.27

High

CUM9

16.11

0.80

17.89

85.60

Very High

CUM10

16.6

1.65

20.21

73.98

High

B105

10.5

0.60

11.67

84.83

Very High

CUM11

19.14

4.29

27.86

53.30

Moderate

CUM12

20

3.96

24.72

64.90

High

CUM13

19.22

3.61

22.88

68.24

High

CUM14

19.16

4.14

27.56

54.52

Moderate

CUM15

17.43

2.20

21.85

69.70

High

……Continued
www.iosrjournals.org

69 | Page
Genotype × Environment Interaction and Stability Analysis in Mungbean
Table 7: Estimates of sustainability index for seed yield in 33 genotypes of mungbean
Genotypes

Mean Yield

Standard Deviation

Best performance of
a genotype in any
year

Sustainability
Index (%)

Stability

CUM16
CUM17

16.84
17.41

1.05
2.81

19.07
23.21

82.80
62.89

Very High
High

CUM18
CUM19
CUM20
B1
CUM21
CUM22

17.57
17.15
17.08
10.75
15.73
16.39

2.81
2.32
1.37
1.04
0.63
1.51

23.76
22.29
19.42
12.49
16.75
18.72

62.11
66.55
80.92
77.70
90.18
79.51

High
High
Very High
High
Very High
High

CUM23
CUM24
CUM25
CUM26
CUM27
CUM28

16.51
17.36
15.92
17.01
17.32
16.59

1.77
3.15
0.92
1.72
1.49
1.06

19.28
22.32
17.22
19.07
19.39
18.09

76.43
63.64
87.11
80.16
81.63
85.83

High
High
Very High
Very High
Very High
Very High

CUM29
CUM30
SML32

16.58
16.58
10.47

1.10
1.75
0.91

18.29
20.49
12.47

84.63
72.39
76.68

Very High
High
High

Figure 1 : Relation between seed yield per plant (gm) and stability genotypes plotted graphically with b i
on x axis and average seed yield per plant (gm) on y axis

www.iosrjournals.org

70 | Page

More Related Content

What's hot

Stability parameters for comparing varieties (eberhart and russell 1966)
Stability parameters for comparing varieties (eberhart and russell 1966)Stability parameters for comparing varieties (eberhart and russell 1966)
Stability parameters for comparing varieties (eberhart and russell 1966)Dhanuja Kumar
 
Alanna and Ally poster 2013
Alanna and Ally poster 2013Alanna and Ally poster 2013
Alanna and Ally poster 2013Rachel Germain
 
Genetics of Climate Change Adaptation
Genetics of Climate Change AdaptationGenetics of Climate Change Adaptation
Genetics of Climate Change AdaptationDr. Shikha Thakur
 
Genotype by environment interactions and effects on growth and yield of cowpe...
Genotype by environment interactions and effects on growth and yield of cowpe...Genotype by environment interactions and effects on growth and yield of cowpe...
Genotype by environment interactions and effects on growth and yield of cowpe...Premier Publishers
 
Shifted multiplicative model - navdeep singh jamwal
Shifted multiplicative model - navdeep singh jamwalShifted multiplicative model - navdeep singh jamwal
Shifted multiplicative model - navdeep singh jamwalnavdeep singh jamwal
 
Atwood lecture 2012, Toronto, ON
Atwood lecture 2012, Toronto, ONAtwood lecture 2012, Toronto, ON
Atwood lecture 2012, Toronto, ONRachel Germain
 
Sotomayor PhD presentation Apr19 YorkU
Sotomayor PhD presentation Apr19 YorkUSotomayor PhD presentation Apr19 YorkU
Sotomayor PhD presentation Apr19 YorkUDiego Sotomayor
 
Germination percentage and growing behavior of Salix tetrasperma (Willow) as ...
Germination percentage and growing behavior of Salix tetrasperma (Willow) as ...Germination percentage and growing behavior of Salix tetrasperma (Willow) as ...
Germination percentage and growing behavior of Salix tetrasperma (Willow) as ...Innspub Net
 
Determining evolutionary mechanisms of species diversification in Eriogonoid...
Determining evolutionary mechanisms of species diversification in Eriogonoid...Determining evolutionary mechanisms of species diversification in Eriogonoid...
Determining evolutionary mechanisms of species diversification in Eriogonoid...Anna Kostikova
 
Biometrical Techniques for Analysis of Genotype x Environment Interactions & ...
Biometrical Techniques for Analysis of Genotype x Environment Interactions & ...Biometrical Techniques for Analysis of Genotype x Environment Interactions & ...
Biometrical Techniques for Analysis of Genotype x Environment Interactions & ...Manoj Sharma
 
Genotype x Environment Interaction and Grain Yield Stability of Maize (Zea ma...
Genotype x Environment Interaction and Grain Yield Stability of Maize (Zea ma...Genotype x Environment Interaction and Grain Yield Stability of Maize (Zea ma...
Genotype x Environment Interaction and Grain Yield Stability of Maize (Zea ma...Premier Publishers
 

What's hot (20)

Genotype and Enviornment and their Interaction
Genotype and Enviornment and their InteractionGenotype and Enviornment and their Interaction
Genotype and Enviornment and their Interaction
 
Stability parameters for comparing varieties (eberhart and russell 1966)
Stability parameters for comparing varieties (eberhart and russell 1966)Stability parameters for comparing varieties (eberhart and russell 1966)
Stability parameters for comparing varieties (eberhart and russell 1966)
 
Gene environment interaction
Gene environment interactionGene environment interaction
Gene environment interaction
 
Alanna and Ally poster 2013
Alanna and Ally poster 2013Alanna and Ally poster 2013
Alanna and Ally poster 2013
 
UBC BLISS talk 2016
UBC BLISS talk 2016UBC BLISS talk 2016
UBC BLISS talk 2016
 
Genetics of Climate Change Adaptation
Genetics of Climate Change AdaptationGenetics of Climate Change Adaptation
Genetics of Climate Change Adaptation
 
Genotype by environment interactions and effects on growth and yield of cowpe...
Genotype by environment interactions and effects on growth and yield of cowpe...Genotype by environment interactions and effects on growth and yield of cowpe...
Genotype by environment interactions and effects on growth and yield of cowpe...
 
Gene environment interaction
Gene environment interactionGene environment interaction
Gene environment interaction
 
Botany 2014 Boise, ID
Botany 2014 Boise, IDBotany 2014 Boise, ID
Botany 2014 Boise, ID
 
Rop poster 2013 final
Rop poster 2013 finalRop poster 2013 final
Rop poster 2013 final
 
Shifted multiplicative model - navdeep singh jamwal
Shifted multiplicative model - navdeep singh jamwalShifted multiplicative model - navdeep singh jamwal
Shifted multiplicative model - navdeep singh jamwal
 
Atwood lecture 2012, Toronto, ON
Atwood lecture 2012, Toronto, ONAtwood lecture 2012, Toronto, ON
Atwood lecture 2012, Toronto, ON
 
Sotomayor PhD presentation Apr19 YorkU
Sotomayor PhD presentation Apr19 YorkUSotomayor PhD presentation Apr19 YorkU
Sotomayor PhD presentation Apr19 YorkU
 
Pre1
Pre1Pre1
Pre1
 
ESA 2011 Austin, TX
ESA 2011 Austin, TXESA 2011 Austin, TX
ESA 2011 Austin, TX
 
AvalonPosterFinal
AvalonPosterFinalAvalonPosterFinal
AvalonPosterFinal
 
Germination percentage and growing behavior of Salix tetrasperma (Willow) as ...
Germination percentage and growing behavior of Salix tetrasperma (Willow) as ...Germination percentage and growing behavior of Salix tetrasperma (Willow) as ...
Germination percentage and growing behavior of Salix tetrasperma (Willow) as ...
 
Determining evolutionary mechanisms of species diversification in Eriogonoid...
Determining evolutionary mechanisms of species diversification in Eriogonoid...Determining evolutionary mechanisms of species diversification in Eriogonoid...
Determining evolutionary mechanisms of species diversification in Eriogonoid...
 
Biometrical Techniques for Analysis of Genotype x Environment Interactions & ...
Biometrical Techniques for Analysis of Genotype x Environment Interactions & ...Biometrical Techniques for Analysis of Genotype x Environment Interactions & ...
Biometrical Techniques for Analysis of Genotype x Environment Interactions & ...
 
Genotype x Environment Interaction and Grain Yield Stability of Maize (Zea ma...
Genotype x Environment Interaction and Grain Yield Stability of Maize (Zea ma...Genotype x Environment Interaction and Grain Yield Stability of Maize (Zea ma...
Genotype x Environment Interaction and Grain Yield Stability of Maize (Zea ma...
 

Viewers also liked

ADDITIVE MAIN EFFECTS AND MULTIPLICATIVE INTERACTION (AMMI) BIPLOT ANALYSIS F...
ADDITIVE MAIN EFFECTS AND MULTIPLICATIVE INTERACTION (AMMI) BIPLOT ANALYSIS F...ADDITIVE MAIN EFFECTS AND MULTIPLICATIVE INTERACTION (AMMI) BIPLOT ANALYSIS F...
ADDITIVE MAIN EFFECTS AND MULTIPLICATIVE INTERACTION (AMMI) BIPLOT ANALYSIS F...University of Brawijaya
 
Gene Environment Interactions2
Gene Environment Interactions2Gene Environment Interactions2
Gene Environment Interactions2vlyaher
 
Gene Environment Interactions
Gene Environment InteractionsGene Environment Interactions
Gene Environment Interactionsvlyaher
 
Genotype by environment interactions gx e and climate change
Genotype by environment interactions gx e and climate changeGenotype by environment interactions gx e and climate change
Genotype by environment interactions gx e and climate changeAlberto Labarga
 
Gene and Environment Interactions
Gene and Environment InteractionsGene and Environment Interactions
Gene and Environment InteractionsNadine Taylor
 
Genotype x Environment (GxE) interaction studies in hybrids and elite cultiva...
Genotype x Environment (GxE) interaction studies in hybrids and elite cultiva...Genotype x Environment (GxE) interaction studies in hybrids and elite cultiva...
Genotype x Environment (GxE) interaction studies in hybrids and elite cultiva...ICRISAT
 
Gene interaction ppt
Gene interaction ppt Gene interaction ppt
Gene interaction ppt Ritesh ranjan
 
тестфонетика9 класса
тестфонетика9 классатестфонетика9 класса
тестфонетика9 классаNatalya Dyrda
 
егэ виды грамматических ошибок
егэ виды грамматических ошибокегэ виды грамматических ошибок
егэ виды грамматических ошибокNatalya Dyrda
 
презентация сереже
презентация сережепрезентация сереже
презентация сережеSergey Gerasimov
 
CLUBNIK угадай-ка
CLUBNIK угадай-каCLUBNIK угадай-ка
CLUBNIK угадай-каMihail Nadymov
 
и.а.крылов викторина
и.а.крылов  викторинаи.а.крылов  викторина
и.а.крылов викторинаNatalya Dyrda
 
Lc ftu hcmc best finance award
Lc ftu hcmc  best finance awardLc ftu hcmc  best finance award
Lc ftu hcmc best finance awardManh Cuong Chau
 
Auroras boreales
Auroras borealesAuroras boreales
Auroras borealespaulau2012
 
Application of Comparators in Modern Power System Protection and Control
Application of Comparators in Modern Power System Protection and ControlApplication of Comparators in Modern Power System Protection and Control
Application of Comparators in Modern Power System Protection and ControlIOSR Journals
 

Viewers also liked (20)

ADDITIVE MAIN EFFECTS AND MULTIPLICATIVE INTERACTION (AMMI) BIPLOT ANALYSIS F...
ADDITIVE MAIN EFFECTS AND MULTIPLICATIVE INTERACTION (AMMI) BIPLOT ANALYSIS F...ADDITIVE MAIN EFFECTS AND MULTIPLICATIVE INTERACTION (AMMI) BIPLOT ANALYSIS F...
ADDITIVE MAIN EFFECTS AND MULTIPLICATIVE INTERACTION (AMMI) BIPLOT ANALYSIS F...
 
Gene Environment Interactions2
Gene Environment Interactions2Gene Environment Interactions2
Gene Environment Interactions2
 
Gene Environment Interactions
Gene Environment InteractionsGene Environment Interactions
Gene Environment Interactions
 
Genotype by environment interactions gx e and climate change
Genotype by environment interactions gx e and climate changeGenotype by environment interactions gx e and climate change
Genotype by environment interactions gx e and climate change
 
Gene and Environment Interactions
Gene and Environment InteractionsGene and Environment Interactions
Gene and Environment Interactions
 
Energy Balance
Energy BalanceEnergy Balance
Energy Balance
 
Genotype x Environment (GxE) interaction studies in hybrids and elite cultiva...
Genotype x Environment (GxE) interaction studies in hybrids and elite cultiva...Genotype x Environment (GxE) interaction studies in hybrids and elite cultiva...
Genotype x Environment (GxE) interaction studies in hybrids and elite cultiva...
 
Gene interaction ppt
Gene interaction ppt Gene interaction ppt
Gene interaction ppt
 
тестфонетика9 класса
тестфонетика9 классатестфонетика9 класса
тестфонетика9 класса
 
егэ виды грамматических ошибок
егэ виды грамматических ошибокегэ виды грамматических ошибок
егэ виды грамматических ошибок
 
презентация сереже
презентация сережепрезентация сереже
презентация сереже
 
G0364045
G0364045G0364045
G0364045
 
C0621115
C0621115C0621115
C0621115
 
CLUBNIK угадай-ка
CLUBNIK угадай-каCLUBNIK угадай-ка
CLUBNIK угадай-ка
 
Modelo pedagogico
Modelo pedagogicoModelo pedagogico
Modelo pedagogico
 
и.а.крылов викторина
и.а.крылов  викторинаи.а.крылов  викторина
и.а.крылов викторина
 
Lc ftu hcmc best finance award
Lc ftu hcmc  best finance awardLc ftu hcmc  best finance award
Lc ftu hcmc best finance award
 
Auroras boreales
Auroras borealesAuroras boreales
Auroras boreales
 
C0561419
C0561419C0561419
C0561419
 
Application of Comparators in Modern Power System Protection and Control
Application of Comparators in Modern Power System Protection and ControlApplication of Comparators in Modern Power System Protection and Control
Application of Comparators in Modern Power System Protection and Control
 

Similar to Genotype × Environment Interaction and Stability Analysis in Mungbean

Assessment of genotype by environment interactions and grain
Assessment of genotype by environment interactions and grainAssessment of genotype by environment interactions and grain
Assessment of genotype by environment interactions and grainAlexander Decker
 
Genotype by environment interaction and stability of extra-early maize hybrid...
Genotype by environment interaction and stability of extra-early maize hybrid...Genotype by environment interaction and stability of extra-early maize hybrid...
Genotype by environment interaction and stability of extra-early maize hybrid...IJEAB
 
Genotype by Environment Interaction and Kernel Yield Stability of Groundnut (...
Genotype by Environment Interaction and Kernel Yield Stability of Groundnut (...Genotype by Environment Interaction and Kernel Yield Stability of Groundnut (...
Genotype by Environment Interaction and Kernel Yield Stability of Groundnut (...Journal of Agriculture and Crops
 
VARIABILITY STUDY IN F2 MATERIALS OF INTERVARIETAL CROSS OF BRINJAL (Solanum ...
VARIABILITY STUDY IN F2 MATERIALS OF INTERVARIETAL CROSS OF BRINJAL (Solanum ...VARIABILITY STUDY IN F2 MATERIALS OF INTERVARIETAL CROSS OF BRINJAL (Solanum ...
VARIABILITY STUDY IN F2 MATERIALS OF INTERVARIETAL CROSS OF BRINJAL (Solanum ...Moniruzzaman Shohag
 
Int.-J.-Exp.-Res.-Rev.-Vol.-7-10-17-2016
Int.-J.-Exp.-Res.-Rev.-Vol.-7-10-17-2016Int.-J.-Exp.-Res.-Rev.-Vol.-7-10-17-2016
Int.-J.-Exp.-Res.-Rev.-Vol.-7-10-17-2016Kshitiz Dhakal
 
Diversity of drought tolerance and seed yield in sunflower (Helianthus annuus...
Diversity of drought tolerance and seed yield in sunflower (Helianthus annuus...Diversity of drought tolerance and seed yield in sunflower (Helianthus annuus...
Diversity of drought tolerance and seed yield in sunflower (Helianthus annuus...Innspub Net
 
Evaluation of viable selection criteria at the seedling stage in corn genotyp...
Evaluation of viable selection criteria at the seedling stage in corn genotyp...Evaluation of viable selection criteria at the seedling stage in corn genotyp...
Evaluation of viable selection criteria at the seedling stage in corn genotyp...Innspub Net
 
Exploitation of Germplasm for Plant Yield Improvement in Cotton (Gossypium hi...
Exploitation of Germplasm for Plant Yield Improvement in Cotton (Gossypium hi...Exploitation of Germplasm for Plant Yield Improvement in Cotton (Gossypium hi...
Exploitation of Germplasm for Plant Yield Improvement in Cotton (Gossypium hi...Shoaib Ur Rehman
 
Effect of Different Sources of Nutrient on Growth and Yield of Okra (Abelmosc...
Effect of Different Sources of Nutrient on Growth and Yield of Okra (Abelmosc...Effect of Different Sources of Nutrient on Growth and Yield of Okra (Abelmosc...
Effect of Different Sources of Nutrient on Growth and Yield of Okra (Abelmosc...Agriculture Journal IJOEAR
 
Genotype by Environment Interaction on Yield Components and Stability Analysi...
Genotype by Environment Interaction on Yield Components and Stability Analysi...Genotype by Environment Interaction on Yield Components and Stability Analysi...
Genotype by Environment Interaction on Yield Components and Stability Analysi...Premier Publishers
 
Out Crossing, Heterozygosis and Inbreeding with Environments Interaction in R...
Out Crossing, Heterozygosis and Inbreeding with Environments Interaction in R...Out Crossing, Heterozygosis and Inbreeding with Environments Interaction in R...
Out Crossing, Heterozygosis and Inbreeding with Environments Interaction in R...paperpublications3
 
Genotype x environment interaction and stability analysis for yield and its c...
Genotype x environment interaction and stability analysis for yield and its c...Genotype x environment interaction and stability analysis for yield and its c...
Genotype x environment interaction and stability analysis for yield and its c...Alexander Decker
 
Genetic Variability, Heritability for Late leaf Spot tolerance and Productivi...
Genetic Variability, Heritability for Late leaf Spot tolerance and Productivi...Genetic Variability, Heritability for Late leaf Spot tolerance and Productivi...
Genetic Variability, Heritability for Late leaf Spot tolerance and Productivi...IOSR Journals
 
Estimation of genetic parameters and selection of sorghum [Sorghum bicolor (L...
Estimation of genetic parameters and selection of sorghum [Sorghum bicolor (L...Estimation of genetic parameters and selection of sorghum [Sorghum bicolor (L...
Estimation of genetic parameters and selection of sorghum [Sorghum bicolor (L...Innspub Net
 
Genetic Variability, Heritability and Genetic Advance of Kabuli Chickpea (Cic...
Genetic Variability, Heritability and Genetic Advance of Kabuli Chickpea (Cic...Genetic Variability, Heritability and Genetic Advance of Kabuli Chickpea (Cic...
Genetic Variability, Heritability and Genetic Advance of Kabuli Chickpea (Cic...Premier Publishers
 
02 f ijab 12-724, 011-018
02 f ijab 12-724, 011-01802 f ijab 12-724, 011-018
02 f ijab 12-724, 011-018IJAB1999
 
Mutation Induction for Improvement of Banana (Musa Spp). "Berangan Cv. Intan-...
Mutation Induction for Improvement of Banana (Musa Spp). "Berangan Cv. Intan-...Mutation Induction for Improvement of Banana (Musa Spp). "Berangan Cv. Intan-...
Mutation Induction for Improvement of Banana (Musa Spp). "Berangan Cv. Intan-...paperpublications3
 
Mutation Induction for Improvement of Banana (Musa Spp.) Berangan Cv. Intan-AAA
Mutation Induction for Improvement of Banana (Musa Spp.) Berangan Cv. Intan-AAAMutation Induction for Improvement of Banana (Musa Spp.) Berangan Cv. Intan-AAA
Mutation Induction for Improvement of Banana (Musa Spp.) Berangan Cv. Intan-AAApaperpublications3
 
Out Crossing, Heterozygosis and Inbreeding with Environments Interaction in R...
Out Crossing, Heterozygosis and Inbreeding with Environments Interaction in R...Out Crossing, Heterozygosis and Inbreeding with Environments Interaction in R...
Out Crossing, Heterozygosis and Inbreeding with Environments Interaction in R...paperpublications3
 

Similar to Genotype × Environment Interaction and Stability Analysis in Mungbean (20)

Assessment of genotype by environment interactions and grain
Assessment of genotype by environment interactions and grainAssessment of genotype by environment interactions and grain
Assessment of genotype by environment interactions and grain
 
Genotype by environment interaction and stability of extra-early maize hybrid...
Genotype by environment interaction and stability of extra-early maize hybrid...Genotype by environment interaction and stability of extra-early maize hybrid...
Genotype by environment interaction and stability of extra-early maize hybrid...
 
Genotype by Environment Interaction and Kernel Yield Stability of Groundnut (...
Genotype by Environment Interaction and Kernel Yield Stability of Groundnut (...Genotype by Environment Interaction and Kernel Yield Stability of Groundnut (...
Genotype by Environment Interaction and Kernel Yield Stability of Groundnut (...
 
VARIABILITY STUDY IN F2 MATERIALS OF INTERVARIETAL CROSS OF BRINJAL (Solanum ...
VARIABILITY STUDY IN F2 MATERIALS OF INTERVARIETAL CROSS OF BRINJAL (Solanum ...VARIABILITY STUDY IN F2 MATERIALS OF INTERVARIETAL CROSS OF BRINJAL (Solanum ...
VARIABILITY STUDY IN F2 MATERIALS OF INTERVARIETAL CROSS OF BRINJAL (Solanum ...
 
Int.-J.-Exp.-Res.-Rev.-Vol.-7-10-17-2016
Int.-J.-Exp.-Res.-Rev.-Vol.-7-10-17-2016Int.-J.-Exp.-Res.-Rev.-Vol.-7-10-17-2016
Int.-J.-Exp.-Res.-Rev.-Vol.-7-10-17-2016
 
Diversity of drought tolerance and seed yield in sunflower (Helianthus annuus...
Diversity of drought tolerance and seed yield in sunflower (Helianthus annuus...Diversity of drought tolerance and seed yield in sunflower (Helianthus annuus...
Diversity of drought tolerance and seed yield in sunflower (Helianthus annuus...
 
Evaluation of viable selection criteria at the seedling stage in corn genotyp...
Evaluation of viable selection criteria at the seedling stage in corn genotyp...Evaluation of viable selection criteria at the seedling stage in corn genotyp...
Evaluation of viable selection criteria at the seedling stage in corn genotyp...
 
Aijrfans14 257
Aijrfans14 257Aijrfans14 257
Aijrfans14 257
 
Exploitation of Germplasm for Plant Yield Improvement in Cotton (Gossypium hi...
Exploitation of Germplasm for Plant Yield Improvement in Cotton (Gossypium hi...Exploitation of Germplasm for Plant Yield Improvement in Cotton (Gossypium hi...
Exploitation of Germplasm for Plant Yield Improvement in Cotton (Gossypium hi...
 
Effect of Different Sources of Nutrient on Growth and Yield of Okra (Abelmosc...
Effect of Different Sources of Nutrient on Growth and Yield of Okra (Abelmosc...Effect of Different Sources of Nutrient on Growth and Yield of Okra (Abelmosc...
Effect of Different Sources of Nutrient on Growth and Yield of Okra (Abelmosc...
 
Genotype by Environment Interaction on Yield Components and Stability Analysi...
Genotype by Environment Interaction on Yield Components and Stability Analysi...Genotype by Environment Interaction on Yield Components and Stability Analysi...
Genotype by Environment Interaction on Yield Components and Stability Analysi...
 
Out Crossing, Heterozygosis and Inbreeding with Environments Interaction in R...
Out Crossing, Heterozygosis and Inbreeding with Environments Interaction in R...Out Crossing, Heterozygosis and Inbreeding with Environments Interaction in R...
Out Crossing, Heterozygosis and Inbreeding with Environments Interaction in R...
 
Genotype x environment interaction and stability analysis for yield and its c...
Genotype x environment interaction and stability analysis for yield and its c...Genotype x environment interaction and stability analysis for yield and its c...
Genotype x environment interaction and stability analysis for yield and its c...
 
Genetic Variability, Heritability for Late leaf Spot tolerance and Productivi...
Genetic Variability, Heritability for Late leaf Spot tolerance and Productivi...Genetic Variability, Heritability for Late leaf Spot tolerance and Productivi...
Genetic Variability, Heritability for Late leaf Spot tolerance and Productivi...
 
Estimation of genetic parameters and selection of sorghum [Sorghum bicolor (L...
Estimation of genetic parameters and selection of sorghum [Sorghum bicolor (L...Estimation of genetic parameters and selection of sorghum [Sorghum bicolor (L...
Estimation of genetic parameters and selection of sorghum [Sorghum bicolor (L...
 
Genetic Variability, Heritability and Genetic Advance of Kabuli Chickpea (Cic...
Genetic Variability, Heritability and Genetic Advance of Kabuli Chickpea (Cic...Genetic Variability, Heritability and Genetic Advance of Kabuli Chickpea (Cic...
Genetic Variability, Heritability and Genetic Advance of Kabuli Chickpea (Cic...
 
02 f ijab 12-724, 011-018
02 f ijab 12-724, 011-01802 f ijab 12-724, 011-018
02 f ijab 12-724, 011-018
 
Mutation Induction for Improvement of Banana (Musa Spp). "Berangan Cv. Intan-...
Mutation Induction for Improvement of Banana (Musa Spp). "Berangan Cv. Intan-...Mutation Induction for Improvement of Banana (Musa Spp). "Berangan Cv. Intan-...
Mutation Induction for Improvement of Banana (Musa Spp). "Berangan Cv. Intan-...
 
Mutation Induction for Improvement of Banana (Musa Spp.) Berangan Cv. Intan-AAA
Mutation Induction for Improvement of Banana (Musa Spp.) Berangan Cv. Intan-AAAMutation Induction for Improvement of Banana (Musa Spp.) Berangan Cv. Intan-AAA
Mutation Induction for Improvement of Banana (Musa Spp.) Berangan Cv. Intan-AAA
 
Out Crossing, Heterozygosis and Inbreeding with Environments Interaction in R...
Out Crossing, Heterozygosis and Inbreeding with Environments Interaction in R...Out Crossing, Heterozygosis and Inbreeding with Environments Interaction in R...
Out Crossing, Heterozygosis and Inbreeding with Environments Interaction in R...
 

More from IOSR Journals (20)

A011140104
A011140104A011140104
A011140104
 
M0111397100
M0111397100M0111397100
M0111397100
 
L011138596
L011138596L011138596
L011138596
 
K011138084
K011138084K011138084
K011138084
 
J011137479
J011137479J011137479
J011137479
 
I011136673
I011136673I011136673
I011136673
 
G011134454
G011134454G011134454
G011134454
 
H011135565
H011135565H011135565
H011135565
 
F011134043
F011134043F011134043
F011134043
 
E011133639
E011133639E011133639
E011133639
 
D011132635
D011132635D011132635
D011132635
 
C011131925
C011131925C011131925
C011131925
 
B011130918
B011130918B011130918
B011130918
 
A011130108
A011130108A011130108
A011130108
 
I011125160
I011125160I011125160
I011125160
 
H011124050
H011124050H011124050
H011124050
 
G011123539
G011123539G011123539
G011123539
 
F011123134
F011123134F011123134
F011123134
 
E011122530
E011122530E011122530
E011122530
 
D011121524
D011121524D011121524
D011121524
 

Recently uploaded

Unraveling Multimodality with Large Language Models.pdf
Unraveling Multimodality with Large Language Models.pdfUnraveling Multimodality with Large Language Models.pdf
Unraveling Multimodality with Large Language Models.pdfAlex Barbosa Coqueiro
 
From Family Reminiscence to Scholarly Archive .
From Family Reminiscence to Scholarly Archive .From Family Reminiscence to Scholarly Archive .
From Family Reminiscence to Scholarly Archive .Alan Dix
 
"Subclassing and Composition – A Pythonic Tour of Trade-Offs", Hynek Schlawack
"Subclassing and Composition – A Pythonic Tour of Trade-Offs", Hynek Schlawack"Subclassing and Composition – A Pythonic Tour of Trade-Offs", Hynek Schlawack
"Subclassing and Composition – A Pythonic Tour of Trade-Offs", Hynek SchlawackFwdays
 
A Deep Dive on Passkeys: FIDO Paris Seminar.pptx
A Deep Dive on Passkeys: FIDO Paris Seminar.pptxA Deep Dive on Passkeys: FIDO Paris Seminar.pptx
A Deep Dive on Passkeys: FIDO Paris Seminar.pptxLoriGlavin3
 
DevoxxFR 2024 Reproducible Builds with Apache Maven
DevoxxFR 2024 Reproducible Builds with Apache MavenDevoxxFR 2024 Reproducible Builds with Apache Maven
DevoxxFR 2024 Reproducible Builds with Apache MavenHervé Boutemy
 
Passkey Providers and Enabling Portability: FIDO Paris Seminar.pptx
Passkey Providers and Enabling Portability: FIDO Paris Seminar.pptxPasskey Providers and Enabling Portability: FIDO Paris Seminar.pptx
Passkey Providers and Enabling Portability: FIDO Paris Seminar.pptxLoriGlavin3
 
The Fit for Passkeys for Employee and Consumer Sign-ins: FIDO Paris Seminar.pptx
The Fit for Passkeys for Employee and Consumer Sign-ins: FIDO Paris Seminar.pptxThe Fit for Passkeys for Employee and Consumer Sign-ins: FIDO Paris Seminar.pptx
The Fit for Passkeys for Employee and Consumer Sign-ins: FIDO Paris Seminar.pptxLoriGlavin3
 
New from BookNet Canada for 2024: BNC CataList - Tech Forum 2024
New from BookNet Canada for 2024: BNC CataList - Tech Forum 2024New from BookNet Canada for 2024: BNC CataList - Tech Forum 2024
New from BookNet Canada for 2024: BNC CataList - Tech Forum 2024BookNet Canada
 
Use of FIDO in the Payments and Identity Landscape: FIDO Paris Seminar.pptx
Use of FIDO in the Payments and Identity Landscape: FIDO Paris Seminar.pptxUse of FIDO in the Payments and Identity Landscape: FIDO Paris Seminar.pptx
Use of FIDO in the Payments and Identity Landscape: FIDO Paris Seminar.pptxLoriGlavin3
 
Sample pptx for embedding into website for demo
Sample pptx for embedding into website for demoSample pptx for embedding into website for demo
Sample pptx for embedding into website for demoHarshalMandlekar2
 
Nell’iperspazio con Rocket: il Framework Web di Rust!
Nell’iperspazio con Rocket: il Framework Web di Rust!Nell’iperspazio con Rocket: il Framework Web di Rust!
Nell’iperspazio con Rocket: il Framework Web di Rust!Commit University
 
What is Artificial Intelligence?????????
What is Artificial Intelligence?????????What is Artificial Intelligence?????????
What is Artificial Intelligence?????????blackmambaettijean
 
Rise of the Machines: Known As Drones...
Rise of the Machines: Known As Drones...Rise of the Machines: Known As Drones...
Rise of the Machines: Known As Drones...Rick Flair
 
Time Series Foundation Models - current state and future directions
Time Series Foundation Models - current state and future directionsTime Series Foundation Models - current state and future directions
Time Series Foundation Models - current state and future directionsNathaniel Shimoni
 
A Journey Into the Emotions of Software Developers
A Journey Into the Emotions of Software DevelopersA Journey Into the Emotions of Software Developers
A Journey Into the Emotions of Software DevelopersNicole Novielli
 
How to write a Business Continuity Plan
How to write a Business Continuity PlanHow to write a Business Continuity Plan
How to write a Business Continuity PlanDatabarracks
 
The State of Passkeys with FIDO Alliance.pptx
The State of Passkeys with FIDO Alliance.pptxThe State of Passkeys with FIDO Alliance.pptx
The State of Passkeys with FIDO Alliance.pptxLoriGlavin3
 
How AI, OpenAI, and ChatGPT impact business and software.
How AI, OpenAI, and ChatGPT impact business and software.How AI, OpenAI, and ChatGPT impact business and software.
How AI, OpenAI, and ChatGPT impact business and software.Curtis Poe
 
DevEX - reference for building teams, processes, and platforms
DevEX - reference for building teams, processes, and platformsDevEX - reference for building teams, processes, and platforms
DevEX - reference for building teams, processes, and platformsSergiu Bodiu
 
TeamStation AI System Report LATAM IT Salaries 2024
TeamStation AI System Report LATAM IT Salaries 2024TeamStation AI System Report LATAM IT Salaries 2024
TeamStation AI System Report LATAM IT Salaries 2024Lonnie McRorey
 

Recently uploaded (20)

Unraveling Multimodality with Large Language Models.pdf
Unraveling Multimodality with Large Language Models.pdfUnraveling Multimodality with Large Language Models.pdf
Unraveling Multimodality with Large Language Models.pdf
 
From Family Reminiscence to Scholarly Archive .
From Family Reminiscence to Scholarly Archive .From Family Reminiscence to Scholarly Archive .
From Family Reminiscence to Scholarly Archive .
 
"Subclassing and Composition – A Pythonic Tour of Trade-Offs", Hynek Schlawack
"Subclassing and Composition – A Pythonic Tour of Trade-Offs", Hynek Schlawack"Subclassing and Composition – A Pythonic Tour of Trade-Offs", Hynek Schlawack
"Subclassing and Composition – A Pythonic Tour of Trade-Offs", Hynek Schlawack
 
A Deep Dive on Passkeys: FIDO Paris Seminar.pptx
A Deep Dive on Passkeys: FIDO Paris Seminar.pptxA Deep Dive on Passkeys: FIDO Paris Seminar.pptx
A Deep Dive on Passkeys: FIDO Paris Seminar.pptx
 
DevoxxFR 2024 Reproducible Builds with Apache Maven
DevoxxFR 2024 Reproducible Builds with Apache MavenDevoxxFR 2024 Reproducible Builds with Apache Maven
DevoxxFR 2024 Reproducible Builds with Apache Maven
 
Passkey Providers and Enabling Portability: FIDO Paris Seminar.pptx
Passkey Providers and Enabling Portability: FIDO Paris Seminar.pptxPasskey Providers and Enabling Portability: FIDO Paris Seminar.pptx
Passkey Providers and Enabling Portability: FIDO Paris Seminar.pptx
 
The Fit for Passkeys for Employee and Consumer Sign-ins: FIDO Paris Seminar.pptx
The Fit for Passkeys for Employee and Consumer Sign-ins: FIDO Paris Seminar.pptxThe Fit for Passkeys for Employee and Consumer Sign-ins: FIDO Paris Seminar.pptx
The Fit for Passkeys for Employee and Consumer Sign-ins: FIDO Paris Seminar.pptx
 
New from BookNet Canada for 2024: BNC CataList - Tech Forum 2024
New from BookNet Canada for 2024: BNC CataList - Tech Forum 2024New from BookNet Canada for 2024: BNC CataList - Tech Forum 2024
New from BookNet Canada for 2024: BNC CataList - Tech Forum 2024
 
Use of FIDO in the Payments and Identity Landscape: FIDO Paris Seminar.pptx
Use of FIDO in the Payments and Identity Landscape: FIDO Paris Seminar.pptxUse of FIDO in the Payments and Identity Landscape: FIDO Paris Seminar.pptx
Use of FIDO in the Payments and Identity Landscape: FIDO Paris Seminar.pptx
 
Sample pptx for embedding into website for demo
Sample pptx for embedding into website for demoSample pptx for embedding into website for demo
Sample pptx for embedding into website for demo
 
Nell’iperspazio con Rocket: il Framework Web di Rust!
Nell’iperspazio con Rocket: il Framework Web di Rust!Nell’iperspazio con Rocket: il Framework Web di Rust!
Nell’iperspazio con Rocket: il Framework Web di Rust!
 
What is Artificial Intelligence?????????
What is Artificial Intelligence?????????What is Artificial Intelligence?????????
What is Artificial Intelligence?????????
 
Rise of the Machines: Known As Drones...
Rise of the Machines: Known As Drones...Rise of the Machines: Known As Drones...
Rise of the Machines: Known As Drones...
 
Time Series Foundation Models - current state and future directions
Time Series Foundation Models - current state and future directionsTime Series Foundation Models - current state and future directions
Time Series Foundation Models - current state and future directions
 
A Journey Into the Emotions of Software Developers
A Journey Into the Emotions of Software DevelopersA Journey Into the Emotions of Software Developers
A Journey Into the Emotions of Software Developers
 
How to write a Business Continuity Plan
How to write a Business Continuity PlanHow to write a Business Continuity Plan
How to write a Business Continuity Plan
 
The State of Passkeys with FIDO Alliance.pptx
The State of Passkeys with FIDO Alliance.pptxThe State of Passkeys with FIDO Alliance.pptx
The State of Passkeys with FIDO Alliance.pptx
 
How AI, OpenAI, and ChatGPT impact business and software.
How AI, OpenAI, and ChatGPT impact business and software.How AI, OpenAI, and ChatGPT impact business and software.
How AI, OpenAI, and ChatGPT impact business and software.
 
DevEX - reference for building teams, processes, and platforms
DevEX - reference for building teams, processes, and platformsDevEX - reference for building teams, processes, and platforms
DevEX - reference for building teams, processes, and platforms
 
TeamStation AI System Report LATAM IT Salaries 2024
TeamStation AI System Report LATAM IT Salaries 2024TeamStation AI System Report LATAM IT Salaries 2024
TeamStation AI System Report LATAM IT Salaries 2024
 

Genotype × Environment Interaction and Stability Analysis in Mungbean

  • 1. IOSR Journal of Agriculture and Veterinary Science (IOSR-JAVS) e-ISSN: 2319-2380, p-ISSN: 2319-2372. Volume 5, Issue 1 (Sep.- Oct. 2013), PP 62-70 www.iosrjournals.org Genotype × Environment Interaction and Stability Analysis in Mungbean Disharee Nath* and Tapash Dasgupta Department of Genetics and Plant Breeding Institute of Agricultural Science University of Calcutta 51/2 Hazra Road Kolkata – 700019, West Bengal, India Abstract: Mungbean is an important grain legume widely grown in India. Thirty genotypes of mungbean developed through mutation breeding from three parents namely B1, B105 and SML32 were evaluated on seven environments of West Bengal, India. Stability parameters were computed to know genotype x environment interaction and genotypic performance for yield per plant and its components. Wide range of variation was observed for seed yield and components across environments. Genotypes were grown best in sandy-loam textured soil coupled with low pH (5.7), indicating acidity and moderate water holding capacity, accompanied with higher proportion of available nitrogen percentage, moderate P2O5 and organic C. The analysis of variance showed highly significant variance for genotypes, environments and genotype x environment interaction. The significance of genotype x environment interaction accentuated the implication of stability analysis in crop improvement programme. The analysis of variance exhibited comparatively higher magnitudes of linear components than the non linear components and thus the characters were predictable in nature. Identification of stable genotypes over environments was done by stability analysis following model of Eberhart and Russell. Sustainability index was also estimated for searching the stable genotypes. In most of the cases, the stability for yield components was concomitant with stability for seed yield per plant. Four mutant genotypes namely CUM1, CUM4, CUM10 and CUM13 registered average stability coupled with high mean performance for seed yield per plant and components consistently, based on regression parameters and sustainability index. Keywords: Genotype x environment interaction, Mungbean, Stability, Sustainability index I. Introduction Mungbean (Vigna radiata L. Wilczek ), a short duration grain legume, is one of the most important pulse crops grown all over India. Mungbean ranks third among pulse crops of India covering approximately 3 million hectares, with the production of about 1 million tonnes accounting for 12% of the total pulse acreage. The earlier research works were more focused to improve the crop largely through simple procedures of selection with or without hybridization from local collections. The existing genetic variability of mungbean is a great concern for which conventional selection may not be effective. Mutation breeding is already an established technology. Ionizing radiation such as X-rays, γ-rays, neutrons have already been used in mungbean for inducing variations (Nilan and Konzak, 1961; Matsumura et al., 1963; Juran et al., 1986; Klu et al., 1997). In other crops also successful reports are available like in wheat (Giroux, 1998), rice (Chakraborty, 1995), sweet corn and maize (Hannah et al., 1993) and pea (Macleod, 1994). Yield, a complex quantitative character, depends upon interactions of multiple component characters. Undesirable linkage among yield components sometimes deters the overall improvement of yield (Webb et al., 1968). Mutagenic treatments can cause alterations in negative association of characters (Hensz, 1991; Lapade et al., 1995) which were originally undesirable from the production point of view. On the contrary, it is true that only few mutants in general, turn out to be useful or desirable when any mutagen is exercised for improvement. Nevertheless, the resultant mutants seemed to be very precious which otherwise may not be possible to achieve. An ideal variety always combines high yield with stability of performance (Eberhart and Russell, 1966). The genotype × environment is the main bottleneck which can vitiate entire efforts of a plant breeder for boosting higher yield. Thus, breeding for climate or environment resilient varieties is crucial (Allard and Bradshaw, 1964). Several methods of simultaneous selection for yield and stability and relations among them were discussed by Kang and Pham (1991) and Kang (1998). The phenotype has been confidently defined as a linear function of genotype, environment and interaction between two (Lu et al., 1986; Scheiner, 1993). The works of various scientists viz., Immer and Power (1934), Salmon (1951), Horner and Frey (1957) and Sandison and Barlett (1958) reflected that variety × season interactions were basic estimates of adaptability. Yates and Cochran (1938) subdivided the genotype × environment interactions into linear and nonlinear partitions. Eberhart and Russell (1966) developed a model based on the regression technique for measuring the stability of populations grown from single and thee-way crosses of maize. Numerous statistics, parametric as well as non–parametric have been proposed for the measurement of yield stability (Wricke, 1962; Finlay and Wilkinson, 1963; Eberhart and Russell, 1966; Perkins www.iosrjournals.org 62 | Page
  • 2. Genotype × Environment Interaction and Stability Analysis in Mungbean and Jinks, 1968; Hanson, 1970; Tai, 1971 and Nassar and Huhn, 1987). Depending upon the final goal of the breeder and the character under consideration, two concepts of stability were of great importance for biological and agronomic concept (Backer, 1981). The concept of genotype-environment interactions leads to measure the agronomic stability of the genotype. Under the biological concept stable genotype is one, whose phenotype shows little deviation from the expected character level when performance of genotype is tested over a number of environments. Plant improvement involves jointly the manipulation of genetic characteristics to optimize productivity in relation to the limitations of the environmental factors. However, lack of intensive systematic research efforts on mungbean stands as a barrier to its improvement, which needs a comprehensive and diversified approach. Elite or promising varieties with advantageous yield contributing characters adaptable for West Bengal, India as a whole still are of in need. The present study, aimed at identifying stable elite and promising mutant lines, especially for agro-climatic situations of West Bengal, India. II. Materials and Methods The elite mutant lines chosen in the investigation were (Table 1) developed from three parents namely B1, B105 and SML32 at Agricultural Experimental Farm of Calcutta University, Baruipur, South 24-Parganas, West Bengal, India (Latitude: 22.3497N, Longitude: 88.4392E, Altitude: 29”). The lines along with their parents (checks) were grown in different agro-ecological locations over seasons following normal cultural practices. Lines were grown in three replications in RBD design and spacing of 45 cm was maintained between family rows and 10 cm between plants in a row of 3m long. Ten randomly selected plants of each genotype from each replication excluding the border plants were chosen and tagged for recording observation. Altogether experiments were conducted at different locations and seasons which constituted seven environments and were referred as E1, E2, E3, E4, E5, E6, and E7. II.I Observations recorded Ten plants from each replication were selected for data recording and finally averaged. The data of each mutant included yield and yield components namely 1) Number of pods per plant; 2) Number of pods per cluster; 3) Pod length (cm); 4) Number of seeds per pod; 5) Number of seeds per plant; 6) 100-seeds weight (g); 7) Seed yield per plant (g). II.II Stability Analysis The stability analysis was done according to the models of Eberhart and Russell (1966). The model is defined as follows : Where, Yij = mean of the ith genotype at the jth environment, (i =1,2,….,v; j = 1,2,…..n) µi = mean of the ith genotype over all environments, bi = regression coefficient that measures the response of the ith genotype to varying environments, δij = deviation from regression of the ith genotype at the jth environment and Ij = environmental index obtained as the mean of all the genotypes at the jth environment minus the grand mean II.III Stability Parameters In the present study an overview of the parametric stability measures and their underlying stability concepts are presented in Table 2. II.IV Measurement of two parameters by Eberhart and Russell (1966) method The first stability parameter is a regression coefficient and was estimated as follows : bi = = = The estimated value of bi for each genotype was tested by the following formula and against table value of t at pooled error d.f. : www.iosrjournals.org 63 | Page
  • 3. Genotype × Environment Interaction and Stability Analysis in Mungbean As a second measure, they considered the deviation from regression as follows: and = estimate of the pooled error (or the variance of a genotype mean of the jth environment ). The deviation from regression for each genotype was tested by the following formula: Eberhart and Russell (1966) defined desirable criteria for stability as bi ≈ 1 and s2di ≈ 0 while genotypes with bi < 1.0 usually had below average stability. II.V Measurement of Sustainability Index (S.I.) Sustainability index was estimated by following the formula used by other workers (Singh and Agarwal, 2003; Gangwar et al., 2004 and Tuteja, 2006, Atta et al., 2009). Where Y = Average performance of a genotype, σn = Standard deviation and Y M = Best performance of a genotype in a year. The values of sustainability index were divided arbitrarily into 5 groups viz. very low (upto 20%), low (21 - 40%), moderate (41 - 60%), high (61-80%) and very high (above 80%). III. Results and Discussion Inconsistency of seed yield often experienced in mungbean, is due to its differential response of genotypes to various growing season or conditions. In general, productivity of a plant is influenced by several factors such as climate, soil type, photoperiodic response and micro-environments (Hamblin et al., 1978). Thus, the significance of genotype x environment interaction for obvious reason deserves high priority in any crop improvement program. Promising genotypes need to be evaluated in multi-environmental test over several years for identification of the stable and widely adapted genotypes. The present study was undertaken to assess genotype x environment interaction for seed yield/plant and its component character for identifying stable and superior genotypes over varied environments. The environmental influence disguised expression of the characters and varied genotypic responses were observed over seven environments in different seasons. The tested genotypes when averaged over all environments exhibited a wide range of variation for yield and yield components. The range of variation between environments was almost double for some characters like pods / plant and seeds / plant. For other characters also, quite high range of variation was observed (Table 3). This confirmed considerable genetic variability of genotypes. The environment six (E6) was found to be more favourable environment for better expression of characters for almost all the traits including yield (Table 3). III.I Stability analysis The importance of genotype x environment interaction has been widely discussed by Comstock and Mall (1963) for quantitative characters. The importance of genotype x environment interactions is well recognized well and these are known to be heritable (Jinks and Mather, 1955). The significance of linear regression analysis of genotype x environment interaction has not been understood earlier in crop breeding program. So, nature and extent of genotype x environment interaction turn up to be of momentous importance, especially, when the issue of stability analysis comes into focus. The present study dealt with analyzing performance of 30 genotypes over different environments adopting the approach of regression analyses of Eberhart and Russell (1966). The analysis of variance indicated that highly significant differences were present among genotypes and environment for seven characters (Table 4). The linear component of environments registered highly significant variation for the characters like number of pods per plant, pod length, number of seeds per pod, number of seeds per plant and seed yield per plant (Table 4). The significance of genotype x environment interactions and its linear components for pods per plant, seeds per plant and seed yield per plant indicated that the genotypes responded differently in varying environments. Similar observation was also reported by Singh and Nanda (1997) and Manivannan et al. (1998) in mungbean. www.iosrjournals.org 64 | Page
  • 4. Genotype × Environment Interaction and Stability Analysis in Mungbean The analysis of variance revealed that though the magnitudes of non linear [environment + (genotype x environment)] components were significant, but were lower in comparison to linear genotype x environment for all the characters except pod length. Thus, the performance of genotypes on different environments can be predicted for the trait like seed yield per plant, being insignificant non-linear component or higher ratio of linear component compared to non-linear component. A significant g X e interaction may be either crossover, in which a significant change in rank occurs from one environment to others, or a non-crossover g X e interaction, in which the ranking of genotypes remains constant across environments and the interaction was significant because of change in the magnitude of response (Baker, 1988; Blum, 1983; Matus et al., 1997). In present study, the significant g X e interaction seems to be of a crossover nature. The present data indicated that the identification of stable genotypes in respect to each of these characters would be effective following stability model of Eberhart and Russell (1966). The environmental index, as suggested by Eberhart and Russell (1966), was also carried out (Table 5). Environment 6 (E6) exhibited highest environmental index for all the characters. On the contrary, E1 showed highly negative value for all the traits. In spite of many objections to this environmental index (Tai, 1971; Hardwick and Wood, 1972), it has been shown that, generally interpretation of a set of data dependent little on whether independent or dependent values were used for the index in calculating the regression slopes (Perkins and Jinks, 1973; Fripp and Caten, 1973). III.II Identification of stable genotypes by stability analysis In the present study, an attempt has been made to identify stable genotypes on the basis of seed yield per plant and other yield components from 30 genotypes following the approach of stability analysis viz. regression coefficient (bi) and deviation mean square (s2di) (Eberhart and Russell, 1966). Usefulness of the parameter S2di as was questioned sometimes its importance was not considered (Lin. et al., 1986). The relative performance of the genotypes for individual yield and its component traits were discussed below. The genotypes, which were found to be stable on the basis of the approach of stability analysis for all or most of the characters, were considered to be highly stable. This kind of treatment was considered because the genotypes with complete agreement with all the characters discussed here would likely to express high level of stability over environments but no such genotype was found to be considered as highly stable. The relative stability performance of individual genotype for yield and its important components viz. number of pods per plant, number of pods per cluster, pod length, number of seeds per pod, number of seeds per plant, 100 seed weight and seed yield per plant were considered here to identify stable genotypes. Seed yield : Horizontal line passing through bi=1.0 and vertical line passing through population mean of 16.51, for average seed yield/plant (gm) were two reference lines against which comparison was done. The proportion of genotype showing predictable behavior across the environments was 66.35%. The performance of seed yield was found best in E6 in all the genotypes. The genotypes recorded to be average stable were CUM2, CUM4, CUM10, CUM19, CUM26 and CUM30 having bi values close to 1 and seed yield per plant more than the population mean (Table 3, Table 6, Figure1). Out of these stable genotypes CUM2, CUM4 and CUM10 also showed deviation from regression close to 1. All three mutants were gamma irradiated materials from parent B105. So, these three genotypes were considered as most desirable stable mutant among 30 genotypes. Pods per plant: The average number of pods per plant over all the genotypes and environments were found to be 34.65 (Table 6). Total 19 genotypes surpassed population mean and in 9 out of 19 genotypes namely CUM1, CUM4, CUM13, CUM14, CUM15, CUM16, CUM17, CUM18 and CUM23 bi values were close to 1. Pods per cluster: The mutant CUM1 exhibited highest mean followed by genotypes CUM12 and CUM11. Out of 18 genotypes showing high mean performance higher than general mean, 8 genotypes namely CUM1, CUM4, CUM10, CUM13, CUM20, CUM25, CUM26 and CUM27 also exhibited bi value close to 1. Pod length: The pod lengths of eighteen genotypes were higher than the general mean (6.55) across environments. 36% genotype turned out to be predictable across the environments. Seven genotype namely, CUM1, CUM4, CUM5, CUM10, CUM24, CUM28 and CUM30 were adapted to all environments, having high mean value and bi value close to 1 (Table 6). Seeds per pod : Among twenty two genotypes which surpassed general mean across environments, seven genotypes namely CUM1, CUM4, CUM10, CUM13, CUM17, CUM22 and CUM28 were recorded to exhibit average stability having bi value, close to 1 (Table 6). Performance of genotypes was predictable as their linear components were significant, and the proportion of genotypes showing predictability was 62.39%. Seeds per plant : Environment six (E6) emerged as the best environment due to high mean (Table 3). It is interesting to note that almost all the linear and nonlinear components were highly significant (Table 4) for seeds/ plant. Among the twenty one genotypes that showed higher mean performance over the general mean, only ten namely CUM1, CUM2, CUM4, CUM8, CUM10, CUM21, CUM22, CUM26, CUM29 and CUM30 were specifically adapted to all environments having high mean value and bi value close to 1 (Table 6). www.iosrjournals.org 65 | Page
  • 5. Genotype × Environment Interaction and Stability Analysis in Mungbean 100 seed weight: Twenty nine genotypes albeit, showed mean values higher than the general mean, but ten were widely adapted to all environments having bi value close to 1. Sustainability index was estimated to identify the stable genotypes on the basis of seed yield (Table 7). Genotypes namely, CUM1, CUM6, CUM7, CUM9, CUM16, CUM20, CUM21, CUM25, CUM26, CUM27, CUM28 and CUM29 showed very high sustainability index (%). On the contrary, some genotypes namely, CUM2, CUM4, CUM5, CUM8, CUM10, CUM12, CUM13, CUM15, CUM17, CUM18, CUM19, CUM22, CUM23, CUM24, and CUM30 were found high sustainability index (%) was estimated indicating these genotypes were stable across the environments which were characterized with wide adaptability and high mean. The comparative study between the two stability models revealed that the genotypes CUM1, CUM4, CUM10 and CUM13 which were characterized with wide adaptability for some traits including seed yield as per Eberhart and Russell (1966) model, also corroborates with high sustainability index (%). So, any of the techniques can be considered for identifying wide adaptable genotypes. In general, genotypes did not show wide adaptability uniformly for all characters. However, four genotypes namely CUM1, CUM4, CUM10 and CUM13 registered average stability coupled with high mean performance for seed yield per plant and some yield components consistently. Out of these 4 mutant lines, three genotypes namely CUM1, CUM4 and CUM10 were developed from variety B105. On the contrary, the genotype CUM13 was selection from irradiated population of variety B1. Both B1 and B105 were widely adapted varieties to different environments and same adaptability pattern existed in mutant lines evolved from these two varieties. The four genotypes CUM1, CUM4, CUM10 and CUM13, therefore, could be considered to be outstanding for cultivation in all environments having average stability and high yield. Reference [1] [2] [3] [4] [5] [6] [7] [8] [9] [10] [11] [12] [13] [14] [15] [16] [17] [18] [19] [20] [21] [22] [23] [24] [25] [26] [27] [28] [29] [30] [31] [32] Nilan RA, Konzak CF (1961). Increasing the efficiency of mutation induction. Mutation and Plant Breeding 891: 437-460. Matsumura S, Kondo S, Mabuchi T (1963). Radiation genetics in wheat- VIII. Radiation Botany 3: 29-40. Juran HM, Nath P, Banerjee BK, Datta SK (1986). Gamma ray induced dwarf mutant of winged bean, grown in Sri Lanka. 2nd Int. Symposium on winged bean. Colombo, Sri Lanka. January1981. 34. Klu GYP, Jacobsen E, Harton AM (1997). Induced mutations in winged bean. Euphytica 98: 99-107. Giroux MJ, Morris CF (1998). Wheat grain hardness results from highly conserved mutations in the friabilin components puroindoline a and b. Proc. Natl. Acad. Sci. 95: 6262-6266. Chakraborty SN (1995). Mutation breeding in India with particular reference to PNR rice varieties. J. Nuclear Agric. Biol. 24: 73-82. Hannah C, Giroux M, Boyer C (1993). Biotechnological modification of carbohydrates for sweet corn and maize improvement. Scientia Horticulturea. 55: 177-197. MacLeod MR (1994). Analysis of an allelic series of mutants at the r locus of pea. Ph. D., Univ. East Arglia, U.K. Webb BD, Bollich CN, Adair CR, Jahnstoneth NR (1968). Characteristics of rice varieties in the Deptt. of Agriculture collection. Crop. Sci. 8 : 361 - 5. Hensz RA (1991). Mutation breeding of grape fruit. In: Proc. Plant Mutation Breed. for Crop Improvement. Vol. I. Internl. Symp. IAFA and Food Aric. Org. of the UN. IEAE SM-311, Vienna, 533-536. Lapade AG, Veluz AMS, Santos IS (1995). Genetic improvement of the Queen variety of pineapple through induced mutation and i n vitro culture techniques. In: Proc. Induced mutations and Molec. Techn. For crop improvement. International Symp. IAEA and Food Agric. Org. oh the UN, IAEA, Vienna. 684-687. Eberhart SA, Russell WA (1966). Stability parameter for comparing varieties. Crop Sci. 6: 36 -40. Allard RW, Bradshaw AD (1964). Implication of genotype-environment interaction in applied breeding. Crop Sci. 4: 503-508. Kang MS, Pham HN (1991). Simultaneous selection for high yielding and stable crop genotypes. Agron. J. 83: 161-165. Kang MS (1998). Using genotype by environment interaction for Crop cultivar development. Adv. Agron. 35: 199-252. Lu HY, Wu HP (1986). Studies of genotype-environment interaction of Arabidopsis thaliana. Bot. Bull. Academia Sinica. 27: 187207. Scheiner SM (1993). Genetics and Evolution of Phenotypic Plasticity. Annual Review of Ecology and Systematics l. 24: 35-68. Immer FR, Powers LR (1934). Statistical determination of barley varietals adaptation. J. American Soc. Agron. 26: 403-419. Salmon SC (1951) Analysis of variance and long time variety tests of wheat. Agron. J. 43: 562-570. Horner TW, Frey KJ (1957). Methods for determining natural areas for oat varietals recommendation. Agron. J. 49: 313-315. Sandison A, Barlett BO (1958) Comparison of varieties for yield. J. Nat. Inst. Agric. Bot. 8: 351-357. Yates F, Cochran WG (1938). The analysis of groups of experiments. J. Agric. Sci. 28: 556-580. Wricke G (1962). Über eine Methode zur Erfassung der ökologischen Streubreite in Feldversuchen, Z. Pflangenzuechd. 47: 92-96. Finlay KW, Wilkinson GN (1963). The analysis of adaptation in a plant breeding program. Australian J. Agric. Res. 14: 742-754. Perkins JM, Jinks JL (1968). Environmental and genotype environmental components of variability. III Multiple lines and cro sses, Heredity 23: 339-346. Hanson WD (1970). Genotype stability. Theor. Appl Genet. 40: 226-231. Tai GCC (1971). Genotype stability analysis and its application to potato regional trials. Crop Sci. 11: 184-190. Nassar R, Huhn M (1987) Studies on estimation of phenotype stability. Test of significance for nonparametric measures of phenotypic stability. Biometry 43: 45-54. Backer HC (1981). Biometrical and Empirical relations between different concept of phenotypic stability. Quantitative Genetics and Breeding Methods. Versailles, INRA. pp 307-314. Singh P, Agarwal DK (2003). Sustainability index as an aid for determining the genotypic stability in diploid cotton ( Gossypium arboreum). J. Cotton Res. Dev. 17: 90-92. Gangwar B, Katyal V, Anand KV (2004). Stability and efficiency of cropping systems in Chatisgarh and Madhya Pradesh. Indian J. Agric. Sci. 74: 521-528. Tuteja OP (2006). Comparative studies on stability parameters and sustainability index for selecting stable genotypes in upland cotton (Gossypium hirsutum L.). Indian J. Genet. 66(3): 221-224. www.iosrjournals.org 66 | Page
  • 6. Genotype × Environment Interaction and Stability Analysis in Mungbean [33] [34] [35] [36] [37] [38] [39] [40] [41] [42] [43] [44] [45] Atta BM, Shah TM, Abbas G, Haq MA (2009). Genotype x Environment interaction for seed yield in kabuli chickpea (Cicer arietinum L.) genotypes developed through mutation breeding. Pak. J. Bot. 41(4): 1883-1890. Hamblin J, Knight R, Atkinson MJ (1978). The influence of systematic micro-environmental variation on individual plant yield within selection plots. Euphytica. 27 (2): 497-503. Comstock RE, Moll RH (1963). Genotype-environment interaction stat. Genet. Pl. Breed. 982: 164-196. Jinks JL, Mather K (1955). Stability in development of heterozygotes and homozygotes. Proc. R. Soc. 143 : 561-578 Singh B, Nanda P (1997). Stability analysis for seed yield in green gram (Vigna radiata (L.) Wilczek). Environment and Ecology 15(3): 595-597 . Manivannan N, Ramasamy A, Nadarajan N (1998). Phenotypic stability analysis in greengram (Phaseolus radiatus). Indian Journal of Agricultural Sciences 68(1): 31-32 . Baker RJ (1988). Differential response to environmental stress. Proceed 2 nd Internat. Conf. Quantitative Genetics. pp 492-504, Sinauer, Sunderland, M.A. Blum A (1983). Genetic and physiological relationship in plant breeding for drought resistance. In: Plant production and management under drought conditions. (Eds.) J.T. Stone and W.O. Willis, Elsevier, Amsterdam, pp. 195-205. Matus A, Slinkard AF, Kessel C. (1997). Genotype x environment interaction for carbon isotope discrimination in spring wheat. Ibid. 37(1): 97-102. Hardwick RC, Wood JT (1972). Regression methods for studying genotype-environment interactions. Heredity 28: 209-222. Perkins JM, Jinks JL. (1973) The assessment and specificity of environmental and genotype-environmental components of variability. Heredity 30: 111-126. Fripp YJ, Caten CE (1973). The relationship between mean expression and sensitivity to change in environment. Heredity 30: 341349. Lin CS, Binns MR, Lefkovitch LP (1986). Stability analysis : Where do we stand? Crop Sci. 26 : 894-900. Table 1: List of the elite mutant lines Line Developed from Treatment dosage Line Developed from Treatment dosage CUM 1 B 105 45 KR γ ray CUM 16 B1 60 KR γ ray CUM 2 B 105 15 KR γ ray CUM 17 B1 1.50% EMS CUM 3 B 105 1.50% EMS CUM 18 B1 45 KR γ ray CUM 4 B 105 30 KR γ ray CUM 19 B1 1.00% EMS CUM 5 B 105 60 KR γ ray CUM 20 B1 60KR γ ray CUM 6 B 105 30 KR γ ray CUM 21 SML 32 15 KR γ ray CUM 7 B 105 1.50% EMS CUM 22 SML 32 30 KR γ ray CUM 8 B 105 0.50% EMS CUM 23 SML 32 0.50% EMS CUM 9 B 105 15 KR γ ray CUM 24 SML 32 45 KR γ ray CUM 10 B 105 1.00% EMS CUM 25 SML 32 0.50% EMS CUM 11 B1 30 KR γ ray CUM 26 SML 32 15 KR γ ray CUM 12 B1 45 KR γ ray CUM 27 SML 32 45 KR γ ray CUM 13 B1 15 KR γ ray CUM 28 SML 32 15 KR γ ray CUM 14 B1 0.50% EMS CUM 29 SML 32 30 KR γ ray CUM 15 B1 30 KR γ ray CUM 30 SML 32 15 KR γ ray Table 2: Stability parameters and their underlying stability concepts Stability parameters Symbol Stability concept involved Regression coefficient Deviation mean square bi s2d Biological/ Agronomic Agronomic Table 3: Summary of yield and its components over the seven environments for the genotypes of mungbean Pods / plant Average value Range Environment with Highest Mean Lowest Mean Pods / cluster Pod length Seeds /pod Seeds / plant 34.65 28.73 – 53.17 6.14 5.99 – 6.38 6.55 6.21 – 7.29 11.41 10.61 – 12.76 538.58 435.04 – 857.28 E6 E3 E7 E3 E6 E3 E6 E3 www.iosrjournals.org E6 E1 100 seed weight 4.22 4.08 – 4.31 E6 E3 Seed yield 16.51 15.20 – 18.93 E6 E1 67 | Page
  • 7. Genotype × Environment Interaction and Stability Analysis in Mungbean Table 4: Analysis of variance (mean square) for yield and yield components (Eberhart And Russell, 1966) Sources of variation d. f. Genotypes Environments Genotype × Environment Environment +( Genotype × Environment) Environments (linear) Genotype × Environment (linear) Pooled deviation Pooled error 32 6 192 198 1 32 165 224 Pods / plant 71.72**+ + 2396.60* * 12.88**+ + 85.11**+ + 14379.66 ** 19.14**+ + 11.27** 5.01 Pods / cluster 0.59 0.57 0.23 Pod length 0.43 4.05**+ + 0.15 Seeds /pod 1.59** + 14.75* 0.23 0.27 0.93 3.44 0.42 24.32** ++ 0.09 88.49* *++ 0.73 0.18 0.06 0.16 0.04 0.44 0.12 ++ 3618.39**++ 27408.29**+ + 473213.40** ++ 10603.92**+ + 2153.83** 720.32 *++ 0.50 Seeds / plant 45408.87**+ + 788685.25** 100 seed weight 1.37* 0.31 0.05 Seed yield 36.59*+ 61.42**+ + 4.20** 0.06 5.93**++ 1.85 0.07 368.55** ++ 6.96**++ 0.05 0.03 3.53** 2.60 Linear component (%) 62.94 70.00 36.00 62.39 83.12 58.33 66.35 Non-linear component (%) 37.06 30.00 64.00 37.61 16.88 41.67 33.65 Significant against polled error at 5% is denoted by * Significant against polled error at 1% is denoted by** Significant against polled deviation at 5% is denoted by + Significant against polled deviation at 1% is denoted by ++ Table 5: Estimates of environmental additive effects (Ig) for seven environments for seed yield and its component of mungbean E1 Seed yield -1.31 Pods / plant -4.30 E2 -1.29 -1.75 0.05 E3 -0.14 -5.92 -0.15 E4 0.04 -3.35 -0.11 E5 1.13 1.54 -0.02 E6 2.42 18.52 E7 -1.30 -4.74 Location Pods / cluster -0.07 Seeds /pod -0.11 Seeds / plant -103.49 0.02 0.06 -65.70 0.06 -0.30 -0.79 -89.58 -0.13 -0.16 -0.44 -96.97 -0.04 -0.02 -0.07 92.11 0.05 0.04 0.78 1.36 318.75 0.10 0.24 0.03 0.05 -54.79 0.06 Pod length -0.08 100 seed weight -0.01 Table 6: Estimates of stability parameters according to Eberhart And Russell (1966) model for yield and yield components of mungbean Line CUM1 CUM2 CUM3 CUM4 CUM5 CUM6 CUM7 CUM8 CUM9 CUM10 B105 CUM11 CUM12 CUM13 CUM14 CUM15 CUM16 CUM17 CUM18 CUM19 CUM20 B1 CUM21 CUM22 CUM23 CUM24 CUM25 CUM26 CUM27 CUM28 CUM29 CUM30 SML32 Grand mean μi = mean Seed yield μi 16.73 16.52 17.95 16.32 16.50 15.53 15.77 16.03 16.11 16.60 10.50 19.14 20.00 19.22 19.16 17.43 16.84 17.41 17.57 17.15 17.08 10.75 15.73 16.39 16.51 17.36 15.92 17.01 17.32 16.59 16.58 16.58 10.47 16.51 bi 0.52 0.88 1.87 0.93 0.64 0.43 0.30 0.79 0.44 1.10 0.01 3.19 2.38 1.22 3.23 1.35 0.37 1.72 1.37 1.17 0.71 -0.02 0.28 0.79 0.96 1.64 0.59 0.86 0.86 0.57 0.62 1.27 -0.02 - Pods per plant μi bi 35.53 1.04 35.53 1.24 33.13 1.16 36.20 1.15 33.12 1.18 33.77 1.04 34.76 1.20 36.13 1.25 36.05 1.20 34.82 1.24 24.96 0.44 40.80 1.28 38.88 1.04 36.03 1.02 34.91 1.10 35.71 1.12 34.93 1.05 35.03 1.14 35.07 1.11 34.10 1.07 38.90 1.10 27.33 0.49 35.59 0.89 36.16 0.88 34.93 1.00 35.20 0.84 34.38 0.85 35.33 0.90 35.26 0.71 35.84 0.86 37.38 0.86 35.12 0.84 26.48 0.70 34.65 - Pods per cluster μi bi 6.74 1.03 6.31 -2.03 6.12 -0.12 6.43 1.32 6.08 0.42 6.41 -0.71 6.07 0.16 6.10 0.17 6.37 0.27 6.14 0.90 5.70 0.82 6.56 0.72 6.74 1.54 6.15 1.10 5.93 2.66 6.04 1.95 6.29 2.55 6.23 3.65 6.24 2.43 6.09 1.85 6.19 1.03 5.52 -0.11 6.19 0.50 5.97 -0.17 5.79 -0.35 5.84 -1.80 6.22 1.07 6.17 1.15 6.31 0.91 6.06 -1.95 6.20 0.39 6.17 -0.42 5.39 -0.44 6.14 - bi = regression coefficient www.iosrjournals.org Pod length μi 7.03 6.36 6.28 6.81 6.60 6.54 6.23 6.34 6.78 6.57 6.34 6.63 6.77 6.44 6.54 6.60 6.55 6.39 6.46 6.60 6.48 6.09 6.72 6.95 6.58 6.68 6.55 6.81 6.54 6.77 6.46 6.66 5.75 6.55 bi 0.98 1.69 1.40 1.03 1.13 0.75 1.69 1.43 0.90 1.36 0.18 0.88 0.42 1.30 1.08 0.78 0.73 0.41 1.41 1.41 1.42 0.57 0.92 0.68 0.75 1.01 0.86 0.70 1.11 1.23 1.05 0.98 1.05 - Continued 68 | Page
  • 8. Genotype × Environment Interaction and Stability Analysis in Mungbean Table 6: Estimates of stability parameters according to Eberhart And Russell (1966) model for yield and yield components of mungbean Line CUM1 CUM2 CUM3 CUM4 CUM5 CUM6 CUM7 CUM8 CUM9 CUM10 B105 CUM11 CUM12 CUM13 CUM14 CUM15 CUM16 CUM17 CUM18 CUM19 CUM20 B1 CUM21 CUM22 CUM23 CUM24 CUM25 CUM26 CUM27 CUM28 CUM29 CUM30 SML32 Grand mean Seeds per pod μi bi 11.57 1.28 11.32 1.40 11.42 0.90 11.41 0.98 11.82 1.43 11.22 0.98 11.18 1.89 11.57 1.77 11.75 0.31 11.72 1.19 10.26 0.28 11.82 0.27 12.43 1.05 11.44 1.22 11.30 1.43 11.10 1.59 11.34 1.27 11.41 0.99 11.64 1.50 11.51 1.68 11.91 1.38 10.24 0.70 11.18 0.24 11.51 0.98 11.68 0.54 11.52 0.89 11.79 0.37 11.41 0.34 11.60 -0.11 11.56 0.97 11.73 0.30 12.11 0.80 10.21 0.47 11.41 - Seeds per plant μi bi 539.95 1.23 541.96 1.20 542.85 1.43 549.40 1.05 519.12 1.17 505.15 1.24 523.21 1.27 537.65 1.14 574.68 0.40 541.91 1.22 297.17 0.75 627.47 0.85 610.33 0.86 636.81 0.54 636.25 0.71 591.84 0.58 567.10 0.67 588.30 0.61 615.46 0.60 592.47 0.62 552.23 0.64 306.76 0.79 537.55 1.11 579.99 1.10 526.76 1.24 576.37 1.33 521.69 1.27 571.48 1.19 534.14 1.29 553.30 1.11 551.68 1.18 537.23 1.25 342.67 0.74 538.58 - μi = mean 100 seed weight μi bi 4.30 0.95 4.30 1.09 4.38 1.66 4.34 0.83 4.36 0.89 4.27 1.08 4.30 1.87 4.44 2.34 4.48 0.08 4.35 0.65 2.50 1.54 4.47 1.30 4.83 0.66 4.40 1.18 4.33 1.19 4.27 2.45 4.35 3.63 4.23 1.85 4.32 1.64 4.31 2.03 4.28 1.50 3.14 1.36 4.31 0.81 4.21 0.02 4.30 0.34 4.23 0.31 4.28 -0.05 4.40 -0.56 4.37 -0.40 4.28 0.21 4.33 0.14 4.38 -3.15 3.08 1.59 4.22 - bi = regression coefficient Table 7: Estimates of sustainability index for seed yield in 33 genotypes of mungbean Genotypes Mean Yield Standard Deviation Sustainability Index (%) Stability 1.31 Best performance of a genotype in any year 18.72 CUM1 16.73 CUM2 16.52 82.39 Very High 1.80 19.28 76.33 High CUM3 CUM4 17.95 3.50 24.46 59.08 Moderate 16.32 1.46 18.94 78.46 High CUM5 16.5 1.78 20.21 72.86 High CUM6 15.53 0.68 16.86 88.09 Very High CUM7 15.77 0.52 16.81 90.72 Very High CUM8 16.03 1.23 18.91 78.27 High CUM9 16.11 0.80 17.89 85.60 Very High CUM10 16.6 1.65 20.21 73.98 High B105 10.5 0.60 11.67 84.83 Very High CUM11 19.14 4.29 27.86 53.30 Moderate CUM12 20 3.96 24.72 64.90 High CUM13 19.22 3.61 22.88 68.24 High CUM14 19.16 4.14 27.56 54.52 Moderate CUM15 17.43 2.20 21.85 69.70 High ……Continued www.iosrjournals.org 69 | Page
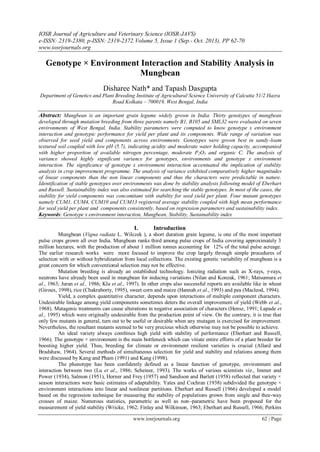
  • 9. Genotype × Environment Interaction and Stability Analysis in Mungbean Table 7: Estimates of sustainability index for seed yield in 33 genotypes of mungbean Genotypes Mean Yield Standard Deviation Best performance of a genotype in any year Sustainability Index (%) Stability CUM16 CUM17 16.84 17.41 1.05 2.81 19.07 23.21 82.80 62.89 Very High High CUM18 CUM19 CUM20 B1 CUM21 CUM22 17.57 17.15 17.08 10.75 15.73 16.39 2.81 2.32 1.37 1.04 0.63 1.51 23.76 22.29 19.42 12.49 16.75 18.72 62.11 66.55 80.92 77.70 90.18 79.51 High High Very High High Very High High CUM23 CUM24 CUM25 CUM26 CUM27 CUM28 16.51 17.36 15.92 17.01 17.32 16.59 1.77 3.15 0.92 1.72 1.49 1.06 19.28 22.32 17.22 19.07 19.39 18.09 76.43 63.64 87.11 80.16 81.63 85.83 High High Very High Very High Very High Very High CUM29 CUM30 SML32 16.58 16.58 10.47 1.10 1.75 0.91 18.29 20.49 12.47 84.63 72.39 76.68 Very High High High Figure 1 : Relation between seed yield per plant (gm) and stability genotypes plotted graphically with b i on x axis and average seed yield per plant (gm) on y axis www.iosrjournals.org 70 | Page