“Investigation of Time-Cost Effectiveness on Construction Projects”
•
0 gostou•395 visualizações

Development projects undertaken in various sectors of economy and finance are building blocks of national economy. This paper examines the time-cost effectiveness on construction projects by quantification of 16 different project performance parameters applied on 49 construction projects (both public and private sector projects). A questionnaire was drafted to test the parameters and criteria adopted when assessing the success of construction projects. The results shows that for general group of construction projects all 16 parameters have significant impact on cost growth.

Recomendados
Recomendados
Mais conteúdo relacionado
Mais procurados
Mais procurados (20)
Semelhante a “Investigation of Time-Cost Effectiveness on Construction Projects”
Semelhante a “Investigation of Time-Cost Effectiveness on Construction Projects” (20)
Mais de IOSR Journals
Último
Último (20)
“Investigation of Time-Cost Effectiveness on Construction Projects”
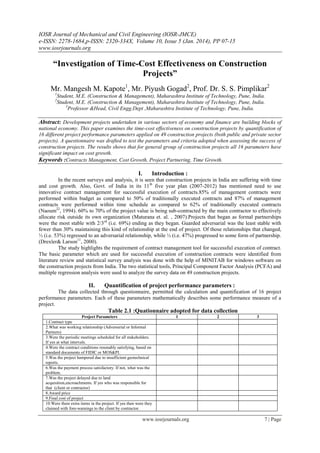
- 1. IOSR Journal of Mechanical and Civil Engineering (IOSR-JMCE) e-ISSN: 2278-1684,p-ISSN: 2320-334X, Volume 10, Issue 5 (Jan. 2014), PP 07-15 www.iosrjournals.org www.iosrjournals.org 7 | Page “Investigation of Time-Cost Effectiveness on Construction Projects” Mr. Mangesh M. Kapote1 , Mr. Piyush Gogad2 , Prof. Dr. S. S. Pimplikar2 1 Student, M.E. (Construction & Management), Maharashtra Institute of Technology, Pune, India. 2 Student, M.E. (Construction & Management), Maharashtra Institute of Technology, Pune, India. 3 Professor &Head, Civil Engg.Dept ,Maharashtra Institute of Technology, Pune, India. Abstract: Development projects undertaken in various sectors of economy and finance are building blocks of national economy. This paper examines the time-cost effectiveness on construction projects by quantification of 16 different project performance parameters applied on 49 construction projects (both public and private sector projects). A questionnaire was drafted to test the parameters and criteria adopted when assessing the success of construction projects. The results shows that for general group of construction projects all 16 parameters have significant impact on cost growth. Keywords :Contracts Management, Cost Growth, Project Partnering, Time Growth. I. Introduction : In the recent surveys and analysis, it is seen that construction projects in India are suffering with time and cost growth. Also, Govt. of India in its 11th five year plan (2007-2012) has mentioned need to use innovative contract management for successful execution of contracts.85% of management contracts were performed within budget as compared to 50% of traditionally executed contracts and 87% of management contracts were performed within time schedule as compared to 62% of traditionally executed contracts (Naoum22 , 1994). 60% to 70% of the project value is being sub-contracted by the main contractor to effectively allocate risk outside its own organization (Maturana et. al. , 2007).Projects that began as formal partnerships were the most stable with 2/3rd (i.e. 69%) ending as they began. Guarded adversarial was the least stable with fewer than 30% maintaining this kind of relationship at the end of project. Of those relationships that changed, ½ (i.e. 53%) regressed to an adversarial relationship, while ½ (i.e. 47%) progressed to some form of partnership. (Drexler& Larson11 , 2000). The study highlights the requirement of contract management tool for successful execution of contract. The basic parameter which are used for successful execution of construction contracts were identified from literature review and statistical survey analysis was done with the help of MINITAB for windows software on the construction projects from India. The two statistical tools, Principal Component Factor Analysis (PCFA) and multiple regression analysis were used to analyze the survey data on 49 construction projects. II. Quantification of project performance parameters : The data collected through questionnaire, permitted the calculation and quantification of 16 project performance parameters. Each of these parameters mathematically describes some performance measure of a project. Table 2.1 :Quationnaire adopted for data collection Project Parameters 1 2 3 1.Contract type 2.What was working relationship (Adverserial or Informal Partners) 3.Were the periodic meetings scheduled for all stakeholders. If yes at what intervals. 4.Were the contract conditions resonably satisfying, based on standard documents of FIDIC or MOS&PI. 5.Was the project hampered due to insufficient geotechnical reports. 6.Was the payment process satisfactory. If not, what was the problem. 7.Was the project delayed due to land acquisition,encroachments. If yes who was responsible for that (client or contractor) 8.Award price 9.Final cost of project 10.Were there extra items in the project. If yes then were they claimed with fore-warnings to the client by contractor.
- 2. “Investigation of Time-Cost Effectiveness on Construction Projects” www.iosrjournals.org 8 | Page 11.Nos. of change orders /extra items. 12.Actual contract durtion (days charged) 13.Project duration at time of award (total days allowed) 14.Additional days granted. 15.Nos. of days of liquidated damage (LDs) 16.LDs cost per day. 17.Nos. of claims (out of scope &no change order received). 18.Total cost of claims. 19.Nos. of disputes went to arbitration. 20.Total cost of these disputes. 21.Time required to settle these disputes. 2.1 Award Price It is the original contract amount which provides a method to separate projects based on their relative financial size. 2.2 Percentage cost growth Cost growth (CG) is a standard measure of project performance. It is defined as the change in contract amount with respect to original contract amount. This number can then be converted to a % of growth over original contract amount. 2.3 Lack of periodic meetings This factor is useful to study the impact of lack of periodic meetings on a project success in terms of cost growth, time growth, claim cost and dispute cost. The projects with lack of periodic meetings were marked as 1 and project which were having some schedule for periodic meetings were marked as 0. 2.4 Lack of geotechnical investigation This parameter is useful to study the impact on cost growth and time growth of a project due to lack of geotechnical investigations before the start of project. Projects are mainly hampered at foundation levels due to improper or no geotechnical investigation. The project in which work was not hampered due to sufficient geotechnical survey was marked as 0 and projects which were hampered due to geotechnical problems encountered at the time of execution were marked as 1. 2.5 Working relationship This factor is useful to study, the working relationships between the contractor and client for a project. Working relationships were categorized as adversarial, guarded adversarial and partners. The project was marked as 1, 0.5 and 0 for above working relationships. 2.6 Extra items This parameter is useful to study the impact of contract quality on project performance. This parameter quantifies the number of times the owner and the contractor had to reach an agreement. 2.7 Lack of fore warnings to extra items This factor is useful to study whether there was lack of communication as and when extra work was identified in a project. The project was marked as 1, if there was no forewarnings to extra items which may result to claims and disputes at the end of project. The project was marked as 0 if respondent had good communications regarding extra items. 2.8 Cost per change order (c/co) This factor allows developing an idea of the order of magnitude of changes that occur on typical project. 2.9 Percentage increase per change order (% inc /CO) It is the measure of incremental cost growth. A contract with no change orders would be the perfect situation and have no cost growth. The larger the average percent increase per change order the higher the
- 3. “Investigation of Time-Cost Effectiveness on Construction Projects” www.iosrjournals.org 9 | Page probability that some errors of design were contained in the project. This parameter is described by the following equation; 2.10 Percentage time growth (% TG) Time growth (TG) is the change in time with respect to the original contract completion date. Time growth is generally a result of changes in scope of the project. Time growth can be either positive (when the project is completed later than the original completion date) or negative (when the project is completed earlier than the original completion). 2.11 Percentage equivalent liquidated cost (%ELDC) The data collected on 49 projects indicated sever time growth (up to 30-60%). Though, liquidated damage clause was included in almost all projects, it was seen that, in very few cases it was applied. This shows that either project was not planned properly or time was not the essence of the project. But still, to study the impact of liquidated damage cost on project performance in terms of cost and time growth, above parameter is useful. It is necessary to study this parameter because, in every project having LD clause it is expected that time should be the essence of project. 2.12 Percentage claim cost (% CC) Claims are requested by contractors for compensation for the work performed that the contractor believes is outside the scope of the contract. Generally, claims begin as contractor requests for a change order and become claims when the owner rejects the change order request. The percentage claim cost can be calculated from the following equation, 2.13 Percentage dispute cost (% DC) When claims are disagreed, it results in disputes. The partnering suggests the establishment and use of an issue escalation system which results in significantly low numbers of disputes. Disputes cost as a percentage of original cost is calculated as follows 2.14 Lack of standard draft conditions This parameter is useful to study, the quality of contract document in terms of contract conditions. Ministry of Statistics and Programme Implementation (MOS&PI), Govt. of India, along with Construction Industry Development Council (CIDC) in their Annual report has suggested to domestic construction organizations to draft contract conditions on the principles of standard draft conditions published by MOS&PI document. For global tenders it is suggested to follow FIDIC document while drafting contract conditions. In this survey, project which followed some of the standard contract document were marked as 0 and projects with unsatisfied contract conditions were marked 1. 2.15 Improper payment process Payment process is one of the cause for delays in projects which results in cost growth, disputes etc. The projects in which respondent thought that there was improper payment process were marked as 1 and o for vice versa. 2.16 Issues related on client part This parameter is useful to study the impact of issues such as land acquisition, land encroachments, material supply, clearance to site entry, electric supply etc on project progress, which are to be fulfilled by the
- 4. “Investigation of Time-Cost Effectiveness on Construction Projects” www.iosrjournals.org 10 | Page client. The projects which were suffering due to above reasons were marked as 1. The projects which did not suffered due to above reasons were marked as 0. III. Analysis of Survey Results After quantification of all the 16 parameters for the survey data on 49 construction projects including private sector and public sector, the groups were formed for further statistical analysis. The groups formed were as follows A) General group of projects (49 projects). B) Public sector group of projects (25 projects). C) Private sector group of projects (24 projects). D) Building sector projects (26 projects). E) EPC contract projects (17 projects). F) Item rate contract projects (32 projects). Two statistical tools, Principal Component Factor Analysis (PCFA) and Multiple Regression, were used to analyze data from the survey questionnaire. Factor analysis was used to identify the component factors; whereas, multiple regression was used to seek the strongest predictors from the component factors for cost growth (%CG).The analysis was conducted using the MINITAB for Windows software package that provides a comprehensive range of statistical programs suitable for statistical analysis. The analysis is provided in Table 3.1. Table 3.1: Quantified data on 49 projects with 16 identified project performance parameters (continued……)
- 5. “Investigation of Time-Cost Effectiveness on Construction Projects” www.iosrjournals.org 11 | Page KMO and Bartlett's Test .474 218.230 120 .000 Kaiser-Mey er-Olkin Measure of Sampling Adequacy . Approx. Chi-Square df Sig. Bartlett's Test of Sphericity (continued…..) Prior to principal component factor analysis (PCFA) and multiple regression analysis, all the identified parameters (variables) and the sample size were tested for potential outliers and normality using SPSS for Windows statistical software package. (i) Bartlett’s test of sphericity: This test is used to test the null hypothesis that the variables (identified parameters) in the population correlation matrix are uncorrelated. If the observed significance level (p-value) is less than 0.05 then, it can be taken as small enough to reject the hypothesis. It can then be concluded that, the strength of relationship among the variables (identified parameters) is strong and it is good idea to precede a factor analysis for the data. (ii) Normality test for sample: Normality test is useful to study whether our sample data is normal or not. We can assess population normality with a normal probability plot, which plots the ordered data values against values that we expect them to be near if the sample‟s population is normally distributed. If the population is normal, the plotted points will form an approximately straight line. Thus sample is adequate for regression analysis (Chan4 et al., 2004). It was manifested from the test results that all samples satisfied the basic assumptions of a linear regression model and were confirmed acceptable and reliable. 3.1Analysis of general group (49 projects) The above group contains 49 projects including public sector, infrastructure sector and private sector projects. Since the Bartlett‟s test of sphericity was significant at p=0.000 with approx. Chi-square value =218.230 and df =120, Principal component factor analysis (PCFA) was performed on 16 identified project performance parameters (see Table 3.1).
- 6. “Investigation of Time-Cost Effectiveness on Construction Projects” www.iosrjournals.org 12 | Page 16151413121110987654321 3.5 3.0 2.5 2.0 1.5 1.0 0.5 0.0 Factor Number Eigenvalue Scree Plot of Award price, ..., Issues reltd on client part Also following the Eigen value greater than one rule, four factor solution was performed. The Scree plot of 16 identified parameters for general group is as follows – ————— 11.05.09 15:53:53 ———————————————————— Welcome to Minitab, press F1 for help. Factor Analysis: 16 Parameters as listed below Principal Component Factor Analysis of the Correlation Matrix-VARIMAX rotation Sorted Rotated Factor Loadings and Communalities Variable Factor1 Factor2 Factor3 Factor4 Communality Wrkgrlshp 0.774 -0.217 0.100 -0.051 0.659 imprpamt pro. 0.718 -0.033 -0.148 0.057 0.541 Lack of perdmtngs 0.674 0.236 0.172 0.268 0.612 % TG 0.671 0.345 -0.023 -0.031 0.571 Ext. Itm 0.547 -0.121 -0.445 -0.082 0.518 % inc / CO 0.131 0.793 0.284 -0.026 0.727 C/CO -0.225 0.788 0.030 -0.277 0.748 % CG 0.150 0.703 -0.340 0.161 0.658 Issues reltd on client part 0.185 -0.008 0.683 -0.327 0.607 % CC 0.140 0.011 -0.639 -0.144 0.449 % ELDC 0.399 0.027 -0.415 -0.073 0.338 % DC -0.089 -0.160 -0.310 -0.269 0.202 Lack of geot.Invtgn 0.166 0.090 0.236 -0.717 0.605 lack of fore warng to ex. itm 0.011 -0.033 -0.298 -0.686 0.560
- 7. “Investigation of Time-Cost Effectiveness on Construction Projects” www.iosrjournals.org 13 | Page Award price -0.117 0.103 -0.029 -0.570 0.350 Lack of std. drftcondn 0.407 0.165 -0.403 0.445 0.553 Variance 2.8371 2.0548 1.9073 1.9009 8.7002 % Var 0.177 0.128 0.119 0.119 0.544 Factor Score Coefficients Variable Factor1 Factor2 Factor3 Factor4 Award price -0.028 0.049 -0.046 -0.299 % CG -0.014 0.351 -0.187 0.079 Lack of perdmtngs 0.242 0.082 0.150 0.124 Lack of geot.Invtgn 0.106 0.019 0.117 -0.381 Wrkgrlshp 0.309 -0.150 0.121 -0.059 Ext. Itm 0.177 -0.077 -0.198 -0.082 lack of fore warng to ex. itm 0.010 -0.018 -0.182 -0.376 C/CO -0.110 0.396 -0.032 -0.126 % inc / CO 0.032 0.377 0.143 0.001 % TG 0.232 0.137 0.031 -0.040 % ELDC 0.117 0.004 -0.197 -0.068 % CC 0.006 0.014 -0.342 -0.102 % DC -0.039 -0.070 -0.180 -0.152 Lack of std. drftcondn 0.093 0.078 -0.177 0.211 imprpamt pro. 0.255 -0.048 -0.020 -0.004 Issues reltd on client part 0.137 -0.037 0.377 -0.161 In the rotated factor loading table above, the parameters whose loadings are marked bold under the respective factors represents that principle component factor. The interpretation of component factors is as follows - Factor 1: Lack of contract management:Working relationship, improper payment process, lack of periodic meetings, %TG, and extra items.
- 8. “Investigation of Time-Cost Effectiveness on Construction Projects” www.iosrjournals.org 14 | Page 7550250-25-50 99 95 90 80 70 60 50 40 30 20 10 5 1 Residual Percent Normal Probability Plot (response is % CG) Factor 2: Lack of planning at pre-contact stage:% increase per change order and cost per change order. Factor 3: Improper contract execution:issues related on client part, % claim cost, % equivalent liquidated damage cost, % dispute cost. Factor 4: Inadequate contract document:Lack of geotechnical investigation, lack of forewarning to extra item, award price, lack of standard draft conditions. Minitab calculates factor scores by multiplying factor score coefficients and data after they have been centered by subtracting means. Factors scores are used to examine the behaviour of observations and in other analysis such as regression or MANOVA. The below graph shows straight line of plotted points for general group of parameters, thus sample is normal and adequate for regression analysis. Regression Analysis: % CG V/s 4 component factors The regression equation is % CG = 26.7 + 5.31 Improper contract management + 24.9 Poor pre-contract planning - 12.0 Improper contract execution + 5.69 Inadequate contract document Predictor Coef SECoef T P Constant 26.672 3.095 8.62 0.000 Improper contract management 5.308 3.127 1.70 0.047 Poor pre-contract planning 24.919 3.127 7.97 0.000 Improper contract execution -12.036 3.127 -3.85 0.000 Inadequate contract document 5.690 3.127 1.82 0.056 S = 21.6643 R-Sq = 65.8% R-Sq (adj) = 62.6% Results: All the four principal component factors, i.e. Improper contract management (p=0.047), Poor pre- contract planning (p=0.000), Improper contract execution (p=0.000) & Inadequate contract document (p=0.056) are significant with p-values less than and closer to 0.05.
- 9. “Investigation of Time-Cost Effectiveness on Construction Projects” www.iosrjournals.org 15 | Page Therefore, all the 16 identified performance parameters are significantly contributing to the variance of percentage cost growth (%CG) i.e. In general group of construction projects all 16 parameters have significant impact on cost growth. IV. Conclusion and Recommandation : As per statistical analysis, all groups of projects are badly suffering due to impact of basic project performance parameters. These parameters none other than the part of a contract between client and contractor. Therefore there is only need of professional approach to execute the contract processes. This can be done efficiently by project partnering.The study also highlights the requirement of contract management tool for successful execution of contract From the study following recommandations can be drawn - (1) Time should be the essence of the project i.e. for successful implementation of project partnering, the given project must be truly „time bound‟. (2) There must be proper planning, documentation and foresightedness at pre-contract stage for successful implementation of project partnering. (3) Proper planning must be followed by appropriate estimation of quantities and scope of project must be well defined for smooth process of project partnering. (4) Contract conditions must be harmonized on basis of standard contract conditions published by MOS&PI or FIDIC which are recommended by Government of India. This will help to implement project partnering effectively. References [1]. Abudayyeh, O. (1994). “Partnering: A team building approach to quality construction management.” J. Mgmt. in Engg., 10(6), 26–29. [2]. Anderson, L.L., Brookshire, J.K., and Gudelski, P.J. (2004). “A partnering success story at the Woodrow Wilson Bridge.” J. Leadership & Mgmt. in Engg., 38-45. [3]. Chan, A.P., Chan, D.W., Chiang, Y.H., Tang, B.S., Chang, E.H., and Ho, K.S. (2004). “Exploring critical success factors for partnering in construction project.” J. of construction Engg. & Mgmt.., 130(2), 188-198. [4]. Chan, A.P., Chan, D.W., Fan, L.C., Lam, P.T., and Yeung, J.F. (2004). “A comparative study of project partnering practices in Hong Kong.” CII- Hong Kong conference 2004. [5]. Cheng, E.W., Heng, L. (2004). “Development of a practical model of partnering for construction projects.” J. of construction Engg. & Mgmt.., 130(6), 790-798. [6]. “Comprehensive water supply scheme to Chavara&Panmana.” Contract Doc. (2006). Kerala Water Authority. [7]. Dharwadker, P.P. (2001). “Emerging trends in contract management and dispute resolution by dispute review boards.” J. CE & CR., Contracts & Mgmt., Oct, 23-27. [8]. Drexler, J.A., and Larson, E.W. (2000). “Partnering: why project owner-contractor relationships changes.” J. of construction Engg. & Mgmt.., 126(4), 293-297. [9]. DRBF website, www.drbf.org [10]. FIDIC, 1999. [11]. Glagola, C.R., and Sheedy, W.M. (2002). “Partnering on defense contracts.” J. of construction Engg. & Mgmt.., 128(2), 127-138. [12]. Gransberg, D.D., Dillon, W.D., Reynolds, L., and Boyd, J. (1999). “Quantitative analysis of partnered project performance.” J. of construction Engg. & Mgmt.., 125(3), 161-166. [13]. Haltenhoff, C.E. (1994). “Partnering on small construction projects.” J. of Construction Engg. & Mgmt.., 125(5), 346-347. [14]. Maturana, S., Alarcon, L.F., Gazmuri, P., Vrsalovic, M. (2007). “On-site subcontractor evaluation methods based on lean principles and partnering practices.” J. Mgmt. in Engg., 23(2), 67–74. [15]. Minchin, R.E., and Smith, G.R. (2000). “Quality-based contractor rating model for qualification and bidding purposes.” J. Mgmt. in Engg., 21(1), 38–43. [16]. Ministry of Statistics & Program Implementation (MOS&PI) Annual report (2007). [17]. Naoum, S.G. (1994). “Critical analysis of time and cost of management and traditional contracts.” J. Mgmt. in Engg., 120(4), 687–705. [18]. “Permanent water supply scheme for Vinchur – Vinchur industrial area.” Contract Doc. (2002). Maharashtra Industrial Development Corporation. [19]. “R.R water supply scheme for OzarSakora& two villages.” Contract Doc. (1998).Maharashtra JeevanPradhikaran. [20]. Sheedy, W.M. (1997). “Partnering in the public sector.” A report for degree of master of Engg., University of Florida. [21]. Sundaram, K.T. (2001). “Pre-Qualification of applicants – criteria for evaluation.” J. CE & CR., Contracts & Mgmt., Oct, 29-38. [22]. Wong, P.P., Cheung, S.O., and Ho, K.M. (2005). “Contractor as trust initiator in construction partnering – Prisoner‟s Dilemma perspective.” J. of Construction Engg. & Mgmt.., 131(10), 1045-1053.