1 iclei eco mobility 2015 - cornie huizenga slides - draft - 2015-10-07
•Transferir como PPTX, PDF•
0 gostou•331 visualizações

Technical paper 1

Recomendados
Recomendados
Mais conteúdo relacionado
Mais procurados
Mais procurados (20)
Destaque
Destaque (10)
Semelhante a 1 iclei eco mobility 2015 - cornie huizenga slides - draft - 2015-10-07
Semelhante a 1 iclei eco mobility 2015 - cornie huizenga slides - draft - 2015-10-07 (20)
Mais de ICLEI
Mais de ICLEI (20)
Último
Último (20)
1 iclei eco mobility 2015 - cornie huizenga slides - draft - 2015-10-07
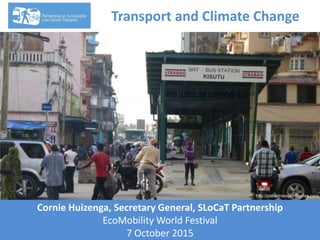
- 1. http://publictransportdiaries.com Cornie Huizenga, Secretary General, SLoCaT Partnership EcoMobility World Festival 7 October 2015 Transport and Climate Change
- 2. Mission: Integrate Sustainable Transport in Global Policies on Sustainable Development and Climate Change SLoCaT Partnership 90+ Members: International Organizations – Government – Development Banks – NGOs – Private Sector - Academe SLoCaT Foundation: Established in 2014 with sole objective to support the functioning of the SLoCaT Partnership Diamond Supporters Platinum Supporters Gold Supporters
- 3. Conclusions and Recommendations United Nations Framework Convention on Climate Change Source: UNFCCC 2014 UNFCCC Secretariat NAMA Registry Ad hoc Working Group on the Durban Platform for Enhanced Actions (ADP) Technology Mechanisms Financial Mechanisms Subsidiary Body for Scientific and Technological Advice (SBSTA) Subsidiary Body for Implementation (SBI) Convention Bodies Intergovernmental Panel for Climate Change (IPCC) Conference of the Parties (COP) Conference of the Parties serving as the meeting of the Parties to the Kyoto Protocol (CMP) United Nations Framework Convention for Climate Change (UNFCCC)
- 4. 0 10 20 30 40 50 60 2015 2020 2025 2030 2035 2040 2045 2050 BillionTonsofCO2Billions Power Other transformation Industry Transport Residential Commercial Agriculture Source: International Energy Agency (2014), Tracking Clean Energy Progress 2014, OECD/IEA, Paris Transport sector CO2 emissions projected to increase by about 60% from 2015 to 2050 Transport Emissions Trends (6DS Scenario)
- 5. -100% -90% -80% -70% -60% -50% -40% -30% -20% -10% 0% Agriculture Commercial Residential Transport Industry Power 2DSCO2Growthbetween2015to2050 2015-2050 Growth 2DS Transport must reduce emissions by 40% of 2015 levels by 2050 for 2DS however, non-OECD countries have just begun to motorize Source: IEA WEO 2012 2DS Growth in Different Sectors 2015-2050
- 6. Conclusions and RecommendationsGlobal High Shift Scenario 0 100 200 300 400 500 600 700 800 Total Private Public + NMT Total Private Public + NMT Passenger Kilometer Travel CO2 Transport Costs Growth(with2010as100) 2010 2050 - BAU 2050- High Avoid & Shift • $100 trillion savings in public/private infrastructure • 1,700 megaton reduction of annual carbon dioxide (CO2) = 40% reduction of urban passenger transport emissions Source: ITDP/UC Davis 2014
- 7. Conclusions and RecommendationsUrban Mobility Policy Scenarios 2050 ITF Transport Outlook 2015 • 38% of global growth in surface transport passenger emissions will come from cities in these regions in 2050 under a BAU scenario
- 8. Conclusions and RecommendationsCOP20 Lima Transport Scorecard Source: SLoCaT-BtG 2015 • Six negotiation streams tracked at COP20 Lima • INDCs have made significant progress • Adaptation has also made strides • Other areas show no substantive progress
- 10. Conclusions and RecommendationsINDC Pledges Source: Carbon Brief 2015 INDC pledges submitted as of October 1, 2015 cover nearly 90% of global emissions
- 11. Conclusions and RecommendationsTransport in INDCs by Region Source: SLoCaT Partnership 2015, http://www.slocat.net/docs/1503 Region % of submissions in region Transport Sector Mentioned Specified Transport Target Transport Mitigation Quantified Specified Transport Measures Urban Transport Measures Africa 36% 88% 36% 50% 69% 48% US & Canada 4% 100% 0% 0% 100% 0% Europe & Central Asia 27% 100% 0% 0% 25% 67% Latin America/Caribbean 11% 100% 40% 20% 60% 33% Asia-Pacific/Middle East 22% 100% 20% 20% 80% 26%
- 12. Conclusions and RecommendationsTransport Modes in INDCs Source: SLoCaT Partnership 2015 16% 29% 16% 13% 4% 0% 5% 10% 15% 20% 25% 30% 35% %shareinINDc's
- 13. Conclusions and RecommendationsTransport Strategies in INDCs Source: SLoCaT Partnership 2015 35% 41% 5% 8% 24% 8% 3% 3% 0% 5% 10% 15% 20% 25% 30% 35% 40% 45% ShareofINDC
- 14. Conclusions and RecommendationsTransport Measures in INDCs Source: SLoCaT Partnership 2015 Country Proposed Urban Transport Sector Measures Benin Improve traffic flow in urban crossings of large cities; develop a river-lagoon transport system with navigable rivers; modernize and extend rail infrastructure; develop urban transport. China Increase mode share of public transport in in large- and medium-sized cities to 30% by 2020; promote urban pedestrian and bicycle infrastructure; accelerate green freight development. Gabon Increase infrastructure investments, public transport services (e.g. congestion reduction in Libreville), restrict importation of vehicles that are more than 3 years old. Japan Promote modal shift to public transport and railways; develop traffic safety facilities and improve traffic flow through ITS; promote driverless cars, eco-driving and car sharing. Jordan Increase public transport mode share to 25% by 2025; reduce vehicle fuel emissions and vehicle travel, particularly in densely populated areas. Macedonia Increase electrification of transport, increase use of railways, renew vehicle fleets increase use of bicycles and walking; introduce parking policies Republic of Korea Continue to expand infrastructure for environment friendly public transport; introduce low- carbon standards for fuel efficiency; provide incentives for electric and hybrid vehicles.
- 15. Conclusions and RecommendationsTransport Targets in INDCs Source: SLoCaT Partnership 2015 • D.R. Congo: 10Mt CO2eq reduction by urban transport improvements • Trinidad and Tobago: 30% reduction in GHG emissions by 2030 in public transport sector vs. BAU • Bangladesh: Achieve shift of up to 20% in urban passenger travel from road to rail by 2030 vs. BAU • China: Promote share of public transport in large and medium-sized cities, targeting 30% by 2020 • Israel: 20% shift from private to public transportation
- 16. Conclusions and Recommendations LPAA Transport Commitments Relevant to Cities Source: http://ppmc-cop21.org/lpaatransportinitiatives/ C40 Clean Bus Declaration C40 Cities Climate Leadership Group MobiliseYourCity: Sustainable Urban Mobility Plans CODATU Declaration on Climate Leadership UITP Urban Electric Mobility Initiative UN-Habitat Vehicle Fuel Efficiency Accelerator GFEI Modal Shift to Cycling Worldwide WCA/ECF ITS for the Climate ATEC_ITS France Global Green Freight Action Plan Green Freight Steering Group International ZEV Alliance Cal EPA
- 17. Conclusions and RecommendationsCity-Focused Transport Initiatives Source: http://ppmc-cop21.org/city-commitments-on-transport-and-climate-change/ • Civitas has helped 60 demonstration cities implement innovative measures to develop greener transport • Covenant of Mayors signatories aim to meet and exceed the EU 20% CO2 reduction objective by 2020 • Sustainable Urban Mobility Campaign boosts mobility campaigners in EU, Norway, Iceland and Liechtenstein • European Mobility Week encourages cities to invite local residents to try alternative forms of transport • Compact of Mayors encourages increased capital flows to cities to support local action reducing GHG emissions
- 18. Conclusions and Recommendations • COP21 outcomes should focus on technology transfer, financing policies, and strategies to support urban transport • INDCs should give additional attention to urban transport through projects and policies to optimize mitigation potential • LPAA activities should be leveraged to scale up • Global transport and climate change community should leverage SDGs/targets • The transport community should capitalize on Habitat III Recommendations
- 19. Global Agreement on Climate Change that empowers transport sector to take action on climate change Inclusive platform on mobility and climate created by SLoCaT Partnership and Michelin Challenge Bibendum Common Messages on Mobility and Climate Knowledge Products National, Regional and Thematic Dialogues Events at COP21 PPMC Components: www.ppmc-cop21.org
Notas do Editor
- Image:Biogas bus in the city of Linkoping, Sweden (public domain) https://en.wikipedia.org/wiki/Biogas#/media/File:BioGasBus.png
- IEA estimates transport sector to provide second highest intensity of reduction in 2DS scenario.
- Baseline is 2010, but all bars show alternate scenarios in 2050 (baseline mode split not shown)
- As of September 24, 2015, a total of 45 INDC submissions representing 72 countries had been submitted to the UNFCCC. These countries represent nearly 65% of global GHG emissions and nearly 60% of global transport GHG emissions.
- As of September 24, 2015, a total of 45 INDC submissions representing 72 countries had been submitted to the UNFCCC. These countries represent nearly 65% of global GHG emissions and nearly 60% of global transport GHG emissions.
- As of September 24, 2015, a total of 45 INDC submissions representing 72 countries had been submitted to the UNFCCC. These countries represent nearly 65% of global GHG emissions and nearly 60% of global transport GHG emissions.