SlideShare a Scribd company logo
1 of 2
Download to read offline
Korea
E-commerce projected to grow 20% in 2011                             General statistics 2011
Korea’s B2B e-commerce market is maturing with still impressive      Population                  48,754,000
growth figures of 20%. Both the average money spent (and the         Currency              Korean Won (KRW)
percentage of people shopping online is growing currently at 64.5%   Major language                  Korean
of the population.
                                                                     Capital                          Seoul


Fast Facts:                                                          Internet usage 2011
   B2C E-commerce turnover 2010: 14,700 Billion Won                  Users (total)                39,350,000
   Credit cards by far most popular payment method and growing       Users broadband                    91%
   Average time spent online: 14.7 hours per week
                                                                     Penetration                        80%
   13.3% used mobile devices for online purchases
                                                                     Mobile subscribers           47,938,000
   Clothes/fashion and travel most popular industries
                                                                     % Users in Asia                  10.4%
   Large part of internet access is via cybercafes
                                                                     GDP per capita             US$: 30,000

Break-down online consumers                                  Mode of Payment


B2C e-commerce by industry                                   Monthly online spent
Success E-banking
E-banking was introduced to South Korea in 1999. By the start of 2003, about a third of the country’s
population used internet banking, second only to Sweden. People in their 30s made up the highest ercentage
of internet banking customers, with 38.9%, followed by those in their 20s with 31.6% and those in their 40s with
19.4%. Males represented a slight majority of internet banking customers at 54.7%.

According to the NIDA 2008 internet survey, 40% of all internet users over 12 years old were using
internet banking services. By age, those in the 20s and 30s bracket show relatively higher rates with
57.2% and 56.3% respectively. The monthly average for internet banking was 4.8 times per month.
By 2010, 42.3% of internet users aged 12 and above had used internet banking in the past year. In the
last month it had been used by 31.6% and 11.6% in the last week.

By age, those in the 20s and 30s bracket show relatively higher rates with 61.1% and 59.4% respectively. The
monthly average for internet banking was 4.9 times per month. Most internet banking users, 96.2% used a
computer while 9.2% used a mobile phone. The success of LG Telecom’s mobile phone banking (m-banking)
service named Bank On, led to LG Telecom partnerships with other banks and spurred the other mobile
operators to engage more in m-banking.


Payment preferences
Through credit card is the preferred payment, followed by real-time bank transfer the usage of mobile devices
to make online purchases shows strong growth.


Local entity requirement
In order to accept local payment methods a local entity is required.


Payment product spotlight

 GlobalCollect’s Portfolio in Korea

 International cards              GlobalCollect supports MasterCard, Visa

 Bank transfer                    GlobalCollect supports Local bank transfers

 eWallet                          GlobalCollect supports PayPal

 Local Cards                      Local cards support is being developed by GlobalCollect

 Real-time bank transfer          Realt-ime bank transfer is being developed by GlobalCollect the future’s list of GlobalCollect

 Mobile                           The support for mobile is on the future’s list of GlobalCollect


Sources
  KCC Data ||March 2011
 Comscore || 2011
 Buddecom || 2011
 http://www.kostat.go.kr/ || November 2011
 Internet WorldStats || September 2011
 NIDA Survey || 2008


                                                                                                                                   V3.0

More Related Content

More from Ingenico ePayments

Infographic: The Taiwan Games Market
Infographic: The Taiwan Games MarketInfographic: The Taiwan Games Market
Infographic: The Taiwan Games MarketIngenico ePayments
 
Infographic: The Polish Games Market
Infographic: The Polish Games MarketInfographic: The Polish Games Market
Infographic: The Polish Games MarketIngenico ePayments
 
Infographic: The Italian Games Market
Infographic: The Italian Games MarketInfographic: The Italian Games Market
Infographic: The Italian Games MarketIngenico ePayments
 
Infographic: The German Games Market
Infographic: The German Games MarketInfographic: The German Games Market
Infographic: The German Games MarketIngenico ePayments
 
Infographic: The French Games Market
Infographic: The French Games MarketInfographic: The French Games Market
Infographic: The French Games MarketIngenico ePayments
 
Infographic: The Belgian Games Market
Infographic: The Belgian Games MarketInfographic: The Belgian Games Market
Infographic: The Belgian Games MarketIngenico ePayments
 
Infographic: The Dutch Games Market
Infographic: The Dutch Games MarketInfographic: The Dutch Games Market
Infographic: The Dutch Games MarketIngenico ePayments
 
Infographic: The US Games Market
Infographic: The US Games MarketInfographic: The US Games Market
Infographic: The US Games MarketIngenico ePayments
 
Infographic: The Spanish Games Market
Infographic: The Spanish Games MarketInfographic: The Spanish Games Market
Infographic: The Spanish Games MarketIngenico ePayments
 
Infographic: The Russian Games Market
Infographic: The Russian Games MarketInfographic: The Russian Games Market
Infographic: The Russian Games MarketIngenico ePayments
 
Infographic : The Australian Games Market
Infographic : The Australian Games MarketInfographic : The Australian Games Market
Infographic : The Australian Games MarketIngenico ePayments
 
Infographic: The Canadian Games Market
Infographic: The Canadian Games MarketInfographic: The Canadian Games Market
Infographic: The Canadian Games MarketIngenico ePayments
 
Infographic: The Brazilian Games Market
Infographic: The Brazilian Games MarketInfographic: The Brazilian Games Market
Infographic: The Brazilian Games MarketIngenico ePayments
 
Infographic: The Turkish Games Market
Infographic: The Turkish Games MarketInfographic: The Turkish Games Market
Infographic: The Turkish Games MarketIngenico ePayments
 
Infographic: The Chinese Games Market
Infographic: The Chinese Games MarketInfographic: The Chinese Games Market
Infographic: The Chinese Games MarketIngenico ePayments
 
Infographic: The UK Games Market
Infographic: The UK Games MarketInfographic: The UK Games Market
Infographic: The UK Games MarketIngenico ePayments
 
Globalcollect Argentina Country Factsheet
Globalcollect Argentina Country FactsheetGlobalcollect Argentina Country Factsheet
Globalcollect Argentina Country FactsheetIngenico ePayments
 
GlobalCollect winning payment strategies for BRIC countries part1
GlobalCollect winning payment strategies for BRIC countries part1GlobalCollect winning payment strategies for BRIC countries part1
GlobalCollect winning payment strategies for BRIC countries part1Ingenico ePayments
 

More from Ingenico ePayments (19)

eCommerce Latin America
eCommerce Latin AmericaeCommerce Latin America
eCommerce Latin America
 
Infographic: The Taiwan Games Market
Infographic: The Taiwan Games MarketInfographic: The Taiwan Games Market
Infographic: The Taiwan Games Market
 
Infographic: The Polish Games Market
Infographic: The Polish Games MarketInfographic: The Polish Games Market
Infographic: The Polish Games Market
 
Infographic: The Italian Games Market
Infographic: The Italian Games MarketInfographic: The Italian Games Market
Infographic: The Italian Games Market
 
Infographic: The German Games Market
Infographic: The German Games MarketInfographic: The German Games Market
Infographic: The German Games Market
 
Infographic: The French Games Market
Infographic: The French Games MarketInfographic: The French Games Market
Infographic: The French Games Market
 
Infographic: The Belgian Games Market
Infographic: The Belgian Games MarketInfographic: The Belgian Games Market
Infographic: The Belgian Games Market
 
Infographic: The Dutch Games Market
Infographic: The Dutch Games MarketInfographic: The Dutch Games Market
Infographic: The Dutch Games Market
 
Infographic: The US Games Market
Infographic: The US Games MarketInfographic: The US Games Market
Infographic: The US Games Market
 
Infographic: The Spanish Games Market
Infographic: The Spanish Games MarketInfographic: The Spanish Games Market
Infographic: The Spanish Games Market
 
Infographic: The Russian Games Market
Infographic: The Russian Games MarketInfographic: The Russian Games Market
Infographic: The Russian Games Market
 
Infographic : The Australian Games Market
Infographic : The Australian Games MarketInfographic : The Australian Games Market
Infographic : The Australian Games Market
 
Infographic: The Canadian Games Market
Infographic: The Canadian Games MarketInfographic: The Canadian Games Market
Infographic: The Canadian Games Market
 
Infographic: The Brazilian Games Market
Infographic: The Brazilian Games MarketInfographic: The Brazilian Games Market
Infographic: The Brazilian Games Market
 
Infographic: The Turkish Games Market
Infographic: The Turkish Games MarketInfographic: The Turkish Games Market
Infographic: The Turkish Games Market
 
Infographic: The Chinese Games Market
Infographic: The Chinese Games MarketInfographic: The Chinese Games Market
Infographic: The Chinese Games Market
 
Infographic: The UK Games Market
Infographic: The UK Games MarketInfographic: The UK Games Market
Infographic: The UK Games Market
 
Globalcollect Argentina Country Factsheet
Globalcollect Argentina Country FactsheetGlobalcollect Argentina Country Factsheet
Globalcollect Argentina Country Factsheet
 
GlobalCollect winning payment strategies for BRIC countries part1
GlobalCollect winning payment strategies for BRIC countries part1GlobalCollect winning payment strategies for BRIC countries part1
GlobalCollect winning payment strategies for BRIC countries part1
 

Globalcollect Korea Country Factsheet

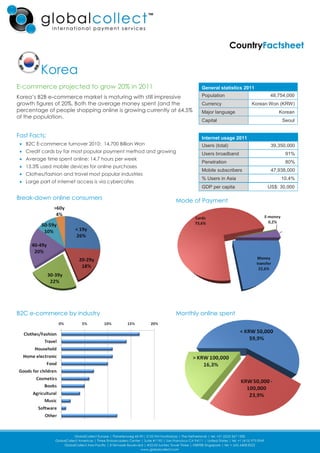
  • 1. Korea E-commerce projected to grow 20% in 2011 General statistics 2011 Korea’s B2B e-commerce market is maturing with still impressive Population 48,754,000 growth figures of 20%. Both the average money spent (and the Currency Korean Won (KRW) percentage of people shopping online is growing currently at 64.5% Major language Korean of the population. Capital Seoul Fast Facts: Internet usage 2011 B2C E-commerce turnover 2010: 14,700 Billion Won Users (total) 39,350,000 Credit cards by far most popular payment method and growing Users broadband 91% Average time spent online: 14.7 hours per week Penetration 80% 13.3% used mobile devices for online purchases Mobile subscribers 47,938,000 Clothes/fashion and travel most popular industries % Users in Asia 10.4% Large part of internet access is via cybercafes GDP per capita US$: 30,000 Break-down online consumers Mode of Payment B2C e-commerce by industry Monthly online spent
  • 2. Success E-banking E-banking was introduced to South Korea in 1999. By the start of 2003, about a third of the country’s population used internet banking, second only to Sweden. People in their 30s made up the highest ercentage of internet banking customers, with 38.9%, followed by those in their 20s with 31.6% and those in their 40s with 19.4%. Males represented a slight majority of internet banking customers at 54.7%. According to the NIDA 2008 internet survey, 40% of all internet users over 12 years old were using internet banking services. By age, those in the 20s and 30s bracket show relatively higher rates with 57.2% and 56.3% respectively. The monthly average for internet banking was 4.8 times per month. By 2010, 42.3% of internet users aged 12 and above had used internet banking in the past year. In the last month it had been used by 31.6% and 11.6% in the last week. By age, those in the 20s and 30s bracket show relatively higher rates with 61.1% and 59.4% respectively. The monthly average for internet banking was 4.9 times per month. Most internet banking users, 96.2% used a computer while 9.2% used a mobile phone. The success of LG Telecom’s mobile phone banking (m-banking) service named Bank On, led to LG Telecom partnerships with other banks and spurred the other mobile operators to engage more in m-banking. Payment preferences Through credit card is the preferred payment, followed by real-time bank transfer the usage of mobile devices to make online purchases shows strong growth. Local entity requirement In order to accept local payment methods a local entity is required. Payment product spotlight GlobalCollect’s Portfolio in Korea International cards GlobalCollect supports MasterCard, Visa Bank transfer GlobalCollect supports Local bank transfers eWallet GlobalCollect supports PayPal Local Cards Local cards support is being developed by GlobalCollect Real-time bank transfer Realt-ime bank transfer is being developed by GlobalCollect the future’s list of GlobalCollect Mobile The support for mobile is on the future’s list of GlobalCollect Sources KCC Data ||March 2011 Comscore || 2011 Buddecom || 2011 http://www.kostat.go.kr/ || November 2011 Internet WorldStats || September 2011 NIDA Survey || 2008 V3.0