1. Epstein 1
REVIEW: ELECTRICAL COMPONENT RESEARCH AND BEAMLINE
PREPARATION AT ISOLTRAP
George F. Epstein
Cornell University, Ithaca, NY 14853
Université de Genève, 1205 Genève, Suisse
Submitted: 30 June 2014
Abstract The following article details my four months of work at the ISOLTRAP facility
at CERN during the ISOLDE facility’s off-line upgrade time. Joining the ISOLTRAP
team as a new recruit, I took on several side projects in preparation for new beams and
new data acquisition. Over the course of this internship, I learned about vacuum systems,
hardware-software interfaces, and working with electrical components. The tasks
accomplished contribute not only to my knowledge, but also to the restart of ISOLTRAP
at the end of the summer, and to the knowledge of the future ISOLTRAP team when
further upgrades must be made.
I. Introduction
The Isotope Separator On-Line
Device (ISOLDE) facility, at the
European Organization for Nuclear
Research (CERN) in Meyrin,
Switzerland, was taken off-line in
December 2012 for technical
developments and maintenance. At the
time of publication, the anticipated beam
restart and renewed data collection in
ISOLDE was scheduled for July 2014
ISOLTRAP, the tandem Penning trap
mass spectrometer at ISOLDE, is one of
the experimental setups within the
facility that was affected by this shut
down. A pioneer in the field of Penning
trap nuclear mass measurements, the
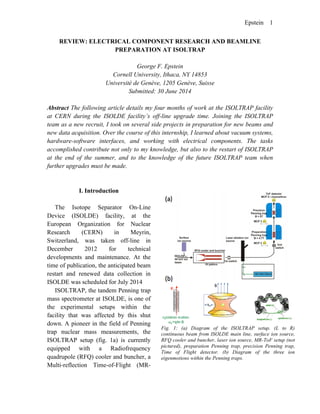
ISOLTRAP setup (fig. 1a) is currently
equipped with a Radiofrequency
quadrupole (RFQ) cooler and buncher, a
Multi-reflection Time-of-Flight (MR-
Fig. 1: (a) Diagram of the ISOLTRAP setup. (L to R)
continuous beam from ISOLDE main line, surface ion source,
RFQ cooler and buncher, laser ion source, MR-ToF setup (not
pictured), preparation Penning trap, precision Penning trap,
Time of Flight detector. (b) Diagram of the three ion
eigenmotions within the Penning traps.
2. Epstein 2
ToF) mass separator, and two Penning
traps (preparation and precision). During
beam-time, these devices have measured
masses of more than 400 short-lived,
exotic nuclides with a relative
uncertainty 𝛿𝑚 𝑚 ~5×10–!
with some
special cases improving that ratio by up
to an order of magnitude. These
measurements are important for greater
understanding of nuclear structure and
deformation, nuclide pairing, standard
model predictions, and astrophysical
nucleosynthesis.
At the time of publication, the
scheduled date for ISOLTRAP to
receive new beams was 1 August 2014.
In the year-and-a-half bridging the dates
of shutdown and restart, the ISOLTRAP
team disassembled many of the parts of
the experiment, tested the performance
of each section of the vacuum chamber,
rebuilt the system of beam optics with
new components, replaced dysfunctional
electrical constituents, improved the
computer systems controlling the
dynamic parts, gauges, and sensors, and
realigned and reassembled all of the
sections of the setup to a functional
condition.
Between March and June 2014, I
joined the ISOLTRAP team and helped
with these hardware upgrades. It is these
projects that will be discussed in detail
in the sections below. They include
wiring plugs for valve actuators, aiding
in the assembly and testing of the
vacuum chambers, characterizing the
dynamic conduction system for the laser
ion source electrodes, and characterizing
the pattern of leakage resistance in
capacitors to be implemented into the
RFQ cooling and bunching system.
II. Project Descriptions
A. Valve Actuator Plugs
As a newly arrived bachelors student
who would be working closely with
high-voltage electronics meant for
precision nuclear mass measurements,
it’s understandable that my first few
days of work in March were an
introduction to hands-on work, and an
effective test of whether or not I could
be trusted.
Thus, the first task I completed at
ISOLTRAP was to solder wires to the
pin connections of a seven pin plastic
plug (fig. 2). The pins would be placed
under potential differences of several
kilovolts, so it was crucial to have strong
electrical contact at the soldered points
and no short circuit contact between
wires. Once completed, the cable was
successfully tested in conjunction with
the pneumatic valve and the binary
switch actuation.
B. Vacuum Testing
Due to the need for pure ion samples
when performing measurements within
the upper precision Penning trap, the
beam-line and optics of ISOLTRAP are
all placed under high vacuum when
operational. This allows unobstructed
ion eigenmotions within the Penning
trap (fig. 1b) and a reduction of noise in
the time-of-flight measurements. Part of
the instrumental maintenance work at
ISOLTRAP during shutdown is ensuring
3. Epstein 3
that all of the chambers—as well as all
of the connections between sections of
the setup—will not leak under high
vacuum.
To test the individual sections
requires cleaning the interior of the steel
chamber, the cutting edges, and the O-
rings with Isopropanol, followed by
bolting vacuum flanges around the
openings of the chambers. Once the
chamber is sealed tightly, pre-vacuum is
applied through a tube to bring the
pressure in the chamber down to ~10–!
millibarr. An example of this setup is
shown in Figure 3a. The joints (flange
and connection points) of the system are
then sprayed either with Helium or
Isopropanol. If there are leaks while the
system is under vacuum, the sprayed
fluid will be taken in through the leak
causing a significant rise in pressure.
Once a section successfully holds
pre-vacuum, it is affixed to the other
parts of ISOLTRAP for the high vacuum
test. The procedure for this test is
essentially the same as the pre-vacuum
test, except that the chamber is
connected to the rest of the experiment,
and the pump-down requires a longer
operation time. Figure 3b shows this test.
In the case of vacuum failure (as was
the case for the component shown in
figure 3), the next step is to identify the
point of failure. The method used is the
bubble test: Place the interior of the
chamber above atmospheric pressure,
spray the joints with an aerosol, and
watch for the presence of bubbles
indicating the leakage point. This
particular leaking chamber was sent to
Fig. 2: Pin wiring for valve actuator plug.
Fig. 3: (a) Optics chamber between the lower
preparation and upper precision Penning traps.
(b) Leak test of the upper part of the chamber
shown in (3a).
4. Epstein 4
technicians at CERN for repairs
following the identification of the leak.
C. Laser Ion Source
The ISOLTRAP Laser Ion Source is
used to provide Carbon ions for
reference in mass measurements; since
the unified atomic mass unit is defined
as one-twelfth of the mass of a neutral,
unbounded Carbon-12 atom, the singly
charged Carbon ions provide an
acceptable approximation for mass
comparison.
This particular source chamber (fig.
4a) is installed after the RFQ Cooler and
Buncher and injects Carbon ion clusters
up to the Penning traps. Over the last
several years, the formation chamber has
undergone several iterations. The present
model uses an aluminum plate rotating
5mm off the central axis of the chamber.
This plate contains the Carbon source
and is electrically contacted to the base
electrode by a ring of ball bearings. The
lower electrode is held at ~3kV and the
resulting potential is used to inject the
newly created ions into the beam path.
In order to ensure good injection
capabilities, it becomes necessary to
create good electrical contact between
the aluminum plate and the lower
electrode. Doing this is rendered more
difficult by the rotation of the plate,
which is a necessary action to make sure
that the pulsed laser does not repeatedly
strike the same spot on the Carbon
sample, thus depleting the sample in an
uneven fashion.
The test I performed to investigate
this electrical contact used the Keithley
Model 2000 Digital Multimeter, and
LabVIEW Version 9. The multimeter
(used here on the ohmmeter setting) was
connected to the lower electrode while
the chamber casing (fig. 4b)—in
electrical contact with the aluminum
plate—was connected to ground. With
the motor turning the aluminum plate,
the LabVIEW Virtual Instrument (VI)
read resistance measurements off of the
multimeter each second and plotted
Fig. 4: (a) Schematic of the axial cross section of the laser ion source. (b) Photograph of the laser ion source with indications of the
major features. (c) LabVIEW front panel of a representative resistance data sampling. The average resistance increases with
increasing rotational frequency. The slight decrease ~430 seconds into sampling is due to a direction change in the motor. The
dramatic resistance increase and instability is due to the unstable direction of the motor.
5. Epstein 5
those measurements on a waveform
chart (fig. 4c). Higher average resistance
indicates lower electrical contact and
vice versa. Too much electrical contact
forces the motor to overwork and
decreases performance. Following each
of these acquisition sessions, position
adjustments were made to the plate to
optimize the ratio of resistance to
friction.
After many tests and adjustments of
this system, it became clear that the
mechanism that was simultaneously
holding the plate and insulating it from
the motor arm was unstable, making the
system performance extremely subject to
initial conditions. At the time of
publication, new methods are being
investigated to provide a stronger
connection between the two system
components and a summer graduate
student is investigating more stable
configurations that allow for a good
amount of pressure and translational
freedom while maintaining good
electrical contact.
D. Capacitor Leakage Resistance: The
Multi-Reflection Time-of-Flight Mass
Separator
i. Setup and Initial Testing
One of the new installments to the
ISOLTRAP facility is the Multi-
Reflection Time-of-Flight (MR-ToF)
Mass Separator between the
Radiofrequency Quadrupole Buncher
and the dual Penning Traps. The MR-
ToF uses two electrostatic ion optical
mirrors—whose potentials are adjusted
to allow controlled oscillations of the
ions of interest—and a Bradbury-
Neilson beam gate to filter out unwanted
ions. Such action allows for greater
purification of ion beams than was
previously allowed by the ISOLTRAP
setup.
The high voltage, high precision
power sources used at ISOLTRAP are
(despite their production standards)
subject to noise and thermal fluctuations;
as much as touching the doorknob of the
laser room in which the MR-ToF is
housed is enough to cause unwanted
voltage changes on the electrode mirrors
which decreases the separation precision
of the MR-ToF. To counteract this result
high voltage (40µF, 4100V) capacitors
are installed serially to reduce
fluctuations to zero. These capacitors
(products of General Electric) are
ceramic plates encased in an aluminum
housing with solid ceramic terminals.
It is important that these capacitors
function as closely to ideal performance
as possible. Therefore, a key
characteristic of the non-ideal capacitor,
the leakage resistance, must be
determined, and only capacitors with
leakage resistances above a certain value
(i.e. several gigaohms) can be accepted.
This leakage resistance should thus be
known to within an order of magnitude
to estimate its efficacy in noise
reduction. To achieve this end, the
following procedure was established to
determine the leakage resistance—the
nature of the methodology is similar to
that for determining the optimized
configuration of the Laser Ion Source.
6. Epstein 6
The setup is outlined in Figure 5a and
shown in Figure 5b. A DC voltage
supply is connected to an RC series
circuit, and the current through the
circuit is read through another LabVIEW
VI (fig. 6) through the Keithley 6485
Picoammeter. The real capacitor with
leakage resistance is modeled as an ideal
capacitor in parallel with an ideal
resistor. The series resistance is chosen
based upon the capacitor to achieve a
good compromise between the
approximate time constant 1
and the
circuit stability—too high of a resistance
will cause a very slow current decay and
will make the final current low enough
to be greatly distorted by background
noise, while too low of a resistance can
cause a current overload in particular at
the high voltage range.
When the voltage supply is set to
constant voltage, 𝑉, the capacitor is
1
The time constant of the ideal RC circuit is
simply the product of the resistance (in ohms)
and capacitance (in farads). Since this circuit
does not have a current decay to exactly zero, but
to a small, non-zero value, the decay time is not
quite this value, though it remains a good
estimate, as evidenced by the experimental
results obtained.
initially discharged and acts as a short
circuit to ground. The initial current is
thus:
𝒊𝒊𝒏𝒊𝒕𝒊𝒂𝒍 =
𝑽
𝑹 𝒔𝒆𝒓𝒊𝒆𝒔
The capacitor then charges over time
towards its final voltage. When this
happens, current only passes through the
series resistor and the leakage resistance
which makes the final current:
𝒊 𝟎 =
𝑽
𝑹 𝒔𝒆𝒓𝒊𝒆𝒔 + 𝑹𝒍𝒆𝒂𝒌𝒂𝒈𝒆
It is this value that is of particular
interest, because by rearranging this
relationship, we arrive at an expression
for 𝑅!"#$#%" based solely on controlled
parameters (applied voltage and 𝑅!"#$"%)
and experimentally-determined results:
𝑹𝒍𝒆𝒂𝒌𝒂𝒈𝒆 =
𝑽
𝒊 𝟎
− 𝑹 𝒔𝒆𝒓𝒊𝒆𝒔
To obtain an asymptotic value of the
circuit’s current, the data sets were
imported into Oracle 7 and fit with a
Fig. 5: (a) Circuit diagram of the experimental setup. The real capacitor is shown as the parallel branch of an
ideal capacitor, C, and the Leakage Resistance. (b) Photo of the experimental setup with a 1000µF electrolytic
capacitor
7. Epstein 7
function comprised of the sum of three
exponential decays and a constant of the
form:
𝒊 𝒕 = 𝒊 𝟎 + 𝑨𝒋 𝒆
!(𝒕!𝒕 𝟎)
𝒕 𝒋𝟑
𝒋!𝟏
Though there does not appear to be an
easily determined physical explanation
for the fit equation’s form, this particular
form was used because it provided the
highest 𝑅!
value (in most cases, unity),
which suggests the most accurate
extrapolated value of 𝑖! , the major
quantity of interest.
To verify that this method works and
that the setup can be safely extended to
high voltage experimentation, a number
of tests on small, low voltage capacitors
(ceramic and electrolytic) were
performed. Figure 7 displays a sample
curve from one of these capacitors.
Based on the asymptotic fit values, data
was gained with regards to the capacitor
leakage resistance (tab. 1). It should be
noted that, while the presented data is
not sufficient enough to draw definitive
conclusions, there seems to be a negative
correlation between capacitance and
associated leakage resistance, enough to
motivate a further investigation into the
study.
Table 1: Leakage Resistance of Sample
Capacitors (V=20.0V)
Capacitance
(C)
(µF)
Final
Current (i0)
(nA)
Leakage
Resistance
(RL) (MΩ)
47 269 73
470 319 62
1000 1324 15
Fig. 6: LabVIEW Virtual Instrument for measuring the current of the charging RC circuit. Output
waveforms of the VI are graphs of the entire decay curve and of the most recent 100 measurements. The
second waveform gives a more perceivable measure of when the current has approached its final constant
value.
8. Epstein 8
ii. The Semi-High and High Voltage
Regime
After completing the low voltage
tests and streamlining the experimental
process, attention turned to the high
voltage capacitors. A photograph of this
modified setup—with high voltage
source and the grounded capacitor
cage—is shown in Figure 8. The same
approach was used for these high voltage
capacitors as for the test capacitors. Six
capacitors were tested at voltages
ranging from 0.100kV to 2.800kV.
0.100-1.500kV constitutes the “semi-
high” regime (trials conducted with the
circuit unshielded) while 0.100kV-
2.800kV constitutes the “high” voltage
regime (trials conducted with a shielded
circuit as shown in Figure 8). Data was
analyzed to produce plots of Leakage
Resistance (in GΩ) versus Applied
Voltage (in Volts). The main method for
achieving these plots involved
calculating the Leakage Resistance—as
described in the previous section—then
plotting these values against the voltage
applied from that trial. The plots
obtained from this method are shown in
Appendix A for all six capacitors. In
examining these results, it becomes clear
that there is a marked discrepancy
between the results from the shielded
and unshielded trials as shown for
Capacitors 1-3. The unshielded results
seem to have a much higher voltage-
dependent leakage resistance. To rule
out errors in the voltage source (two
different sources were used at various
times throughout the trials) the possible
combinations of voltage sources and
experimental configurations were
retested. After ruling out errors due to
the voltage sources through these tests,
the data analysis was examined. As an
alternative approach to the fit test, an
average of the final 100 data points from
each of the Capacitor 1 unshielded trials
was taken, and these average values
were used as the 𝑖! values for each trial.
Plugging these values into the equation
for 𝑅! yielded new results for the
Fig. 7: Sample decay curve for a test 470µF
electrolytic capacitor. Exponential decompositions
displayed and final, asymptotic current given here.
Fig. 8: High Voltage configuration for capacitor
testing. L to R: Voltage source (up to 2.800kV),
Keithley 6485 Ammeter, Capacitor shielding
cage.
9. Epstein 9
leakage resistances in the unshielded
configuration that were much more
faithful to those of the shielded
configuration. This plot can be found in
Appendix B.
Regardless of the method by which
the data is analyzed, the result is evident
in each capacitor: There exists a direct
correlation between the leakage
resistance of the capacitor and the
voltage applied across its terminals. This
resistance levels off (to ~2GΩ) as the
voltage approaches the patent maximum
voltage of the capacitor.
III. Closing Notes
A. Summary
In four months of working at the
ISOLDE facility, I gained hands-on
experience with electrical systems,
vacuum systems, data acquisition and
analysis. The main result of my work,
which adds to the scientific knowledge
base at ISOLTRAP, is the quantified
characteristic behavior of the six
capacitors that will be used for the MR-
ToF mass spectrometer. Since most
components used at CERN (such as the
large capacitors) are recycled
components, the methods used to test
these components are invaluable to
further upgrade procedures.
B. Still to Come
During the weeks following my
departure from ISOLDE, the
ISOLTRAP team continues to prepare
for the first beams and new data. This
includes the implementation of the
stabilization capacitors in the MR-ToF
power supply circuits as well as the
revision and reconstruction of the
rotating electrode support mechanism in
the Laser Ion Source.
C. Acknowledgements
I would like to thank the team at
ISOLTRAP: Frank Wienholtz, Vladimir
Manea, Dinko Atanasov, Dmitry Kisler,
Andree Welker, and Ian Murray. I would
like to acknowledge the ISOLDE
Scientific Coordinator, Magdalena
Kowalska, and the ISOLDE Physics
Coordinator, Maria Borge. Finally, I
would like to thank Augusto Ceccucci.
11. Epstein 11
Appendix B
0
10
20
30
40
50
60
0
200
400
600
800
1000
1200
LeakageResistance(G!)!
Applied Voltage (V)"
Unshielded Tests"
Two Forms of Data Analysis"
Asymptotic
Method
Average
Last
100
Measurements
Method