SlideShare a Scribd company logo
1 of 13
Download to read offline
Telecom Services: Data Center REITs
CyrusOne
Equity Research Earnings Update
www.cowen.com Please see addendum of this report for important disclosures.
February 19, 2015
Price: $30.16 (02/18/2015)
Price Target: $34.00 (Prior $32.00)
OUTPERFORM (1)
Solid 4Q14 Results; Substantial Dividend
Increase
Colby Synesael
646.562.1355
colby.synesael@cowen.com
Jonathan Charbonneau
646.562.1356
jonathan.charbonneau@cowen.com
Gregory Williams, CFA
646.562.1367
gregory.williams@cowen.com
Key Data
Symbol NYSE: CONE
52-Week Range: $31.02 - 19.52
Market Cap (MM): $1,968.0
Net Debt (MM): $636.7
Cash/Share: $6.77
Dil. Shares Out (MM): 38.7
Enterprise Value (MM): $2,604.7
ROIC: 4.2%
ROE (LTM): (1.7)%
BV/Share: $12.25
Dividend: $1.26
Yield: 4.18%
FY (Dec) 2014A 2015E 2016E
Funds From Operations
Q1 $0.42 $0.49 -
Prior Q1 - $0.46 -
Q2 $0.39 $0.49 -
Prior Q2 - - -
Q3 $0.44 $0.50 -
Prior Q3 - - -
Q4 $0.48 $0.53 -
Prior Q4 $0.42 $0.55 -
Year $1.73 $2.01 $2.39
Prior Year $1.67 $1.99
Revenue (MM)
Year $330.9 $376.7 $430.4
Prior Year $328.5 $386.3
EV/S 7.9x 6.9x 6.1x
The Cowen Insight
CONE reported solid 4Q14 results including rev/FFO slightly ahead of expectations
and provided useful color as to why it doesn’t expect any material impact from lower
oil prices. The company also increased its dividend by 50% which now implies a 4.2%
yield and was meaningfully ahead expectations and provided initial 2015 guidance
that while slightly below estimates we view as conservative.
Conclusion
CONE reported solid 4Q14 results including revenue/FFO that beat expectations
driven in part by higher installs than was expected. Mgmt. also provided an in-depth
overview as to why it doesn’t expect lower oil prices to have a material impact on
its business despite meaningful concerns from investors heading into the quarter.
To this point, its energy vertical has grown at a ~7% CAGR the past two years vs.
~30% CAGR across its other verticals which points to the decreasing reliance on the
energy vertical for growth. Notably, the company also increased its dividend by 50% to
$0.315/share which equates to an annual yield of 4.2% and was meaningfully ahead
of expectations driven by its decision to increase its AFFO payout ratio to be more
in-line with peers. We believe this also points to the company’s increasing focus on
FFO growth and profitability vs. simply top-line growth which to date has been the
primary focus. While 2015 revenue/FFO guidance was slightly below expectations, we
get the sense the company is simply trying to be conservative at this point in the year
and believe it is likely trending towards at least the mid-point given the solid trends
currently being witnessed. Reiterate Outperform.
Results
Rev was $86.9MM vs. our $84.5MME and the Street’s $85.6MME and EBITDA was
$44.6MM (51.3%) vs. our $41.9MME (49.6%) and the Street’s $42.9MM (50.1%).
Normalized FFO was $0.48 vs. our $0.42E and the Street’s $0.42E. CONE leased 44K
CSF vs. 33K CSF last quarter and 47K CSF a year ago. Churn declined to 1.7% from
2.9% last quarter although it is expected to be ~3.0% in 1Q15 and to revert back to
more historical levels thereafter.
Guidance
For 2015, the company provided revenue of $370-385MM (Street Old: $380.3MME),
EBITDA of $185-195MM (Street Old: $194.6MME), normalized FFO of $1.90-2.00
(Street Old: $1.98), and capex of $215-240MM.
Valuation
CONE trades at 15.0x 2015E FFO vs. the comp at 16.0x. We believe CONE should trade
at a premium due to superior rev/FFO growth over the next few years. Using a 15.0x
EBITDA exit multiple and a 9.1% WACC, our DCF valuation implies the stock is worth
$34 (prior $32).
Thisreportisintendedforworld-cowen-morningnotesdistribution@cowen.com.Unauthorizedredistributionofthisreportisprohibited.
At A Glance
Our Investment Thesis
CONE reported solid 4Q14 results including revenue/FFO that beat expectations.
Mgmt. also provided an in-depth overview as to why it doesn’t expect lower oil prices
to have a material impact on its business despite meaningful concerns from investors
heading into the quarter. Notably, the company also increased its dividend by 50% to
$0.315/share which equates to an annual yield of 4.2% and was meaningfully ahead
of expectations driven by its decision to increase its AFFO payout ratio to be more
in-line with peers. We believe this also points to the company’s increasing focus on
FFO growth and profitability vs. simply top-line growth which to date has been the
primary focus. While 2015 revenue/FFO guidance was slightly below expectations, we
get the sense the company is simply trying to be conservative at this point in the year
and believe it is likely trending towards at least the mid-point given the solid trends
currently being witnessed.
Forthcoming Catalysts
■ 1Q15 earnings call in May 2015.
Base Case Assumptions
■ 2014E-2019E revenue CAGR of 11.8%
■ EBITDA margin is 49.6% in 2019E
■ Apply a 15.0x terminal EBITDA
multiple to our DCF
Upside Scenario
■ 2014E-2019E revenue CAGR of
>11.8%
■ EBITDA margin is >49.6% in 2019E
■ Stock trades at an implied value of
>15.0x terminal EBITDA multiple
Downside Scenario
■ 2014E-2019E revenue CAGR of
<11.8%
■ EBITDA margin is <49.6% in 2019E
■ Stock trades at an implied value of
<15.0x terminal EBITDA multiple
Price Performance
Feb-15Nov-14Aug-14May-14
$32
30
28
26
24
22
20
18
Source: Bloomberg
Company Description
Based in Dallas, Texas, CyrusOne is an owner, operator, and developer of carrier-
neutral data centers with ~25 data centers in and around roughly eight cities within
the U.S. as well as in London and Singapore. The company’s goal is to be the preferred
global data center provider to the Fortune 1000 and it currently has ~600 customers
including nine of the Fortune 20 and 135 of the Fortune 1000. It focuses on attracting
customers who have not historically outsourced their data center needs and provides
customers with a flexible array of solutions ranging from a single rack to large 50K sq.
ft. wholesale type deployments although with a differentiated focus on service.
Analyst Top Picks
  Ticker Price (02/18/2015) Price Target Rating
Rackspace Hosting RAX $51.12 $75.00 Outperform
Level 3 Communications LVLT $53.31 $62.00 Outperform
Cogent Communications Group CCOI $39.50 $47.00 Outperform
www.cowen.com2
Cowen and Company
Equity Research
CyrusOne
February 19, 2015
Thisreportisintendedforworld-cowen-morningnotesdistribution@cowen.com.Unauthorizedredistributionofthisreportisprohibited.
CyrusOne 4Q14 Comparative Analysis
($mn)
4Q14 4Q14E Variance % 4Q14 3Q14 Variance % 4Q14 4Q13 Variance %
Key Metrics
Total CSF Utilized (EOP) 1,077,690 1,106,116 (28,426) -2.6% 1,077,690 1,056,116 21,574 2.0% 1,077,690 894,361 183,330 20.5%
Net Adds 21,574 50,000 (28,426) -56.9% 21,574 29,156 (7,582) -26.0% 21,574 51,090 (29,516) -57.8%
Total Available CSF 1,224,648 1,232,132 (7,484) -0.6% 1,224,648 1,200,132 24,516 2.0% 1,224,648 1,052,189 172,459 16.4%
% Utilized 88.0% 89.8% -1.8% -2.0% 88.0% 88.0% 0.0% 0.0% 88.0% 85.0% 3.0% 3.5%
Total Annualized Rent (EOP) $326.1 $329.8 ($3.7) -1.1% $326.1 $317.7 $8.3 2.6% $326.1 $266.9 $59.2 22.2%
Total Bookings/Leasing ("CSF") 44,000 NA NA NA 44,000 33,000 11,000 33.3% 44,000 47,000 (3,000) -6.4%
Churn 1.7% NA NA NA 1.7% 2.9% -1.2% -41.4% 1.7% 1.1% 0.6% 54.5%
Total Revenue $86.9 $84.5 $2.4 2.8% $86.9 $84.8 $2.1 2.5% $86.9 $72.3 $14.6 20.2%
y/y growth 20.2% 16.9% 3.3% - 20.2% 25.6% -5.4% - 20.2% 24.7% -4.5% -
0.0%
Property operating expenses 32.0 32.9 (0.9) -2.7% 32.0 33.0 ($1.0) -3.0% 32.0 24.3 $7.7 31.7%
as % of revenue 36.8% 38.9% -2.1% - 36.8% 38.9% -2.1% - 36.8% 33.6% 3.2% -
Net Operating Income (Company definition) 54.9 51.6 $3.3 6.3% 54.9 51.8 $3.1 6.0% 54.9 48.0 $6.9 14.4%
NOI Margin 63.2% 61.1% 2.1% - 63.2% 61.1% 2.1% - 63.2% 66.4% -3.2% -
S&M 2.3 2.5 ($0.2) -8.4% 2.3 2.4 ($0.1) -5.4% 2.3 2.2 $0.1 3.6%
as % of revenue 2.6% 3.0% -0.3% - 2.6% 2.9% -0.2% - 2.6% 3.1% -0.4% -
G&A 8.0 7.2 $0.8 11.2% 8.0 7.2 $0.8 11.6% 8.0 5.9 $2.1 36.0%
as % of revenue 9.2% 8.5% 0.7% - 9.2% 8.5% 0.8% - 9.2% 8.1% 1.1% -
Adjusted EBITDA 44.6 41.9 $2.7 6.4% 44.6 42.2 $2.4 5.7% 44.6 39.9 $4.7 11.8%
Contribution Margin 114.3% 95.4% 18.9% - 114.3% 45.2% 69.1% - 114.3% 70.8% 43.5% -
EBITDA Margin 51.3% 49.6% 1.7% - 51.3% 49.8% 1.6% - 51.3% 55.2% -3.9% -
y/y growth 11.8% 5.1% 6.7% - 11.8% 15.6% -3.8% - 11.8% 40.5% -28.7% -
Depreciation & Amortization 30.6 30.6 ($0.0) -0.2% 30.6 30.0 $0.6 2.0% 30.6 26.6 $4.0 15.0%
Stock-based compensation 2.7 2.7 ($0.0) -1.7% 2.7 2.6 $0.1 3.8% 2.7 1.3 $1.4 107.7%
Other 0.1 0.3 ($0.2) -60.0% 0.1 0.0 $0.1 NM 0.1 3.0 ($2.9) -96.7%
Total operating costs and expenses 75.7 76.2 ($0.5) -0.7% 75.7 75.2 $0.5 0.7% 75.7 63.3 $12.4 19.6%
EBIT 11.2 8.3 $2.9 35.3% 11.2 9.6 $1.6 16.7% 11.2 9.0 $2.2 24.4%
Other Income
Interest expense (9.1) (10.6) $1.5 NM (9.1) (9.0) ($0.1) NM (9.1) (11.5) $2.4 NM
Interest income 0.0 0.0 $0.0 NM 0.0 0.0 $0.0 NM 0.0 0.0 $0.0 NM
Net Income from continuing operations (11.8) (3.3) ($8.5) NM (11.8) 0.2 ($12.0) NM (11.8) (3.6) ($8.2) NM
Noncontrolling interest & other (4.8) (1.5) ($3.3) NM (4.8) 0.1 ($4.9) NM (4.8) (2.3) ($2.5) NM
Net income attributable to CyrusOne (7.0) (1.8) ($5.2) NM (7.0) 0.1 ($7.1) NM (7.0) (1.3) ($5.7) NM
Common shares 38.7 38.8 (0.1) -0.4% 38.7 38.7 (0.0) 0.0% 38.7 22.0 16.7 75.8%
Operating Partnership Units 26.6 26.6 0.0 0.0% 26.6 26.6 0.0 0.0% 26.6 42.6 (16.0) -37.5%
Total Share Equivalents 65.3 65.4 ($0.1) -0.2% 65.3 65.3 ($0.0) 0.0% 65.3 64.6 $0.7 1.0%
EPS (Common) ($0.18) ($0.05) ($0.14) NM ($0.18) $0.00 ($0.18) NM ($0.18) ($0.06) ($0.12) NM
Dividend Declared/shr $0.21 $0.21 $0.00 0.0% $0.21 $0.21 $0.00 0.0% $0.21 $0.16 $0.05 31.3%
AFFO Payout Ratio 46.0% 54.6% -8.6% - 46.0% 47.1% -1.1% - 46.0% 49.7% -3.7% -
Normalized FFO per share $0.48 $0.42 $0.06 14.9% $0.48 $0.44 $0.04 8.0% $0.48 $0.37 $0.11 30.8%
AFFO per share $0.46 $0.38 $0.07 18.7% $0.46 $0.45 $0.01 2.4% $0.46 $0.32 $0.13 41.8%
Capex 89.3 103.8 (14.5) -14.0% 89.3 78.0 11.3 14.5% 89.3 63.0 26.3 41.7%
Actuals v. Estimates Comparison Quarter over Quarter Comparison Year over Year Comparison
Source: Company data, Cowen and Company estimates
www.cowen.com 3
Cowen and Company
Equity Research
CyrusOne
February 19, 2015
Thisreportisintendedforworld-cowen-morningnotesdistribution@cowen.com.Unauthorizedredistributionofthisreportisprohibited.
Cowen New vs. Old Estimates
($mn) Mar. 1Q June 2Q Sept. 3Q Dec. 4Q
1Q15E 2Q15E 3Q15E 4Q15E 2015E 2016E 2017E 2018E 2019E
Cowen Old 90.6 94.6 98.6 102.6 386.3 446.4 510.9 569.9 623.0
Revenue Cowen New 88.9 92.6 95.8 99.4 376.7 430.4 486.8 535.9 577.4
Delta -1.9% -2.1% -2.8% -3.1% -2.5% -3.6% -4.7% -6.0% -7.3%
Cowen Old 44.7 47.1 48.6 52.0 192.4 221.9 253.2 281.7 307.0
EBITDA Cowen New 46.1 46.4 47.3 49.5 189.3 216.0 243.4 266.9 286.6
Delta 3.2% -1.6% -2.6% -4.8% -1.6% -2.7% -3.9% -5.2% -6.6%
Cowen Old $0.46 $0.49 $0.50 $0.55 $1.99 $2.30 $2.54 $2.77 $3.00
Normalized FFO/Share Cowen New $0.49 $0.49 $0.50 $0.53 $2.01 $2.39 $2.67 $2.94 $3.18
Delta 7.6% 0.9% -0.4% -3.3% 0.9% 4.0% 5.1% 6.0% 5.8%
Cowen Old 76.8 64.4 64.5 64.6 270.2 317.8 274.9 232.0 188.9
Capex Cowen New 24.3 28.9 111.4 65.7 230.3 214.5 186.2 157.8 129.2
Delta -68.4% -55.2% 72.8% 1.8% -14.8% -32.5% -32.3% -32.0% -31.6%
Source: Cowen and Company estimates
www.cowen.com4
Cowen and Company
Equity Research
CyrusOne
February 19, 2015
Thisreportisintendedforworld-cowen-morningnotesdistribution@cowen.com.Unauthorizedredistributionofthisreportisprohibited.
CyrusOne Income Statement
($mn) Mar. 1Q June 2Q Sept. 3Q Dec. 4Q Mar. 1Q June 2Q Sept. 3Q Dec. 4Q
2012 2013 1Q14 2Q14 3Q14 4Q14 2014 1Q15E 2Q15E 3Q15E 4Q15E 2015E 2016E 2017E 2018E 2019E
Total Revenue $220.8 $263.5 $77.5 $81.7 $84.8 $86.9 $330.9 $88.9 $92.6 $95.8 $99.4 $376.7 $430.4 $486.8 $535.9 $577.4
y/y growth 21.5% 19.3% 29.0% 28.5% 25.6% 20.2% 25.6% 14.7% 13.4% 12.9% 14.4% 13.8% 14.3% 13.1% 10.1% 7.8%
Property operating expenses 76.0 93.2 27.7 31.8 33.0 32.0 124.5 33.6 36.7 38.7 39.8 148.7 170.2 192.8 212.4 229.0
as % of revenue 34.4% 35.4% 35.7% 38.9% 38.9% 36.8% 37.6% 37.8% 39.6% 40.4% 40.0% 39.5% 39.5% 39.6% 39.6% 39.7%
Net Operating Income (Company definition) 144.8 170.3 49.8 49.9 51.8 54.9 206.4 55.3 55.9 57.1 59.7 228.0 260.2 294.0 323.5 348.4
NOI Margin 65.6% 64.6% 64.3% 61.1% 61.1% 63.2% 62.4% 62.2% 60.4% 59.6% 60.0% 60.5% 60.5% 60.4% 60.4% 60.3%
S&M 8.7 8.7 2.3 2.7 2.4 2.3 9.7 2.5 2.5 2.5 2.5 10.0 10.8 12.2 13.4 14.4
as % of revenue 3.9% 3.3% 3.0% 3.3% 2.9% 2.6% 2.9% 2.8% 2.7% 2.6% 2.5% 2.7% 2.5% 2.5% 2.5% 2.5%
G&A 18.3 23.6 5.8 6.4 7.2 8.0 27.4 6.7 7.0 7.3 7.6 28.7 33.4 38.5 43.1 47.3
as % of revenue 8.3% 9.0% 7.4% 7.9% 8.5% 9.2% 8.3% 7.5% 7.6% 7.6% 7.7% 7.6% 7.8% 7.9% 8.0% 8.2%
Management fees charged by CBI 2.5 0.0 0.0 0.0 0.0 0.0 0.0 0.0 0.0 0.0 0.0 0.0 0.0 0.0 0.0 0.0
Other 0.0 (0.7) 0.0 0.0 0.0 0.0 0.0 0.0 0.0 0.0 0.0 0.0 0.0 0.0 0.0 0.0
Adjusted EBITDA 115.3 138.7 41.7 40.8 42.2 44.6 169.3 46.1 46.4 47.3 49.5 189.3 216.0 243.4 266.9 286.6
Contribution Margin 40.2% 54.8% 34.6% -21.4% 45.2% 114.3% 45.4% 74.6% 7.7% 29.6% 61.3% 43.7% 49.7% 48.5% 48.0% 47.4%
EBITDA Margin 52.2% 52.6% 53.8% 49.9% 49.8% 51.3% 51.2% 51.8% 50.1% 49.4% 49.8% 50.3% 50.2% 50.0% 49.8% 49.6%
y/y growth 15.8% 20.3% 32.4% 32.5% 15.6% 11.8% 22.1% 10.5% 13.6% 12.1% 11.1% 11.8% 14.1% 12.6% 9.7% 7.4%
Depreciation & Amortization 73.4 95.2 27.6 29.8 30.0 30.6 118.0 30.8 30.9 31.6 32.0 125.4 130.7 135.4 139.3 142.5
Stock-based compensation 3.4 6.3 2.2 2.8 2.6 2.7 10.3 3.1 3.2 3.4 3.5 13.2 12.9 13.4 13.4 14.4
Other 22.2 25.6 0.1 0.8 0.0 0.1 1.0 0.0 0.0 0.0 0.0 0.0 0.0 0.0 0.0 0.0
Total operating costs and expenses 204.5 251.9 65.7 74.3 75.2 75.7 290.9 76.7 80.4 83.5 85.4 325.9 358.0 392.2 421.6 447.8
EBIT 16.3 11.6 11.8 7.4 9.6 11.2 40.0 12.2 12.2 12.3 14.0 50.8 72.4 94.6 114.2 129.7
Other Income
Interest expense (41.8) (43.7) (10.7) (10.7) (9.0) (9.1) (39.5) (9.5) (9.5) (10.0) (10.0) (39.0) (41.4) (50.4) (56.4) (59.4)
Interest income 0.0 0.0 0.0 0.0 0.0 0.0 0.0 0.0 0.0 0.0 0.0 0.0 0.0 0.0 0.0 0.0
Other 0.0 (1.2) 0.0 0.0 0.0 (13.6) (13.6) 0.0 0.0 0.0 0.0 0.0 0.0 0.0 0.0 0.0
Total other income (expense), net (41.8) (44.9) (10.7) (10.7) (9.0) (22.7) (53.1) (9.5) (9.5) (10.0) (10.0) (39.0) (41.4) (50.4) (56.4) (59.4)
EBT (25.5) (33.3) 1.1 (3.3) 0.6 (11.5) (13.1) 2.7 2.7 2.3 4.0 11.7 31.0 44.2 57.8 70.3
Income taxes (5.1) 2.3 0.4 0.3 0.4 0.3 1.4 0.3 0.3 0.3 0.3 1.2 2.0 2.0 2.0 2.0
Net Income from continuing operations (20.4) (35.6) 0.7 (3.6) 0.2 (11.8) (14.5) 2.4 2.4 2.0 3.7 10.5 29.0 42.2 55.8 68.3
Noncontrolling interest & other (0.1) (30.3) 0.5 (2.5) 0.1 (4.8) (6.7) (1.5) (1.5) (1.5) (1.5) (6.0) (6.0) (6.0) (6.0) (6.0)
Net income attributable to CyrusOne (20.3) (5.3) 0.2 (1.1) 0.1 (7.0) (7.8) 3.9 3.9 3.5 5.2 16.5 35.0 48.2 61.8 74.3
Common shares - 22.0 22.7 38.7 38.7 38.7 34.7 38.8 38.9 39.1 39.2 39.0 39.6 40.2 40.8 41.4
Operating Partnership Units - 42.6 42.6 26.6 26.6 26.6 30.6 26.6 26.6 26.6 26.6 26.6 26.6 26.6 26.6 26.6
Total Share Equivalents - 64.6 65.3 65.3 65.3 65.3 65.3 65.4 65.5 65.7 65.8 65.6 66.2 66.8 67.4 68.0
EPS (Common) - ($0.24) $0.01 ($0.03) $0.00 ($0.18) ($0.23) $0.10 $0.10 $0.09 $0.13 $0.42 $0.88 $1.20 $1.52 $1.79
y/y growth - - -121.4% -72.6% -107.2% 206.4% -6.5% 1053.0% -453.9% 3349.6% -172.9% -288.4% 108.6% 35.7% 26.4% 18.3%
Dividend Declared/shr - $0.64 $0.21 $0.21 $0.21 $0.21 $0.84 $0.32 $0.32 $0.32 $0.32 $1.26 $1.46 $1.60 $1.74 $1.88
y/y growth - - 31.3% 31.3% 31.3% 31.3% 31.3% 50.0% 50.0% 50.0% 50.0% 50.0% 16.0% 9.8% 8.5% 7.9%
AFFO Payout Ratio - 57.1% 49.8% 54.2% 47.1% 46.0% 49.1% 66.4% 66.1% 65.6% 61.5% 64.8% 65.0% 65.0% 65.0% 65.0%
As a % of Revenue
NOI Margin 65.6% 64.6% 64.3% 61.1% 61.1% 63.2% 62.4% 62.2% 60.4% 59.6% 60.0% 60.5% 60.5% 60.4% 60.4% 60.3%
Operations and Support Expense 46.6% 47.6% 46.2% 50.1% 50.2% 48.7% 48.8% 48.2% 49.9% 50.6% 50.2% 49.7% 49.8% 50.0% 50.2% 50.4%
EBITDA Margin 52.2% 52.6% 53.8% 49.9% 49.8% 51.3% 51.2% 51.8% 50.1% 49.4% 49.8% 50.3% 50.2% 50.0% 49.8% 49.6%
Depreciation and Amortization 33.2% 36.1% 35.6% 36.5% 35.4% 35.2% 35.7% 34.6% 33.4% 33.0% 32.2% 33.3% 30.4% 27.8% 26.0% 24.7%
EBIT Margin 7.4% 4.4% 15.2% 9.1% 11.3% 12.9% 12.1% 13.7% 13.2% 12.9% 14.1% 13.5% 16.8% 19.4% 21.3% 22.5%
EBT Margin -11.5% -12.6% 1.4% -4.0% 0.7% -13.2% -4.0% 3.1% 2.9% 2.4% 4.0% 3.1% 7.2% 9.1% 10.8% 12.2%
Tax Rate 20.0% -6.9% 36.4% -9.1% 66.7% -2.6% -10.7% 10.9% 11.0% 13.1% 7.5% 10.2% 6.4% 4.5% 3.5% 2.8%
NI to common Margin -9.2% -2.0% 0.3% -1.3% 0.1% -8.1% -2.4% 4.4% 4.2% 3.6% 5.2% 4.4% 8.1% 9.9% 11.5% 12.9%
Source: Company data, Cowen and Company estimates
www.cowen.com 5
Cowen and Company
Equity Research
CyrusOne
February 19, 2015
Thisreportisintendedforworld-cowen-morningnotesdistribution@cowen.com.Unauthorizedredistributionofthisreportisprohib
CyrusOne Balance Sheet
($mn) Mar. 1Q June 2Q Sept. 3Q Dec. 4Q Mar. 1Q June 2Q Sept. 3Q Dec. 4Q
2012 2013 1Q14 2Q14 3Q14 4Q14 2014 1Q15E 2Q15E 3Q15E 4Q15E 2015E 2016E 2017E 2018E 2019E
ASSETS
Net investment in real estate 706.9 883.8 924.8 959.1 1,016.2 1,051.4 1,051.4 1,044.9 1,042.8 1,122.6 1,156.3 1,156.3 1,240.1 1,290.9 1,309.4 1,296.1
Cash and cash equivalents 16.5 148.8 125.2 49.3 30.4 36.5 36.5 201.8 142.7 171.4 81.4 81.4 22.9 47.6 59.6 74.0
Rent and other receivables 33.2 41.2 42.4 61.5 59.1 60.9 60.9 46.5 54.7 57.4 63.2 63.2 68.4 77.3 85.1 91.7
Restricted cash 6.3 0.0 0.0 0.0 0.0 0.0 0.0 0.0 0.0 0.0 0.0 0.0 0.0 0.0 0.0 0.0
Goodwill 276.2 276.2 276.2 276.2 276.2 276.2 276.2 276.2 276.2 276.2 276.2 276.2 276.2 276.2 276.2 276.2
Intangible assets, net 102.6 85.9 81.7 77.4 73.2 68.9 68.9 64.9 60.9 56.9 52.9 52.9 36.9 20.9 4.9 (11.1)
Due from affiliates 2.2 0.6 0.9 0.5 1.3 0.8 0.8 0.8 0.8 0.8 0.8 0.8 0.8 0.8 0.8 0.8
Other assets 67.0 70.3 76.9 82.1 81.6 91.8 91.8 89.0 92.8 93.8 100.9 100.9 109.2 123.4 135.9 146.4
Total assets 1,210.9 1,506.8 1,528.1 1,506.1 1,538.0 1,586.5 1,586.5 1,724.1 1,670.9 1,779.1 1,731.6 1,731.6 1,754.4 1,837.2 1,871.9 1,874.1
LIABILITIES AND STOCKHOLDERS' EQUITY
Accounts payable and accrued expenses 37.1 66.8 88.8 83.9 100.2 69.9 69.9 112.0 89.2 108.8 92.6 92.6 99.5 113.0 124.9 135.0
Deferred revenue 52.8 55.9 64.8 66.7 66.1 65.7 65.7 66.5 67.2 68.0 68.7 68.7 71.7 74.7 77.7 80.7
Due to affiliates 2.9 8.5 10.8 7.4 7.4 7.3 7.3 7.3 7.3 7.3 7.3 7.3 7.3 7.3 7.3 7.3
Capital lease obligations 32.2 16.7 15.5 15.0 14.2 13.4 13.4 13.4 13.4 13.4 13.4 13.4 13.4 13.4 13.4 13.4
Long-term debt 525.0 525.0 525.0 525.0 555.0 659.8 659.8 759.8 759.8 859.8 859.8 859.8 959.8 1,109.8 1,209.8 1,259.8
Related party notes payable 0.0 0.0 0.0 0.0 0.0 0.0 0.0 0.0 0.0 0.0 0.0 0.0 0.0 0.0 0.0 1.0
Other financing arrangements 60.8 56.3 56.4 57.1 55.1 53.4 53.4 53.4 53.4 53.4 53.4 53.4 53.4 53.4 53.4 53.4
Total liabilities 710.8 729.2 761.3 755.1 798.0 869.5 869.5 1,012.3 990.3 1,110.7 1,095.2 1,095.2 1,205.1 1,371.6 1,486.5 1,550.6
Total stockholders' equity 500.1 322.0 319.6 478.8 473.3 460.7 460.7 455.4 424.3 412.1 380.1 380.1 293.0 209.3 129.2 67.2
Non-controlling interest 0.0 455.6 447.2 272.2 266.7 256.3 256.3 256.3 256.3 256.3 256.3 256.3 256.3 256.3 256.3 256.3
Total liabilities and stockholders' equity 1,210.9 1,506.8 1,528.1 1,506.1 1,538.0 1,586.5 1,586.5 1,724.1 1,670.9 1,779.1 1,731.6 1,731.6 1,754.4 1,837.2 1,871.9 1,874.1
Source: Company data, Cowen and Company estimates
www.cowen.com6
Cowen and Company
Equity Research
CyrusOne
February 19, 2015
Thisreportisintendedforworld-cowen-morningnotesdistribution@cowen.com.Unauthorizedredistributionofthisreportisprohib
CyrusOne FFO
($thou) Mar. 1Q June 2Q Sept. 3Q Dec. 4Q Mar. 1Q June 2Q Sept. 3Q Dec. 4Q
2012 2013 1Q14 2Q14 3Q14 4Q14 2014 1Q15E 2Q15E 3Q15E 4Q15E 2015E 2016E 2017E 2018E 2019E
Company Provided FFO
Net income (20.4) (35.8) 0.7 (3.6) 0.2 (11.8) (14.5) 2.4 2.4 2.0 3.7 10.5 29.0 42.2 55.8 68.3
Real estate depreciation and amortization 52.9 70.6 22.2 24.1 24.5 25.1 95.9 25.4 25.7 26.4 26.9 104.4 112.4 119.1 125.4 131.1
Amortization of customer relationship intangibles 16.0 16.8 4.2 4.3 4.2 4.2 16.9 4.2 4.2 4.2 4.2 16.8 16.8 16.8 16.8 16.8
Real estate impairments 11.7 2.8 0.0 0.0 0.0 0.0 0.0 0.0 0.0 0.0 0.0 0.0 0.0 0.0 0.0 0.0
Customer relationship intangibles impairments 1.5 0.0 0.0 0.0 0.0 0.0 0.0 0.0 0.0 0.0 0.0 0.0 0.0 0.0 0.0 0.0
Gain on sale of real estate improvements (0.1) 0.2 0.0 0.0 0.0 0.0 0.0 0.0 0.0 0.0 0.0 0.0 0.0 0.0 0.0 0.0
FFO 61.6 54.6 27.1 24.8 28.9 17.5 98.3 32.0 32.3 32.6 34.8 131.7 158.2 178.1 198.0 216.2
Transaction costs 5.7 1.4 0.1 0.8 0.0 0.1 1.0 0.0 0.0 0.0 0.0 0.0 0.0 0.0 0.0 0.0
Other 0.0 22.7 0.0 0.0 0.0 13.6 13.6 0.0 0.0 0.0 0.0 0.0 0.0 0.0 0.0 0.0
Normalized FFO (Company definition) 67.3 78.7 27.2 25.6 28.9 31.2 112.9 32.0 32.3 32.6 34.8 131.7 158.2 178.1 198.0 216.2
y/y growth - 16.9% 58.1% 60.0% 32.0% 32.2% 43.5% 17.7% 26.2% 12.8% 11.5% 16.7% 20.1% 12.6% 11.2% 9.2%
Normalized FFO per share - $1.22 $0.42 $0.39 $0.44 $0.48 $1.73 $0.49 $0.49 $0.50 $0.53 $2.01 $2.39 $2.67 $2.94 $3.18
y/y growth - - 56.2% 58.6% 30.8% 30.8% - 17.5% 25.6% 12.1% 10.5% 16.0% 19.1% 11.6% 10.2% 8.2%
Company Provided Adjusted FFO
Normalized FFO 67.3 78.7 27.2 25.6 28.9 31.2 112.9 32.0 32.3 32.6 34.8 131.7 158.2 178.1 198.0 216.2
Amortization of deferred financing costs 0.3 4.1 0.9 0.9 0.9 0.7 3.4 1.0 1.0 1.0 1.0 4.0 4.0 4.0 4.0 4.0
Stock-based compensation 3.4 6.3 2.2 2.8 2.6 2.7 10.3 3.1 3.2 3.4 3.5 13.2 12.9 13.4 13.4 14.4
Non-real estate depreciation 4.5 7.8 1.2 1.4 1.2 1.4 5.2 1.2 1.1 1.0 0.9 4.2 1.5 (0.6) (2.9) (5.4)
Deferred revenue/Straight-line rent adjustments (8.3) (13.9) (3.0) (3.7) (1.5) (2.3) (10.5) (2.5) (2.5) (2.5) (2.5) (10.0) (10.0) (10.0) (10.0) (10.0)
Leasing commissions (4.4) (6.8) (0.6) (1.4) (0.9) (2.9) (5.8) (2.0) (2.0) (2.0) (2.0) (8.0) (9.1) (10.3) (11.4) (12.3)
Recurring capital expenditures (3.9) (4.2) (0.4) (0.3) (2.1) (1.0) (3.8) (1.8) (1.9) (1.9) (2.0) (7.5) (8.6) (9.7) (10.7) (11.5)
Corporate income tax (benefit)/expense (5.8) 0.4 0.0 0.0 0.0 0.0 0.0 0.0 0.0 0.0 0.0 0.0 0.0 0.0 0.0 1.0
AFFO 53.1 72.4 27.5 25.3 29.1 29.8 111.7 31.0 31.2 31.6 33.7 127.5 148.9 164.9 180.5 196.4
y/y growth - 36.3% 57.1% 70.9% 50.8% 43.3% 54.3% 12.8% 23.5% 8.4% 13.1% 14.2% 16.7% 10.7% 9.4% 8.9%
AFFO per share - $1.12 $0.42 $0.39 $0.45 $0.46 $1.71 $0.47 $0.48 $0.48 $0.51 $1.94 $2.25 $2.47 $2.68 $2.89
y/y growth - - 55.2% 69.5% 49.5% 41.8% 52.8% 12.6% 23.0% 7.7% 12.1% 13.6% 15.7% 9.8% 8.5% 7.9%
Source: Company data, Cowen and Company estimates
www.cowen.com 7
Cowen and Company
Equity Research
CyrusOne
February 19, 2015
Thisreportisintendedforworld-cowen-morningnotesdistribution@cowen.com.Unauthorizedredistributionofthisreportisprohib
CyrusOne DCF
($mn) Terminal
2014 2015E 2016E 2017E 2018E 2019E Value
Revenue $331 $377 $430 $487 $536 $577
EBITDA 169 189 216 243 267 287 4,300
CFO 111 151 153 168 187 221
Capex 284 230 214 186 158 129
Free Cash Flow (173) (79) (62) (18) 29 92
ADD BACK: Interest Expense 41 52 58 67 72 75
Unlevered Free Cash Flow (132) (28) (4) 48 102 167
Year 0.0 0.5 1.5 2.5 3.5 4.5 4.5
Present Value Discount Factor 1.00 1.04 1.14 1.24 1.36 1.48 1.48
Present Value of Free Cash Flow (132) (27) (4) 39 75 113 2,904
Today
Total PV of Free Cash Flow $197
Percentage of DCF 6.3%
Terminal Value $2,904
Percentage of DCF 93.7%
Sum of DCFs $3,101
Net Debt and Preferred Stock $637
Net Equity Value $2,464
Other/Cash $0
Private market value $2,464
less 10% public / private discount ($246)
Public market value $2,218
Shares Outstanding 65.3
Fair Value Price $33.99
Current Price $30.16
WACC 9.1%
Terminal EBITDA Multiple 15.0
Risk Free Rate 2.5%
Beta 1.0
Equity Premium 10.2%
Cost of Debt 6.0%
Percentage of Capital 50.0%
Cost of Equity 12.2%
Percentage of Capital 50.0%
Valuation Summary
Terminal Multiple 11.0 12.0 13.0 14.0 15.0 16.0 17.0 18.0 19.0
Discount Rate 9.1% 9.1% 9.1% 9.1% 9.1% 9.1% 9.1% 9.1% 9.1%
Sum of PV of Free Cash Flow $197 $197 $197 $197 $197 $197 $197 $197 $197
PV of Terminal Value $2,130 $2,323 $2,517 $2,710 $2,904 $3,098 $3,291 $3,485 $3,679
Sum of DCFs $2,327 $2,520 $2,714 $2,907 $3,101 $3,295 $3,488 $3,682 $3,875
less net debt $637 $637 $637 $637 $637 $637 $637 $637 $637
Net Equity Value $1,690 $1,883 $2,077 $2,271 $2,464 $2,658 $2,851 $3,045 $3,239
Other/Cash $0 $0 $0 $0 $0 $0 $0 $0 $0
Private market value $1,690 $1,883 $2,077 $2,271 $2,464 $2,658 $2,851 $3,045 $3,239
less 10% public / private discount ($169) ($188) ($208) ($227) ($246) ($266) ($285) ($305) ($324)
Public market value $1,521 $1,695 $1,869 $2,044 $2,218 $2,392 $2,566 $2,741 $2,915
Diluted Shares Outstanding 65 65 65 65 65 65 65 65 65
Per Share $23.31 $25.98 $28.65 $31.32 $33.99 $36.66 $39.33 $42.00 $44.67
Enterprise Value $2,158 $2,332 $2,506 $2,680 $2,855 $3,029 $3,203 $3,377 $3,552
EV / 2015E Revenue 5.7x 6.2x 6.7x 7.1x 7.6x 8.0x 8.5x 9.0x 9.4x
EV / 2015E EBITDA 11.4x 12.3x 13.2x 14.2x 15.1x 16.0x 16.9x 17.8x 18.8x
Source: Company data, Cowen and Company estimates
www.cowen.com8
Cowen and Company
Equity Research
CyrusOne
February 19, 2015
Thisreportisintendedforworld-cowen-morningnotesdistribution@cowen.com.Unauthorizedredistributionofthisreportisprohibited.
Comparative Analysis – Data Services REITs
Dividend Dividend
C ompany Ticker Rating Price Mkt C ap EV FFO/Sh Yield Payout Total Debt/ Net Debt/ 2014 2015
2/18/2015 $ MM $ MM C 2015E C 2016E C 2015E C 2016E C 2015E C 2016E C 2015E C 2016E C 2015E C 2016E C 2015E C 2016E C 2015E C 2016E C 2015E (% of AFFO) Total C ap EBITDA YTD
Towers
American Tower AMT * 1 $96.20 38,662 53,595 4,627 5,086 2,949 3,254 $4.91 $5.55 $5.03 $5.77 18.2x 16.5x 19.6x 17.3x 19.1x 16.7x 12.7% 10.8% 14.6% 10.9% 1.8% 34.0% 79.3% 5.4x 23.8% -2.7%
Crown Castle CCI * 1 $88.20 30,352 41,949 3,753 3,849 2,157 2,245 $4.36 $4.56 $4.38 $4.85 19.5x 18.7x 20.2x 19.3x 20.1x 18.2x 1.7% 0.9% 7.2% 4.5% 3.7% 74.9% 67.5% 5.3x 7.2% 12.1%
SBA Coms. SBAC * 1 $122.17 15,824 23,757 1,686 1,763 1,108 1,196 $5.61 $6.31 $5.81 $6.55 21.4x 19.9x 21.8x 19.4x 21.0x 18.6x 11.1% 12.1% 22.8% 13.3% NA NA 101.8% 7.8x 23.3% 10.3%
Mean 19.7x 18.3x 20.5x 18.7x 20.1x 17.8x 8.5% 7.9% 14.9% 9.6% 2.7% 54.5% 82.9% 6.2x 18.1% 6.6%
Median 19.5x 18.7x 20.2x 19.3x 20.1x 18.2x 11.1% 10.8% 14.6% 10.9% 2.7% 54.5% 79.3% 5.4x 23.3% 10.3%
REIT Co-lo
CoreSite COR * 2 $48.52 2,288 2,711 317 364 156 180 $2.59 $2.94 $2.24 $2.58 17.4x 15.0x 18.7x 16.5x 21.7x 18.8x 16.5% 17.1% 16.8% 26.7% 3.6% 77.8% 49.7% 2.1x 21.3% 24.3%
CyrusOne CONE * 1 $30.16 1,968 2,605 377 430 189 216 $2.01 $2.39 $1.94 $2.25 13.8x 12.1x 15.0x 12.6x 15.5x 13.4x 13.8% 11.8% 16.0% 13.6% 4.2% 64.8% 59.4% 3.6x NA 9.5%
Digital Realty Trust DLR * 2 $67.58 9,369 15,075 1,656 1,733 969 1,017 $5.03 $5.09 $3.74 $3.86 15.6x 14.8x 13.4x 13.3x 18.1x 17.5x 2.5% 3.5% 1.3% -1.5% 5.0% 89.9% 54.6% 4.7x 35.0% 1.9%
Dupont Fabros DFT * 1 $32.06 2,637 3,984 432 482 289 322 $2.51 $2.80 $2.64 $2.94 13.8x 12.4x 12.8x 11.4x 12.2x 10.9x 3.4% 5.1% 4.7% 5.0% 5.3% 64.9% 47.9% 3.5x 34.5% -3.5%
Equinix EQIX * 2 $228.91 13,104 16,549 2,638 2,925 1,221 1,361 $11.44 $13.59 $13.36 $15.48 13.5x 12.2x 20.0x 16.8x 17.1x 14.8x 8.4% 9.9% 8.1% -2.0% 1.7% 29.7% 58.0% 3.0x 32.8% 1.0%
QTS Realty Trust QTS NR $37.80 1,409 1,995 260 302 120 144 $2.32 $2.67 $2.31 $2.74 16.6x 13.9x 16.3x 14.2x 16.3x 13.8x 20.1% 25.1% 17.0% 16.9% 3.7% 60.9% 60.6% 0.6x NA 11.7%
Mean 15.1x 13.4x 16.0x 14.1x 16.8x 14.9x 8.9% 9.5% 9.4% 8.3% 4.0% 65.4% 53.9% 3.4x 30.9% 6.6%
Median 14.7x 13.6x 14.2x 12.9x 16.8x 15.5x 8.6% 8.5% 10.4% 9.3% 4.6% 71.3% 52.2% 3.5x 34.5% 5.7%
Market Indices
S&P 500 .SPX 2,100 1,168 1,159 220 233 NA NA NA NA 10.2x 9.3x NM NM NM NM 4.9% -81.9% NA NA 2.1% NA NA NA 11.4% 2.0%
1 = Outperform, 2 = Market Perform, 3 = Underperform, NR = Not Rated
* Cowen covered company
BASIC INFORMATION VALUATION 2015E Growth
AFFO/ShP/FFOFFOEBITDARevenue
BASIC FINANC IALS
AFFO
Performance
EV/EBITDA P/AFFO
Leverage (LQA)
Sales EBITDA
Source: Company data, Thomson One, Cowen and Company estimates
www.cowen.com 9
Cowen and Company
Equity Research
CyrusOne
February 19, 2015
Thisreportisintendedforworld-cowen-morningnotesdistribution@cowen.com.Unauthorizedredistributionofthisreportisprohib
Valuation Methodology And Risks
Valuation Methodology
Telecom Services:
Our valuation methodology consists of an absolute and relative value approach.
We arrive at a fair value utilizing a five-year discounted cash flow (DCF) and when
appropriate a segmented sum-of-parts (SOP) analysis. Our relative value approach
takes into account EV/EBITDA, P/FCF, and P/E and, when applicable, P/AFFO and
dividend yield.
Investment Risks
Telecom Services:
Risks Include: (1) many companies within Telecom Services are highly regulated
where a change in rules could lead to unfavorable conditions; (2) rapidly changing/
disruptive technology, new product/service offerings, and evolving industry/technology
standards could have an impact on demand and/or pricing; and (3) deterioration in
the macro environment both domestically and internationally could lead to a reduction
in demand and a consequent impact on valuation multiples.
Risks To The Price Target
Risks for CyrusOne include: 1) a likely secondary-offering by its largest shareholder
may limit near-term upside until its completed, 2) the co-location industry in which
CyrusOne operates is competitive with a growing number of competitors, and 3) the
data center stocks are particularly susceptible to fluctuations in interest rates in which
rising/falling rates may have a negative/positive impact on the stock price.
www.cowen.com10
Cowen and Company
Equity Research
CyrusOne
February 19, 2015
Thisreportisintendedforworld-cowen-morningnotesdistribution@cowen.com.Unauthorizedredistributionofthisreportisprohibited.
Addendum
Analyst Certification
Each author of this research report hereby certifies that (i) the views expressed in the research report accurately reflect his or her personal views about any and all of the subject
securities or issuers, and (ii) no part of his or her compensation was, is, or will be related, directly or indirectly, to the specific recommendations or views expressed in this report.
Important Disclosures
This report constitutes a compendium report (covers six or more subject companies). As such, Cowen and Company, LLC chooses to provide specific disclosures for the companies
mentioned by reference. To access current disclosures for the all companies in this report, clients should refer to https://cowen.bluematrix.com/sellside/Disclosures.action or
contact your Cowen and Company, LLC representative for additional information.
Cowen and Company, LLC compensates research analysts for activities and services intended to benefit the firm's investor clients. Individual compensation determinations for
research analysts, including the author(s) of this report, are based on a variety of factors, including the overall profitability of the firm and the total revenue derived from all sources,
including revenues from investment banking. Cowen and Company, LLC does not compensate research analysts based on specific investment banking transactions.
Disclaimer
This research is for our clients only. Our research is disseminated primarily electronically and, in some cases, in printed form. Research distributed electronically is available
simultaneously to all Cowen and Company, LLC clients. All published research can be obtained on the Firm's client website, https://cowenlibrary.bluematrix.com/client/library.jsp.
Further information on any of the above securities may be obtained from our offices. This report is published solely for information purposes, and is not to be construed as an offer
to sell or the solicitation of an offer to buy any security in any state where such an offer or solicitation would be illegal. Other than disclosures relating to Cowen and Company, LLC,
the information herein is based on sources we believe to be reliable but is not guaranteed by us and does not purport to be a complete statement or summary of the available data.
Any opinions expressed herein are statements of our judgment on this date and are subject to change without notice.
For important disclosures regarding the companies that are the subject of this research report, please contact Compliance Department, Cowen and Company, LLC, 599 Lexington
Avenue, 20th Floor, New York, NY 10022. In addition, the same important disclosures, with the exception of the valuation methods and risks, are available on the Firm's disclosure
website at https://cowen.bluematrix.com/sellside/Disclosures.action.
Price Targets: Cowen and Company, LLC assigns price targets on all covered companies unless noted otherwise. The price target for an issuer's stock represents the value that
the analyst reasonably expects the stock to reach over a performance period of twelve months. The price targets in this report should be considered in the context of all prior
published Cowen and Company, LLC research reports (including the disclosures in any such report or on the Firm's disclosure website), which may or may not include price
targets, as well as developments relating to the issuer, its industry and the financial markets. For price target valuation methodology and risks associated with the achievement of
any given price target, please see the analyst's research report publishing such targets.
Notice to UK Investors: This publication is produced by Cowen and Company, LLC which is regulated in the United States by FINRA. It is to be communicated only to persons
of a kind described in Articles 19 and 49 of the Financial Services and Markets Act 2000 (Financial Promotion) Order 2005. It must not be further transmitted to any other person
without our consent.
Copyright, User Agreement and other general information related to this report
© 2015 Cowen and Company, LLC. Member NYSE, FINRA and SIPC. All rights reserved. This research report is prepared for the exclusive use of Cowen clients and may not be
reproduced, displayed, modified, distributed, transmitted or disclosed, in whole or in part, or in any form or manner, to others outside your organization without the express prior
written consent of Cowen. Cowen research reports are distributed simultaneously to all clients eligible to receive such research reports. Any unauthorized use or disclosure is
prohibited. Receipt and/or review of this research constitutes your agreement not to reproduce, display, modify, distribute, transmit, or disclose to others outside your organization
the contents, opinions, conclusion, or information contained in this report (including any investment recommendations, estimates or price targets). All Cowen trademarks displayed
in this report are owned by Cowen and may not be used without its prior written consent.
Cowen and Company, LLC. New York (646) 562-1000 Boston (617) 946-3700 San Francisco (415) 646-7200 Chicago (312) 577-2240 Cleveland (440) 331-3531 Atlanta
(866) 544-7009 London (affiliate) 44-207-071-7500
COWEN AND COMPANY RATING DEFINITIONS
Cowen and Company Rating System effective May 25, 2013
Outperform (1): The stock is expected to achieve a total positive return of at least 15% over the next 12 months
Market Perform (2): The stock is expected to have a total return that falls between the parameters of an Outperform and Underperform over the next 12 months
Underperform (3): Stock is expected to achieve a total negative return of at least 10% over the next 12 months
Assumption: The expected total return calculation includes anticipated dividend yield
Cowen and Company Rating System until May 25, 2013
Outperform (1): Stock expected to outperform the S&P 500
Neutral (2): Stock expected to perform in line with the S&P 500
Underperform (3): Stock expected to underperform the S&P 500
Assumptions: Time horizon is 12 months; S&P 500 is flat over forecast period
Cowen Securities, formerly known as Dahlman Rose & Company, Rating System until May 25, 2013
Buy – The fundamentals/valuations of the subject company are improving and the investment return is expected to be 5 to 15 percentage points higher than the general market
return
Sell – The fundamentals/valuations of the subject company are deteriorating and the investment return is expected to be 5 to 15 percentage points lower than the general market
return
Hold – The fundamentals/valuations of the subject company are neither improving nor deteriorating and the investment return is expected to be in line with the general market
return
www.cowen.com 11
Cowen and Company
Equity Research
CyrusOne
February 19, 2015
Thisreportisintendedforworld-cowen-morningnotesdistribution@cowen.com.Unauthorizedredistributionofthisreportisprohibited.
Cowen And Company Rating Definitions
Distribution of Ratings/Investment Banking Services (IB) as of 12/31/14
Rating Count Ratings Distribution  Count IB Services/Past 12 Months
Buy (a) 461 60.50%  109 23.64%
Hold (b) 288 37.80%  14 4.86%
Sell (c) 13 1.71%  0 0.00%
(a) Corresponds to "Outperform" rated stocks as defined in Cowen and Company, LLC's rating definitions. (b) Corresponds to "Market Perform" as defined in Cowen and Company,
LLC's ratings definitions. (c) Corresponds to "Underperform" as defined in Cowen and Company, LLC's ratings definitions.
Note: "Buy", "Hold" and "Sell" are not terms that Cowen and Company, LLC uses in its ratings system and should not be construed as investment options. Rather, these ratings
terms are used illustratively to comply with FINRA and NYSE regulations.
www.cowen.com12
Cowen and Company
Equity Research
CyrusOne
February 19, 2015
Thisreportisintendedforworld-cowen-morningnotesdistribution@cowen.com.Unauthorizedredistributionofthisreportisprohibited.
Points Of Contact
Analyst Profiles
Colby Synesael
New York
646.562.1355
colby.synesael@cowen.com
Colby Synesael is a senior analyst
covering telecom & data services. He
joined Cowen in 2010 and has been on
Wall Street since 2001.
Jonathan Charbonneau
New York
646.562.1356
jonathan.charbonneau@cowen.com
Jonathan Charbonneau is an associate
covering telecom & data services. He
previously worked at Kaufman Bros. and
Merriman Curhan Ford.
Gregory Williams, CFA
New York
646.562.1367
gregory.williams@cowen.com
Gregory Williams is an associate
covering telecom & data services. He
worked a combined twelve years at
AT&T, J.P. Morgan and Sidoti & Co.
Reaching Cowen
Main U.S. Locations
New York
599 Lexington Avenue
New York, NY 10022
646.562.1000
800.221.5616
Atlanta
3399 Peachtree Road NE
Suite 417
Atlanta, GA 30326
866.544.7009
Boston
Two International Place
Boston, MA 02110
617.946.3700
800.343.7068
Chicago
181 West Madison Street
Suite 3135
Chicago, IL 60602
312.577.2240
Cleveland
20006 Detroit Road
Suite 100
Rocky River, OH 44116
440.331.3531
San Francisco
555 California Street, 5th Floor
San Francisco, CA 94104
415.646.7200
800.858.9316
International Locations
Cowen International
Limited
Cowen and Company (Asia)
Limited
London
1 Snowden Street - 11th Floor
London EC2A 2DQ
United Kingdom
44.20.7071.7500
Hong Kong
Suite 1401 Henley Building
No. 5 Queens Road Central
Central, Hong Kong
852 3752 2333
@CowenResearch Cowen and Company
www.cowen.com 13
Cowen and Company
Equity Research
CyrusOne
February 19, 2015
Thisreportisintendedforworld-cowen-morningnotesdistribution@cowen.com.Unauthorizedredistributionofthisreportisprohibited.

More Related Content

What's hot

Financial Statement Analysis PowerPoint Presentation Slides
Financial Statement Analysis PowerPoint Presentation Slides Financial Statement Analysis PowerPoint Presentation Slides
Financial Statement Analysis PowerPoint Presentation Slides SlideTeam
 
omnicom group annual reports 2002
omnicom group annual reports 2002omnicom group annual reports 2002
omnicom group annual reports 2002finance22
 
Tricumen / 1Q16 Capital Markets Results Review_open
Tricumen / 1Q16 Capital Markets Results Review_openTricumen / 1Q16 Capital Markets Results Review_open
Tricumen / 1Q16 Capital Markets Results Review_openTricumen Ltd
 
Flevy.com - LBO Model Template
Flevy.com - LBO Model TemplateFlevy.com - LBO Model Template
Flevy.com - LBO Model TemplateDavid Tracy
 
Progressive-1Q 06 QSR
Progressive-1Q 06 QSRProgressive-1Q 06 QSR
Progressive-1Q 06 QSRfinance18
 
Progressive 2Q 05 QSR
Progressive 2Q 05 QSRProgressive 2Q 05 QSR
Progressive 2Q 05 QSRfinance18
 
Q1 2009 Earning Report of Northern Trust Corporation
Q1 2009 Earning Report of Northern Trust CorporationQ1 2009 Earning Report of Northern Trust Corporation
Q1 2009 Earning Report of Northern Trust Corporationearningreport earningreport
 
Grendene - 2nd Annual Brazil Conference Itaú Securies
Grendene - 2nd Annual Brazil Conference Itaú SecuriesGrendene - 2nd Annual Brazil Conference Itaú Securies
Grendene - 2nd Annual Brazil Conference Itaú SecuriesGrendene
 
Sample Financial Analysis Report Manufacturing PowerPoint Presentation Slides
Sample Financial Analysis Report Manufacturing PowerPoint Presentation Slides Sample Financial Analysis Report Manufacturing PowerPoint Presentation Slides
Sample Financial Analysis Report Manufacturing PowerPoint Presentation Slides SlideTeam
 
omnicom group Q3 2006 Investor Presentation
omnicom group  Q3 2006 Investor Presentationomnicom group  Q3 2006 Investor Presentation
omnicom group Q3 2006 Investor Presentationfinance22
 
Progressive 3Q 04 QSR
Progressive 3Q 04 QSRProgressive 3Q 04 QSR
Progressive 3Q 04 QSRfinance18
 
u.s.bancorp 3Q 2006 Earnings Release
u.s.bancorp 3Q 2006 Earnings Release  u.s.bancorp 3Q 2006 Earnings Release
u.s.bancorp 3Q 2006 Earnings Release finance13
 

What's hot (15)

Financial Statement Analysis PowerPoint Presentation Slides
Financial Statement Analysis PowerPoint Presentation Slides Financial Statement Analysis PowerPoint Presentation Slides
Financial Statement Analysis PowerPoint Presentation Slides
 
omnicom group annual reports 2002
omnicom group annual reports 2002omnicom group annual reports 2002
omnicom group annual reports 2002
 
Tricumen / 1Q16 Capital Markets Results Review_open
Tricumen / 1Q16 Capital Markets Results Review_openTricumen / 1Q16 Capital Markets Results Review_open
Tricumen / 1Q16 Capital Markets Results Review_open
 
Flevy.com - LBO Model Template
Flevy.com - LBO Model TemplateFlevy.com - LBO Model Template
Flevy.com - LBO Model Template
 
Progressive-1Q 06 QSR
Progressive-1Q 06 QSRProgressive-1Q 06 QSR
Progressive-1Q 06 QSR
 
Progressive 2Q 05 QSR
Progressive 2Q 05 QSRProgressive 2Q 05 QSR
Progressive 2Q 05 QSR
 
Q1 2009 Earning Report of Northern Trust Corporation
Q1 2009 Earning Report of Northern Trust CorporationQ1 2009 Earning Report of Northern Trust Corporation
Q1 2009 Earning Report of Northern Trust Corporation
 
Piaggio Group - First Nine Months 2011 Financial Results
Piaggio Group - First Nine Months 2011 Financial ResultsPiaggio Group - First Nine Months 2011 Financial Results
Piaggio Group - First Nine Months 2011 Financial Results
 
Grendene - 2nd Annual Brazil Conference Itaú Securies
Grendene - 2nd Annual Brazil Conference Itaú SecuriesGrendene - 2nd Annual Brazil Conference Itaú Securies
Grendene - 2nd Annual Brazil Conference Itaú Securies
 
Sample Financial Analysis Report Manufacturing PowerPoint Presentation Slides
Sample Financial Analysis Report Manufacturing PowerPoint Presentation Slides Sample Financial Analysis Report Manufacturing PowerPoint Presentation Slides
Sample Financial Analysis Report Manufacturing PowerPoint Presentation Slides
 
Final tax mod slides 12 09-12
Final tax mod slides 12 09-12Final tax mod slides 12 09-12
Final tax mod slides 12 09-12
 
omnicom group Q3 2006 Investor Presentation
omnicom group  Q3 2006 Investor Presentationomnicom group  Q3 2006 Investor Presentation
omnicom group Q3 2006 Investor Presentation
 
Progressive 3Q 04 QSR
Progressive 3Q 04 QSRProgressive 3Q 04 QSR
Progressive 3Q 04 QSR
 
u.s.bancorp 3Q 2006 Earnings Release
u.s.bancorp 3Q 2006 Earnings Release  u.s.bancorp 3Q 2006 Earnings Release
u.s.bancorp 3Q 2006 Earnings Release
 
American Eagle presentation
American Eagle presentationAmerican Eagle presentation
American Eagle presentation
 

Similar to Data Center REIT CyrusOne Reports Solid 4Q14 Results and Substantial Dividend Increase

20180620 sauc oppenheimer consumer conference widescreen final
20180620 sauc oppenheimer consumer conference widescreen final20180620 sauc oppenheimer consumer conference widescreen final
20180620 sauc oppenheimer consumer conference widescreen finaldrhincorporated
 
KELYA_News_2016_11_7_General
KELYA_News_2016_11_7_GeneralKELYA_News_2016_11_7_General
KELYA_News_2016_11_7_GeneralDaniel Pagano
 
Q4 2016 - Management Investor Presentation
Q4 2016 - Management Investor PresentationQ4 2016 - Management Investor Presentation
Q4 2016 - Management Investor PresentationRioCan
 
WFM - Initiating Coverage - Report
WFM - Initiating Coverage - ReportWFM - Initiating Coverage - Report
WFM - Initiating Coverage - ReportAlessandro Masi
 
ACG Cup Presentation - Round 1
ACG Cup Presentation - Round  1ACG Cup Presentation - Round  1
ACG Cup Presentation - Round 1Milton Parra
 
RMP initiation report (6 Apr 15)
RMP initiation report (6 Apr 15)RMP initiation report (6 Apr 15)
RMP initiation report (6 Apr 15)Nathan Judge
 
Earnings 4Q15 Presentation
Earnings 4Q15 PresentationEarnings 4Q15 Presentation
Earnings 4Q15 Presentationir_digitalrealty
 
Q2 fy17 results presentation vf
Q2 fy17 results presentation vfQ2 fy17 results presentation vf
Q2 fy17 results presentation vfnordangliair
 
Financial services sector - implications of FOFA, possible acquires of SFW, S...
Financial services sector - implications of FOFA, possible acquires of SFW, S...Financial services sector - implications of FOFA, possible acquires of SFW, S...
Financial services sector - implications of FOFA, possible acquires of SFW, S...George Gabriel
 
SFW - FOFA implications, Sum of parts valuation, possible acquirers
SFW - FOFA implications, Sum of parts valuation, possible acquirers SFW - FOFA implications, Sum of parts valuation, possible acquirers
SFW - FOFA implications, Sum of parts valuation, possible acquirers George Gabriel
 
Hershey Presentation at 2024 CAGY Conference
Hershey Presentation at 2024 CAGY ConferenceHershey Presentation at 2024 CAGY Conference
Hershey Presentation at 2024 CAGY ConferenceNeil Kimberley
 
Midwest IDEAS Conference
Midwest IDEAS ConferenceMidwest IDEAS Conference
Midwest IDEAS Conferencedrhincorporated
 
yhoo valuation
yhoo valuationyhoo valuation
yhoo valuationMerjerz
 
Apple - Yahoo M
Apple - Yahoo MApple - Yahoo M
Apple - Yahoo MMerjerz
 
Rexnord Corporation (RXN) Fourth Quarter 2014 Earnings Release
Rexnord Corporation (RXN) Fourth Quarter 2014 Earnings ReleaseRexnord Corporation (RXN) Fourth Quarter 2014 Earnings Release
Rexnord Corporation (RXN) Fourth Quarter 2014 Earnings ReleaseRexnord
 
Moving from What to Why
Moving from What to WhyMoving from What to Why
Moving from What to WhyDavid Johnson
 
Lvs 3 q15 earnings deck vfinal 2
Lvs 3 q15 earnings deck vfinal 2Lvs 3 q15 earnings deck vfinal 2
Lvs 3 q15 earnings deck vfinal 2Investor_lvs
 

Similar to Data Center REIT CyrusOne Reports Solid 4Q14 Results and Substantial Dividend Increase (20)

Evercore ISI
Evercore ISIEvercore ISI
Evercore ISI
 
20180620 sauc oppenheimer consumer conference widescreen final
20180620 sauc oppenheimer consumer conference widescreen final20180620 sauc oppenheimer consumer conference widescreen final
20180620 sauc oppenheimer consumer conference widescreen final
 
KELYA_News_2016_11_7_General
KELYA_News_2016_11_7_GeneralKELYA_News_2016_11_7_General
KELYA_News_2016_11_7_General
 
Q4 2016 - Management Investor Presentation
Q4 2016 - Management Investor PresentationQ4 2016 - Management Investor Presentation
Q4 2016 - Management Investor Presentation
 
WFM - Initiating Coverage - Report
WFM - Initiating Coverage - ReportWFM - Initiating Coverage - Report
WFM - Initiating Coverage - Report
 
ACG Cup Presentation - Round 1
ACG Cup Presentation - Round  1ACG Cup Presentation - Round  1
ACG Cup Presentation - Round 1
 
RMP initiation report (6 Apr 15)
RMP initiation report (6 Apr 15)RMP initiation report (6 Apr 15)
RMP initiation report (6 Apr 15)
 
Earnings 4Q15 Presentation
Earnings 4Q15 PresentationEarnings 4Q15 Presentation
Earnings 4Q15 Presentation
 
Q2 fy17 results presentation vf
Q2 fy17 results presentation vfQ2 fy17 results presentation vf
Q2 fy17 results presentation vf
 
Financial services sector - implications of FOFA, possible acquires of SFW, S...
Financial services sector - implications of FOFA, possible acquires of SFW, S...Financial services sector - implications of FOFA, possible acquires of SFW, S...
Financial services sector - implications of FOFA, possible acquires of SFW, S...
 
SFW - FOFA implications, Sum of parts valuation, possible acquirers
SFW - FOFA implications, Sum of parts valuation, possible acquirers SFW - FOFA implications, Sum of parts valuation, possible acquirers
SFW - FOFA implications, Sum of parts valuation, possible acquirers
 
Hershey Presentation at 2024 CAGY Conference
Hershey Presentation at 2024 CAGY ConferenceHershey Presentation at 2024 CAGY Conference
Hershey Presentation at 2024 CAGY Conference
 
Midwest IDEAS Conference
Midwest IDEAS ConferenceMidwest IDEAS Conference
Midwest IDEAS Conference
 
University of Toronto - St. George - Presentation
University of Toronto - St. George - PresentationUniversity of Toronto - St. George - Presentation
University of Toronto - St. George - Presentation
 
yhoo valuation
yhoo valuationyhoo valuation
yhoo valuation
 
Apple - Yahoo M
Apple - Yahoo MApple - Yahoo M
Apple - Yahoo M
 
Rexnord Corporation (RXN) Fourth Quarter 2014 Earnings Release
Rexnord Corporation (RXN) Fourth Quarter 2014 Earnings ReleaseRexnord Corporation (RXN) Fourth Quarter 2014 Earnings Release
Rexnord Corporation (RXN) Fourth Quarter 2014 Earnings Release
 
Moving from What to Why
Moving from What to WhyMoving from What to Why
Moving from What to Why
 
MARKETING
MARKETINGMARKETING
MARKETING
 
Lvs 3 q15 earnings deck vfinal 2
Lvs 3 q15 earnings deck vfinal 2Lvs 3 q15 earnings deck vfinal 2
Lvs 3 q15 earnings deck vfinal 2
 

Data Center REIT CyrusOne Reports Solid 4Q14 Results and Substantial Dividend Increase

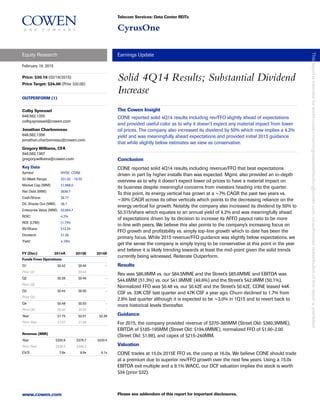
  • 1. Telecom Services: Data Center REITs CyrusOne Equity Research Earnings Update www.cowen.com Please see addendum of this report for important disclosures. February 19, 2015 Price: $30.16 (02/18/2015) Price Target: $34.00 (Prior $32.00) OUTPERFORM (1) Solid 4Q14 Results; Substantial Dividend Increase Colby Synesael 646.562.1355 colby.synesael@cowen.com Jonathan Charbonneau 646.562.1356 jonathan.charbonneau@cowen.com Gregory Williams, CFA 646.562.1367 gregory.williams@cowen.com Key Data Symbol NYSE: CONE 52-Week Range: $31.02 - 19.52 Market Cap (MM): $1,968.0 Net Debt (MM): $636.7 Cash/Share: $6.77 Dil. Shares Out (MM): 38.7 Enterprise Value (MM): $2,604.7 ROIC: 4.2% ROE (LTM): (1.7)% BV/Share: $12.25 Dividend: $1.26 Yield: 4.18% FY (Dec) 2014A 2015E 2016E Funds From Operations Q1 $0.42 $0.49 - Prior Q1 - $0.46 - Q2 $0.39 $0.49 - Prior Q2 - - - Q3 $0.44 $0.50 - Prior Q3 - - - Q4 $0.48 $0.53 - Prior Q4 $0.42 $0.55 - Year $1.73 $2.01 $2.39 Prior Year $1.67 $1.99 Revenue (MM) Year $330.9 $376.7 $430.4 Prior Year $328.5 $386.3 EV/S 7.9x 6.9x 6.1x The Cowen Insight CONE reported solid 4Q14 results including rev/FFO slightly ahead of expectations and provided useful color as to why it doesn’t expect any material impact from lower oil prices. The company also increased its dividend by 50% which now implies a 4.2% yield and was meaningfully ahead expectations and provided initial 2015 guidance that while slightly below estimates we view as conservative. Conclusion CONE reported solid 4Q14 results including revenue/FFO that beat expectations driven in part by higher installs than was expected. Mgmt. also provided an in-depth overview as to why it doesn’t expect lower oil prices to have a material impact on its business despite meaningful concerns from investors heading into the quarter. To this point, its energy vertical has grown at a ~7% CAGR the past two years vs. ~30% CAGR across its other verticals which points to the decreasing reliance on the energy vertical for growth. Notably, the company also increased its dividend by 50% to $0.315/share which equates to an annual yield of 4.2% and was meaningfully ahead of expectations driven by its decision to increase its AFFO payout ratio to be more in-line with peers. We believe this also points to the company’s increasing focus on FFO growth and profitability vs. simply top-line growth which to date has been the primary focus. While 2015 revenue/FFO guidance was slightly below expectations, we get the sense the company is simply trying to be conservative at this point in the year and believe it is likely trending towards at least the mid-point given the solid trends currently being witnessed. Reiterate Outperform. Results Rev was $86.9MM vs. our $84.5MME and the Street’s $85.6MME and EBITDA was $44.6MM (51.3%) vs. our $41.9MME (49.6%) and the Street’s $42.9MM (50.1%). Normalized FFO was $0.48 vs. our $0.42E and the Street’s $0.42E. CONE leased 44K CSF vs. 33K CSF last quarter and 47K CSF a year ago. Churn declined to 1.7% from 2.9% last quarter although it is expected to be ~3.0% in 1Q15 and to revert back to more historical levels thereafter. Guidance For 2015, the company provided revenue of $370-385MM (Street Old: $380.3MME), EBITDA of $185-195MM (Street Old: $194.6MME), normalized FFO of $1.90-2.00 (Street Old: $1.98), and capex of $215-240MM. Valuation CONE trades at 15.0x 2015E FFO vs. the comp at 16.0x. We believe CONE should trade at a premium due to superior rev/FFO growth over the next few years. Using a 15.0x EBITDA exit multiple and a 9.1% WACC, our DCF valuation implies the stock is worth $34 (prior $32). Thisreportisintendedforworld-cowen-morningnotesdistribution@cowen.com.Unauthorizedredistributionofthisreportisprohibited.
  • 2. At A Glance Our Investment Thesis CONE reported solid 4Q14 results including revenue/FFO that beat expectations. Mgmt. also provided an in-depth overview as to why it doesn’t expect lower oil prices to have a material impact on its business despite meaningful concerns from investors heading into the quarter. Notably, the company also increased its dividend by 50% to $0.315/share which equates to an annual yield of 4.2% and was meaningfully ahead of expectations driven by its decision to increase its AFFO payout ratio to be more in-line with peers. We believe this also points to the company’s increasing focus on FFO growth and profitability vs. simply top-line growth which to date has been the primary focus. While 2015 revenue/FFO guidance was slightly below expectations, we get the sense the company is simply trying to be conservative at this point in the year and believe it is likely trending towards at least the mid-point given the solid trends currently being witnessed. Forthcoming Catalysts ■ 1Q15 earnings call in May 2015. Base Case Assumptions ■ 2014E-2019E revenue CAGR of 11.8% ■ EBITDA margin is 49.6% in 2019E ■ Apply a 15.0x terminal EBITDA multiple to our DCF Upside Scenario ■ 2014E-2019E revenue CAGR of >11.8% ■ EBITDA margin is >49.6% in 2019E ■ Stock trades at an implied value of >15.0x terminal EBITDA multiple Downside Scenario ■ 2014E-2019E revenue CAGR of <11.8% ■ EBITDA margin is <49.6% in 2019E ■ Stock trades at an implied value of <15.0x terminal EBITDA multiple Price Performance Feb-15Nov-14Aug-14May-14 $32 30 28 26 24 22 20 18 Source: Bloomberg Company Description Based in Dallas, Texas, CyrusOne is an owner, operator, and developer of carrier- neutral data centers with ~25 data centers in and around roughly eight cities within the U.S. as well as in London and Singapore. The company’s goal is to be the preferred global data center provider to the Fortune 1000 and it currently has ~600 customers including nine of the Fortune 20 and 135 of the Fortune 1000. It focuses on attracting customers who have not historically outsourced their data center needs and provides customers with a flexible array of solutions ranging from a single rack to large 50K sq. ft. wholesale type deployments although with a differentiated focus on service. Analyst Top Picks   Ticker Price (02/18/2015) Price Target Rating Rackspace Hosting RAX $51.12 $75.00 Outperform Level 3 Communications LVLT $53.31 $62.00 Outperform Cogent Communications Group CCOI $39.50 $47.00 Outperform www.cowen.com2 Cowen and Company Equity Research CyrusOne February 19, 2015 Thisreportisintendedforworld-cowen-morningnotesdistribution@cowen.com.Unauthorizedredistributionofthisreportisprohibited.
  • 3. CyrusOne 4Q14 Comparative Analysis ($mn) 4Q14 4Q14E Variance % 4Q14 3Q14 Variance % 4Q14 4Q13 Variance % Key Metrics Total CSF Utilized (EOP) 1,077,690 1,106,116 (28,426) -2.6% 1,077,690 1,056,116 21,574 2.0% 1,077,690 894,361 183,330 20.5% Net Adds 21,574 50,000 (28,426) -56.9% 21,574 29,156 (7,582) -26.0% 21,574 51,090 (29,516) -57.8% Total Available CSF 1,224,648 1,232,132 (7,484) -0.6% 1,224,648 1,200,132 24,516 2.0% 1,224,648 1,052,189 172,459 16.4% % Utilized 88.0% 89.8% -1.8% -2.0% 88.0% 88.0% 0.0% 0.0% 88.0% 85.0% 3.0% 3.5% Total Annualized Rent (EOP) $326.1 $329.8 ($3.7) -1.1% $326.1 $317.7 $8.3 2.6% $326.1 $266.9 $59.2 22.2% Total Bookings/Leasing ("CSF") 44,000 NA NA NA 44,000 33,000 11,000 33.3% 44,000 47,000 (3,000) -6.4% Churn 1.7% NA NA NA 1.7% 2.9% -1.2% -41.4% 1.7% 1.1% 0.6% 54.5% Total Revenue $86.9 $84.5 $2.4 2.8% $86.9 $84.8 $2.1 2.5% $86.9 $72.3 $14.6 20.2% y/y growth 20.2% 16.9% 3.3% - 20.2% 25.6% -5.4% - 20.2% 24.7% -4.5% - 0.0% Property operating expenses 32.0 32.9 (0.9) -2.7% 32.0 33.0 ($1.0) -3.0% 32.0 24.3 $7.7 31.7% as % of revenue 36.8% 38.9% -2.1% - 36.8% 38.9% -2.1% - 36.8% 33.6% 3.2% - Net Operating Income (Company definition) 54.9 51.6 $3.3 6.3% 54.9 51.8 $3.1 6.0% 54.9 48.0 $6.9 14.4% NOI Margin 63.2% 61.1% 2.1% - 63.2% 61.1% 2.1% - 63.2% 66.4% -3.2% - S&M 2.3 2.5 ($0.2) -8.4% 2.3 2.4 ($0.1) -5.4% 2.3 2.2 $0.1 3.6% as % of revenue 2.6% 3.0% -0.3% - 2.6% 2.9% -0.2% - 2.6% 3.1% -0.4% - G&A 8.0 7.2 $0.8 11.2% 8.0 7.2 $0.8 11.6% 8.0 5.9 $2.1 36.0% as % of revenue 9.2% 8.5% 0.7% - 9.2% 8.5% 0.8% - 9.2% 8.1% 1.1% - Adjusted EBITDA 44.6 41.9 $2.7 6.4% 44.6 42.2 $2.4 5.7% 44.6 39.9 $4.7 11.8% Contribution Margin 114.3% 95.4% 18.9% - 114.3% 45.2% 69.1% - 114.3% 70.8% 43.5% - EBITDA Margin 51.3% 49.6% 1.7% - 51.3% 49.8% 1.6% - 51.3% 55.2% -3.9% - y/y growth 11.8% 5.1% 6.7% - 11.8% 15.6% -3.8% - 11.8% 40.5% -28.7% - Depreciation & Amortization 30.6 30.6 ($0.0) -0.2% 30.6 30.0 $0.6 2.0% 30.6 26.6 $4.0 15.0% Stock-based compensation 2.7 2.7 ($0.0) -1.7% 2.7 2.6 $0.1 3.8% 2.7 1.3 $1.4 107.7% Other 0.1 0.3 ($0.2) -60.0% 0.1 0.0 $0.1 NM 0.1 3.0 ($2.9) -96.7% Total operating costs and expenses 75.7 76.2 ($0.5) -0.7% 75.7 75.2 $0.5 0.7% 75.7 63.3 $12.4 19.6% EBIT 11.2 8.3 $2.9 35.3% 11.2 9.6 $1.6 16.7% 11.2 9.0 $2.2 24.4% Other Income Interest expense (9.1) (10.6) $1.5 NM (9.1) (9.0) ($0.1) NM (9.1) (11.5) $2.4 NM Interest income 0.0 0.0 $0.0 NM 0.0 0.0 $0.0 NM 0.0 0.0 $0.0 NM Net Income from continuing operations (11.8) (3.3) ($8.5) NM (11.8) 0.2 ($12.0) NM (11.8) (3.6) ($8.2) NM Noncontrolling interest & other (4.8) (1.5) ($3.3) NM (4.8) 0.1 ($4.9) NM (4.8) (2.3) ($2.5) NM Net income attributable to CyrusOne (7.0) (1.8) ($5.2) NM (7.0) 0.1 ($7.1) NM (7.0) (1.3) ($5.7) NM Common shares 38.7 38.8 (0.1) -0.4% 38.7 38.7 (0.0) 0.0% 38.7 22.0 16.7 75.8% Operating Partnership Units 26.6 26.6 0.0 0.0% 26.6 26.6 0.0 0.0% 26.6 42.6 (16.0) -37.5% Total Share Equivalents 65.3 65.4 ($0.1) -0.2% 65.3 65.3 ($0.0) 0.0% 65.3 64.6 $0.7 1.0% EPS (Common) ($0.18) ($0.05) ($0.14) NM ($0.18) $0.00 ($0.18) NM ($0.18) ($0.06) ($0.12) NM Dividend Declared/shr $0.21 $0.21 $0.00 0.0% $0.21 $0.21 $0.00 0.0% $0.21 $0.16 $0.05 31.3% AFFO Payout Ratio 46.0% 54.6% -8.6% - 46.0% 47.1% -1.1% - 46.0% 49.7% -3.7% - Normalized FFO per share $0.48 $0.42 $0.06 14.9% $0.48 $0.44 $0.04 8.0% $0.48 $0.37 $0.11 30.8% AFFO per share $0.46 $0.38 $0.07 18.7% $0.46 $0.45 $0.01 2.4% $0.46 $0.32 $0.13 41.8% Capex 89.3 103.8 (14.5) -14.0% 89.3 78.0 11.3 14.5% 89.3 63.0 26.3 41.7% Actuals v. Estimates Comparison Quarter over Quarter Comparison Year over Year Comparison Source: Company data, Cowen and Company estimates www.cowen.com 3 Cowen and Company Equity Research CyrusOne February 19, 2015 Thisreportisintendedforworld-cowen-morningnotesdistribution@cowen.com.Unauthorizedredistributionofthisreportisprohibited.
  • 4. Cowen New vs. Old Estimates ($mn) Mar. 1Q June 2Q Sept. 3Q Dec. 4Q 1Q15E 2Q15E 3Q15E 4Q15E 2015E 2016E 2017E 2018E 2019E Cowen Old 90.6 94.6 98.6 102.6 386.3 446.4 510.9 569.9 623.0 Revenue Cowen New 88.9 92.6 95.8 99.4 376.7 430.4 486.8 535.9 577.4 Delta -1.9% -2.1% -2.8% -3.1% -2.5% -3.6% -4.7% -6.0% -7.3% Cowen Old 44.7 47.1 48.6 52.0 192.4 221.9 253.2 281.7 307.0 EBITDA Cowen New 46.1 46.4 47.3 49.5 189.3 216.0 243.4 266.9 286.6 Delta 3.2% -1.6% -2.6% -4.8% -1.6% -2.7% -3.9% -5.2% -6.6% Cowen Old $0.46 $0.49 $0.50 $0.55 $1.99 $2.30 $2.54 $2.77 $3.00 Normalized FFO/Share Cowen New $0.49 $0.49 $0.50 $0.53 $2.01 $2.39 $2.67 $2.94 $3.18 Delta 7.6% 0.9% -0.4% -3.3% 0.9% 4.0% 5.1% 6.0% 5.8% Cowen Old 76.8 64.4 64.5 64.6 270.2 317.8 274.9 232.0 188.9 Capex Cowen New 24.3 28.9 111.4 65.7 230.3 214.5 186.2 157.8 129.2 Delta -68.4% -55.2% 72.8% 1.8% -14.8% -32.5% -32.3% -32.0% -31.6% Source: Cowen and Company estimates www.cowen.com4 Cowen and Company Equity Research CyrusOne February 19, 2015 Thisreportisintendedforworld-cowen-morningnotesdistribution@cowen.com.Unauthorizedredistributionofthisreportisprohibited.
  • 5. CyrusOne Income Statement ($mn) Mar. 1Q June 2Q Sept. 3Q Dec. 4Q Mar. 1Q June 2Q Sept. 3Q Dec. 4Q 2012 2013 1Q14 2Q14 3Q14 4Q14 2014 1Q15E 2Q15E 3Q15E 4Q15E 2015E 2016E 2017E 2018E 2019E Total Revenue $220.8 $263.5 $77.5 $81.7 $84.8 $86.9 $330.9 $88.9 $92.6 $95.8 $99.4 $376.7 $430.4 $486.8 $535.9 $577.4 y/y growth 21.5% 19.3% 29.0% 28.5% 25.6% 20.2% 25.6% 14.7% 13.4% 12.9% 14.4% 13.8% 14.3% 13.1% 10.1% 7.8% Property operating expenses 76.0 93.2 27.7 31.8 33.0 32.0 124.5 33.6 36.7 38.7 39.8 148.7 170.2 192.8 212.4 229.0 as % of revenue 34.4% 35.4% 35.7% 38.9% 38.9% 36.8% 37.6% 37.8% 39.6% 40.4% 40.0% 39.5% 39.5% 39.6% 39.6% 39.7% Net Operating Income (Company definition) 144.8 170.3 49.8 49.9 51.8 54.9 206.4 55.3 55.9 57.1 59.7 228.0 260.2 294.0 323.5 348.4 NOI Margin 65.6% 64.6% 64.3% 61.1% 61.1% 63.2% 62.4% 62.2% 60.4% 59.6% 60.0% 60.5% 60.5% 60.4% 60.4% 60.3% S&M 8.7 8.7 2.3 2.7 2.4 2.3 9.7 2.5 2.5 2.5 2.5 10.0 10.8 12.2 13.4 14.4 as % of revenue 3.9% 3.3% 3.0% 3.3% 2.9% 2.6% 2.9% 2.8% 2.7% 2.6% 2.5% 2.7% 2.5% 2.5% 2.5% 2.5% G&A 18.3 23.6 5.8 6.4 7.2 8.0 27.4 6.7 7.0 7.3 7.6 28.7 33.4 38.5 43.1 47.3 as % of revenue 8.3% 9.0% 7.4% 7.9% 8.5% 9.2% 8.3% 7.5% 7.6% 7.6% 7.7% 7.6% 7.8% 7.9% 8.0% 8.2% Management fees charged by CBI 2.5 0.0 0.0 0.0 0.0 0.0 0.0 0.0 0.0 0.0 0.0 0.0 0.0 0.0 0.0 0.0 Other 0.0 (0.7) 0.0 0.0 0.0 0.0 0.0 0.0 0.0 0.0 0.0 0.0 0.0 0.0 0.0 0.0 Adjusted EBITDA 115.3 138.7 41.7 40.8 42.2 44.6 169.3 46.1 46.4 47.3 49.5 189.3 216.0 243.4 266.9 286.6 Contribution Margin 40.2% 54.8% 34.6% -21.4% 45.2% 114.3% 45.4% 74.6% 7.7% 29.6% 61.3% 43.7% 49.7% 48.5% 48.0% 47.4% EBITDA Margin 52.2% 52.6% 53.8% 49.9% 49.8% 51.3% 51.2% 51.8% 50.1% 49.4% 49.8% 50.3% 50.2% 50.0% 49.8% 49.6% y/y growth 15.8% 20.3% 32.4% 32.5% 15.6% 11.8% 22.1% 10.5% 13.6% 12.1% 11.1% 11.8% 14.1% 12.6% 9.7% 7.4% Depreciation & Amortization 73.4 95.2 27.6 29.8 30.0 30.6 118.0 30.8 30.9 31.6 32.0 125.4 130.7 135.4 139.3 142.5 Stock-based compensation 3.4 6.3 2.2 2.8 2.6 2.7 10.3 3.1 3.2 3.4 3.5 13.2 12.9 13.4 13.4 14.4 Other 22.2 25.6 0.1 0.8 0.0 0.1 1.0 0.0 0.0 0.0 0.0 0.0 0.0 0.0 0.0 0.0 Total operating costs and expenses 204.5 251.9 65.7 74.3 75.2 75.7 290.9 76.7 80.4 83.5 85.4 325.9 358.0 392.2 421.6 447.8 EBIT 16.3 11.6 11.8 7.4 9.6 11.2 40.0 12.2 12.2 12.3 14.0 50.8 72.4 94.6 114.2 129.7 Other Income Interest expense (41.8) (43.7) (10.7) (10.7) (9.0) (9.1) (39.5) (9.5) (9.5) (10.0) (10.0) (39.0) (41.4) (50.4) (56.4) (59.4) Interest income 0.0 0.0 0.0 0.0 0.0 0.0 0.0 0.0 0.0 0.0 0.0 0.0 0.0 0.0 0.0 0.0 Other 0.0 (1.2) 0.0 0.0 0.0 (13.6) (13.6) 0.0 0.0 0.0 0.0 0.0 0.0 0.0 0.0 0.0 Total other income (expense), net (41.8) (44.9) (10.7) (10.7) (9.0) (22.7) (53.1) (9.5) (9.5) (10.0) (10.0) (39.0) (41.4) (50.4) (56.4) (59.4) EBT (25.5) (33.3) 1.1 (3.3) 0.6 (11.5) (13.1) 2.7 2.7 2.3 4.0 11.7 31.0 44.2 57.8 70.3 Income taxes (5.1) 2.3 0.4 0.3 0.4 0.3 1.4 0.3 0.3 0.3 0.3 1.2 2.0 2.0 2.0 2.0 Net Income from continuing operations (20.4) (35.6) 0.7 (3.6) 0.2 (11.8) (14.5) 2.4 2.4 2.0 3.7 10.5 29.0 42.2 55.8 68.3 Noncontrolling interest & other (0.1) (30.3) 0.5 (2.5) 0.1 (4.8) (6.7) (1.5) (1.5) (1.5) (1.5) (6.0) (6.0) (6.0) (6.0) (6.0) Net income attributable to CyrusOne (20.3) (5.3) 0.2 (1.1) 0.1 (7.0) (7.8) 3.9 3.9 3.5 5.2 16.5 35.0 48.2 61.8 74.3 Common shares - 22.0 22.7 38.7 38.7 38.7 34.7 38.8 38.9 39.1 39.2 39.0 39.6 40.2 40.8 41.4 Operating Partnership Units - 42.6 42.6 26.6 26.6 26.6 30.6 26.6 26.6 26.6 26.6 26.6 26.6 26.6 26.6 26.6 Total Share Equivalents - 64.6 65.3 65.3 65.3 65.3 65.3 65.4 65.5 65.7 65.8 65.6 66.2 66.8 67.4 68.0 EPS (Common) - ($0.24) $0.01 ($0.03) $0.00 ($0.18) ($0.23) $0.10 $0.10 $0.09 $0.13 $0.42 $0.88 $1.20 $1.52 $1.79 y/y growth - - -121.4% -72.6% -107.2% 206.4% -6.5% 1053.0% -453.9% 3349.6% -172.9% -288.4% 108.6% 35.7% 26.4% 18.3% Dividend Declared/shr - $0.64 $0.21 $0.21 $0.21 $0.21 $0.84 $0.32 $0.32 $0.32 $0.32 $1.26 $1.46 $1.60 $1.74 $1.88 y/y growth - - 31.3% 31.3% 31.3% 31.3% 31.3% 50.0% 50.0% 50.0% 50.0% 50.0% 16.0% 9.8% 8.5% 7.9% AFFO Payout Ratio - 57.1% 49.8% 54.2% 47.1% 46.0% 49.1% 66.4% 66.1% 65.6% 61.5% 64.8% 65.0% 65.0% 65.0% 65.0% As a % of Revenue NOI Margin 65.6% 64.6% 64.3% 61.1% 61.1% 63.2% 62.4% 62.2% 60.4% 59.6% 60.0% 60.5% 60.5% 60.4% 60.4% 60.3% Operations and Support Expense 46.6% 47.6% 46.2% 50.1% 50.2% 48.7% 48.8% 48.2% 49.9% 50.6% 50.2% 49.7% 49.8% 50.0% 50.2% 50.4% EBITDA Margin 52.2% 52.6% 53.8% 49.9% 49.8% 51.3% 51.2% 51.8% 50.1% 49.4% 49.8% 50.3% 50.2% 50.0% 49.8% 49.6% Depreciation and Amortization 33.2% 36.1% 35.6% 36.5% 35.4% 35.2% 35.7% 34.6% 33.4% 33.0% 32.2% 33.3% 30.4% 27.8% 26.0% 24.7% EBIT Margin 7.4% 4.4% 15.2% 9.1% 11.3% 12.9% 12.1% 13.7% 13.2% 12.9% 14.1% 13.5% 16.8% 19.4% 21.3% 22.5% EBT Margin -11.5% -12.6% 1.4% -4.0% 0.7% -13.2% -4.0% 3.1% 2.9% 2.4% 4.0% 3.1% 7.2% 9.1% 10.8% 12.2% Tax Rate 20.0% -6.9% 36.4% -9.1% 66.7% -2.6% -10.7% 10.9% 11.0% 13.1% 7.5% 10.2% 6.4% 4.5% 3.5% 2.8% NI to common Margin -9.2% -2.0% 0.3% -1.3% 0.1% -8.1% -2.4% 4.4% 4.2% 3.6% 5.2% 4.4% 8.1% 9.9% 11.5% 12.9% Source: Company data, Cowen and Company estimates www.cowen.com 5 Cowen and Company Equity Research CyrusOne February 19, 2015 Thisreportisintendedforworld-cowen-morningnotesdistribution@cowen.com.Unauthorizedredistributionofthisreportisprohib
  • 6. CyrusOne Balance Sheet ($mn) Mar. 1Q June 2Q Sept. 3Q Dec. 4Q Mar. 1Q June 2Q Sept. 3Q Dec. 4Q 2012 2013 1Q14 2Q14 3Q14 4Q14 2014 1Q15E 2Q15E 3Q15E 4Q15E 2015E 2016E 2017E 2018E 2019E ASSETS Net investment in real estate 706.9 883.8 924.8 959.1 1,016.2 1,051.4 1,051.4 1,044.9 1,042.8 1,122.6 1,156.3 1,156.3 1,240.1 1,290.9 1,309.4 1,296.1 Cash and cash equivalents 16.5 148.8 125.2 49.3 30.4 36.5 36.5 201.8 142.7 171.4 81.4 81.4 22.9 47.6 59.6 74.0 Rent and other receivables 33.2 41.2 42.4 61.5 59.1 60.9 60.9 46.5 54.7 57.4 63.2 63.2 68.4 77.3 85.1 91.7 Restricted cash 6.3 0.0 0.0 0.0 0.0 0.0 0.0 0.0 0.0 0.0 0.0 0.0 0.0 0.0 0.0 0.0 Goodwill 276.2 276.2 276.2 276.2 276.2 276.2 276.2 276.2 276.2 276.2 276.2 276.2 276.2 276.2 276.2 276.2 Intangible assets, net 102.6 85.9 81.7 77.4 73.2 68.9 68.9 64.9 60.9 56.9 52.9 52.9 36.9 20.9 4.9 (11.1) Due from affiliates 2.2 0.6 0.9 0.5 1.3 0.8 0.8 0.8 0.8 0.8 0.8 0.8 0.8 0.8 0.8 0.8 Other assets 67.0 70.3 76.9 82.1 81.6 91.8 91.8 89.0 92.8 93.8 100.9 100.9 109.2 123.4 135.9 146.4 Total assets 1,210.9 1,506.8 1,528.1 1,506.1 1,538.0 1,586.5 1,586.5 1,724.1 1,670.9 1,779.1 1,731.6 1,731.6 1,754.4 1,837.2 1,871.9 1,874.1 LIABILITIES AND STOCKHOLDERS' EQUITY Accounts payable and accrued expenses 37.1 66.8 88.8 83.9 100.2 69.9 69.9 112.0 89.2 108.8 92.6 92.6 99.5 113.0 124.9 135.0 Deferred revenue 52.8 55.9 64.8 66.7 66.1 65.7 65.7 66.5 67.2 68.0 68.7 68.7 71.7 74.7 77.7 80.7 Due to affiliates 2.9 8.5 10.8 7.4 7.4 7.3 7.3 7.3 7.3 7.3 7.3 7.3 7.3 7.3 7.3 7.3 Capital lease obligations 32.2 16.7 15.5 15.0 14.2 13.4 13.4 13.4 13.4 13.4 13.4 13.4 13.4 13.4 13.4 13.4 Long-term debt 525.0 525.0 525.0 525.0 555.0 659.8 659.8 759.8 759.8 859.8 859.8 859.8 959.8 1,109.8 1,209.8 1,259.8 Related party notes payable 0.0 0.0 0.0 0.0 0.0 0.0 0.0 0.0 0.0 0.0 0.0 0.0 0.0 0.0 0.0 1.0 Other financing arrangements 60.8 56.3 56.4 57.1 55.1 53.4 53.4 53.4 53.4 53.4 53.4 53.4 53.4 53.4 53.4 53.4 Total liabilities 710.8 729.2 761.3 755.1 798.0 869.5 869.5 1,012.3 990.3 1,110.7 1,095.2 1,095.2 1,205.1 1,371.6 1,486.5 1,550.6 Total stockholders' equity 500.1 322.0 319.6 478.8 473.3 460.7 460.7 455.4 424.3 412.1 380.1 380.1 293.0 209.3 129.2 67.2 Non-controlling interest 0.0 455.6 447.2 272.2 266.7 256.3 256.3 256.3 256.3 256.3 256.3 256.3 256.3 256.3 256.3 256.3 Total liabilities and stockholders' equity 1,210.9 1,506.8 1,528.1 1,506.1 1,538.0 1,586.5 1,586.5 1,724.1 1,670.9 1,779.1 1,731.6 1,731.6 1,754.4 1,837.2 1,871.9 1,874.1 Source: Company data, Cowen and Company estimates www.cowen.com6 Cowen and Company Equity Research CyrusOne February 19, 2015 Thisreportisintendedforworld-cowen-morningnotesdistribution@cowen.com.Unauthorizedredistributionofthisreportisprohib
  • 7. CyrusOne FFO ($thou) Mar. 1Q June 2Q Sept. 3Q Dec. 4Q Mar. 1Q June 2Q Sept. 3Q Dec. 4Q 2012 2013 1Q14 2Q14 3Q14 4Q14 2014 1Q15E 2Q15E 3Q15E 4Q15E 2015E 2016E 2017E 2018E 2019E Company Provided FFO Net income (20.4) (35.8) 0.7 (3.6) 0.2 (11.8) (14.5) 2.4 2.4 2.0 3.7 10.5 29.0 42.2 55.8 68.3 Real estate depreciation and amortization 52.9 70.6 22.2 24.1 24.5 25.1 95.9 25.4 25.7 26.4 26.9 104.4 112.4 119.1 125.4 131.1 Amortization of customer relationship intangibles 16.0 16.8 4.2 4.3 4.2 4.2 16.9 4.2 4.2 4.2 4.2 16.8 16.8 16.8 16.8 16.8 Real estate impairments 11.7 2.8 0.0 0.0 0.0 0.0 0.0 0.0 0.0 0.0 0.0 0.0 0.0 0.0 0.0 0.0 Customer relationship intangibles impairments 1.5 0.0 0.0 0.0 0.0 0.0 0.0 0.0 0.0 0.0 0.0 0.0 0.0 0.0 0.0 0.0 Gain on sale of real estate improvements (0.1) 0.2 0.0 0.0 0.0 0.0 0.0 0.0 0.0 0.0 0.0 0.0 0.0 0.0 0.0 0.0 FFO 61.6 54.6 27.1 24.8 28.9 17.5 98.3 32.0 32.3 32.6 34.8 131.7 158.2 178.1 198.0 216.2 Transaction costs 5.7 1.4 0.1 0.8 0.0 0.1 1.0 0.0 0.0 0.0 0.0 0.0 0.0 0.0 0.0 0.0 Other 0.0 22.7 0.0 0.0 0.0 13.6 13.6 0.0 0.0 0.0 0.0 0.0 0.0 0.0 0.0 0.0 Normalized FFO (Company definition) 67.3 78.7 27.2 25.6 28.9 31.2 112.9 32.0 32.3 32.6 34.8 131.7 158.2 178.1 198.0 216.2 y/y growth - 16.9% 58.1% 60.0% 32.0% 32.2% 43.5% 17.7% 26.2% 12.8% 11.5% 16.7% 20.1% 12.6% 11.2% 9.2% Normalized FFO per share - $1.22 $0.42 $0.39 $0.44 $0.48 $1.73 $0.49 $0.49 $0.50 $0.53 $2.01 $2.39 $2.67 $2.94 $3.18 y/y growth - - 56.2% 58.6% 30.8% 30.8% - 17.5% 25.6% 12.1% 10.5% 16.0% 19.1% 11.6% 10.2% 8.2% Company Provided Adjusted FFO Normalized FFO 67.3 78.7 27.2 25.6 28.9 31.2 112.9 32.0 32.3 32.6 34.8 131.7 158.2 178.1 198.0 216.2 Amortization of deferred financing costs 0.3 4.1 0.9 0.9 0.9 0.7 3.4 1.0 1.0 1.0 1.0 4.0 4.0 4.0 4.0 4.0 Stock-based compensation 3.4 6.3 2.2 2.8 2.6 2.7 10.3 3.1 3.2 3.4 3.5 13.2 12.9 13.4 13.4 14.4 Non-real estate depreciation 4.5 7.8 1.2 1.4 1.2 1.4 5.2 1.2 1.1 1.0 0.9 4.2 1.5 (0.6) (2.9) (5.4) Deferred revenue/Straight-line rent adjustments (8.3) (13.9) (3.0) (3.7) (1.5) (2.3) (10.5) (2.5) (2.5) (2.5) (2.5) (10.0) (10.0) (10.0) (10.0) (10.0) Leasing commissions (4.4) (6.8) (0.6) (1.4) (0.9) (2.9) (5.8) (2.0) (2.0) (2.0) (2.0) (8.0) (9.1) (10.3) (11.4) (12.3) Recurring capital expenditures (3.9) (4.2) (0.4) (0.3) (2.1) (1.0) (3.8) (1.8) (1.9) (1.9) (2.0) (7.5) (8.6) (9.7) (10.7) (11.5) Corporate income tax (benefit)/expense (5.8) 0.4 0.0 0.0 0.0 0.0 0.0 0.0 0.0 0.0 0.0 0.0 0.0 0.0 0.0 1.0 AFFO 53.1 72.4 27.5 25.3 29.1 29.8 111.7 31.0 31.2 31.6 33.7 127.5 148.9 164.9 180.5 196.4 y/y growth - 36.3% 57.1% 70.9% 50.8% 43.3% 54.3% 12.8% 23.5% 8.4% 13.1% 14.2% 16.7% 10.7% 9.4% 8.9% AFFO per share - $1.12 $0.42 $0.39 $0.45 $0.46 $1.71 $0.47 $0.48 $0.48 $0.51 $1.94 $2.25 $2.47 $2.68 $2.89 y/y growth - - 55.2% 69.5% 49.5% 41.8% 52.8% 12.6% 23.0% 7.7% 12.1% 13.6% 15.7% 9.8% 8.5% 7.9% Source: Company data, Cowen and Company estimates www.cowen.com 7 Cowen and Company Equity Research CyrusOne February 19, 2015 Thisreportisintendedforworld-cowen-morningnotesdistribution@cowen.com.Unauthorizedredistributionofthisreportisprohib
  • 8. CyrusOne DCF ($mn) Terminal 2014 2015E 2016E 2017E 2018E 2019E Value Revenue $331 $377 $430 $487 $536 $577 EBITDA 169 189 216 243 267 287 4,300 CFO 111 151 153 168 187 221 Capex 284 230 214 186 158 129 Free Cash Flow (173) (79) (62) (18) 29 92 ADD BACK: Interest Expense 41 52 58 67 72 75 Unlevered Free Cash Flow (132) (28) (4) 48 102 167 Year 0.0 0.5 1.5 2.5 3.5 4.5 4.5 Present Value Discount Factor 1.00 1.04 1.14 1.24 1.36 1.48 1.48 Present Value of Free Cash Flow (132) (27) (4) 39 75 113 2,904 Today Total PV of Free Cash Flow $197 Percentage of DCF 6.3% Terminal Value $2,904 Percentage of DCF 93.7% Sum of DCFs $3,101 Net Debt and Preferred Stock $637 Net Equity Value $2,464 Other/Cash $0 Private market value $2,464 less 10% public / private discount ($246) Public market value $2,218 Shares Outstanding 65.3 Fair Value Price $33.99 Current Price $30.16 WACC 9.1% Terminal EBITDA Multiple 15.0 Risk Free Rate 2.5% Beta 1.0 Equity Premium 10.2% Cost of Debt 6.0% Percentage of Capital 50.0% Cost of Equity 12.2% Percentage of Capital 50.0% Valuation Summary Terminal Multiple 11.0 12.0 13.0 14.0 15.0 16.0 17.0 18.0 19.0 Discount Rate 9.1% 9.1% 9.1% 9.1% 9.1% 9.1% 9.1% 9.1% 9.1% Sum of PV of Free Cash Flow $197 $197 $197 $197 $197 $197 $197 $197 $197 PV of Terminal Value $2,130 $2,323 $2,517 $2,710 $2,904 $3,098 $3,291 $3,485 $3,679 Sum of DCFs $2,327 $2,520 $2,714 $2,907 $3,101 $3,295 $3,488 $3,682 $3,875 less net debt $637 $637 $637 $637 $637 $637 $637 $637 $637 Net Equity Value $1,690 $1,883 $2,077 $2,271 $2,464 $2,658 $2,851 $3,045 $3,239 Other/Cash $0 $0 $0 $0 $0 $0 $0 $0 $0 Private market value $1,690 $1,883 $2,077 $2,271 $2,464 $2,658 $2,851 $3,045 $3,239 less 10% public / private discount ($169) ($188) ($208) ($227) ($246) ($266) ($285) ($305) ($324) Public market value $1,521 $1,695 $1,869 $2,044 $2,218 $2,392 $2,566 $2,741 $2,915 Diluted Shares Outstanding 65 65 65 65 65 65 65 65 65 Per Share $23.31 $25.98 $28.65 $31.32 $33.99 $36.66 $39.33 $42.00 $44.67 Enterprise Value $2,158 $2,332 $2,506 $2,680 $2,855 $3,029 $3,203 $3,377 $3,552 EV / 2015E Revenue 5.7x 6.2x 6.7x 7.1x 7.6x 8.0x 8.5x 9.0x 9.4x EV / 2015E EBITDA 11.4x 12.3x 13.2x 14.2x 15.1x 16.0x 16.9x 17.8x 18.8x Source: Company data, Cowen and Company estimates www.cowen.com8 Cowen and Company Equity Research CyrusOne February 19, 2015 Thisreportisintendedforworld-cowen-morningnotesdistribution@cowen.com.Unauthorizedredistributionofthisreportisprohibited.
  • 9. Comparative Analysis – Data Services REITs Dividend Dividend C ompany Ticker Rating Price Mkt C ap EV FFO/Sh Yield Payout Total Debt/ Net Debt/ 2014 2015 2/18/2015 $ MM $ MM C 2015E C 2016E C 2015E C 2016E C 2015E C 2016E C 2015E C 2016E C 2015E C 2016E C 2015E C 2016E C 2015E C 2016E C 2015E (% of AFFO) Total C ap EBITDA YTD Towers American Tower AMT * 1 $96.20 38,662 53,595 4,627 5,086 2,949 3,254 $4.91 $5.55 $5.03 $5.77 18.2x 16.5x 19.6x 17.3x 19.1x 16.7x 12.7% 10.8% 14.6% 10.9% 1.8% 34.0% 79.3% 5.4x 23.8% -2.7% Crown Castle CCI * 1 $88.20 30,352 41,949 3,753 3,849 2,157 2,245 $4.36 $4.56 $4.38 $4.85 19.5x 18.7x 20.2x 19.3x 20.1x 18.2x 1.7% 0.9% 7.2% 4.5% 3.7% 74.9% 67.5% 5.3x 7.2% 12.1% SBA Coms. SBAC * 1 $122.17 15,824 23,757 1,686 1,763 1,108 1,196 $5.61 $6.31 $5.81 $6.55 21.4x 19.9x 21.8x 19.4x 21.0x 18.6x 11.1% 12.1% 22.8% 13.3% NA NA 101.8% 7.8x 23.3% 10.3% Mean 19.7x 18.3x 20.5x 18.7x 20.1x 17.8x 8.5% 7.9% 14.9% 9.6% 2.7% 54.5% 82.9% 6.2x 18.1% 6.6% Median 19.5x 18.7x 20.2x 19.3x 20.1x 18.2x 11.1% 10.8% 14.6% 10.9% 2.7% 54.5% 79.3% 5.4x 23.3% 10.3% REIT Co-lo CoreSite COR * 2 $48.52 2,288 2,711 317 364 156 180 $2.59 $2.94 $2.24 $2.58 17.4x 15.0x 18.7x 16.5x 21.7x 18.8x 16.5% 17.1% 16.8% 26.7% 3.6% 77.8% 49.7% 2.1x 21.3% 24.3% CyrusOne CONE * 1 $30.16 1,968 2,605 377 430 189 216 $2.01 $2.39 $1.94 $2.25 13.8x 12.1x 15.0x 12.6x 15.5x 13.4x 13.8% 11.8% 16.0% 13.6% 4.2% 64.8% 59.4% 3.6x NA 9.5% Digital Realty Trust DLR * 2 $67.58 9,369 15,075 1,656 1,733 969 1,017 $5.03 $5.09 $3.74 $3.86 15.6x 14.8x 13.4x 13.3x 18.1x 17.5x 2.5% 3.5% 1.3% -1.5% 5.0% 89.9% 54.6% 4.7x 35.0% 1.9% Dupont Fabros DFT * 1 $32.06 2,637 3,984 432 482 289 322 $2.51 $2.80 $2.64 $2.94 13.8x 12.4x 12.8x 11.4x 12.2x 10.9x 3.4% 5.1% 4.7% 5.0% 5.3% 64.9% 47.9% 3.5x 34.5% -3.5% Equinix EQIX * 2 $228.91 13,104 16,549 2,638 2,925 1,221 1,361 $11.44 $13.59 $13.36 $15.48 13.5x 12.2x 20.0x 16.8x 17.1x 14.8x 8.4% 9.9% 8.1% -2.0% 1.7% 29.7% 58.0% 3.0x 32.8% 1.0% QTS Realty Trust QTS NR $37.80 1,409 1,995 260 302 120 144 $2.32 $2.67 $2.31 $2.74 16.6x 13.9x 16.3x 14.2x 16.3x 13.8x 20.1% 25.1% 17.0% 16.9% 3.7% 60.9% 60.6% 0.6x NA 11.7% Mean 15.1x 13.4x 16.0x 14.1x 16.8x 14.9x 8.9% 9.5% 9.4% 8.3% 4.0% 65.4% 53.9% 3.4x 30.9% 6.6% Median 14.7x 13.6x 14.2x 12.9x 16.8x 15.5x 8.6% 8.5% 10.4% 9.3% 4.6% 71.3% 52.2% 3.5x 34.5% 5.7% Market Indices S&P 500 .SPX 2,100 1,168 1,159 220 233 NA NA NA NA 10.2x 9.3x NM NM NM NM 4.9% -81.9% NA NA 2.1% NA NA NA 11.4% 2.0% 1 = Outperform, 2 = Market Perform, 3 = Underperform, NR = Not Rated * Cowen covered company BASIC INFORMATION VALUATION 2015E Growth AFFO/ShP/FFOFFOEBITDARevenue BASIC FINANC IALS AFFO Performance EV/EBITDA P/AFFO Leverage (LQA) Sales EBITDA Source: Company data, Thomson One, Cowen and Company estimates www.cowen.com 9 Cowen and Company Equity Research CyrusOne February 19, 2015 Thisreportisintendedforworld-cowen-morningnotesdistribution@cowen.com.Unauthorizedredistributionofthisreportisprohib
  • 10. Valuation Methodology And Risks Valuation Methodology Telecom Services: Our valuation methodology consists of an absolute and relative value approach. We arrive at a fair value utilizing a five-year discounted cash flow (DCF) and when appropriate a segmented sum-of-parts (SOP) analysis. Our relative value approach takes into account EV/EBITDA, P/FCF, and P/E and, when applicable, P/AFFO and dividend yield. Investment Risks Telecom Services: Risks Include: (1) many companies within Telecom Services are highly regulated where a change in rules could lead to unfavorable conditions; (2) rapidly changing/ disruptive technology, new product/service offerings, and evolving industry/technology standards could have an impact on demand and/or pricing; and (3) deterioration in the macro environment both domestically and internationally could lead to a reduction in demand and a consequent impact on valuation multiples. Risks To The Price Target Risks for CyrusOne include: 1) a likely secondary-offering by its largest shareholder may limit near-term upside until its completed, 2) the co-location industry in which CyrusOne operates is competitive with a growing number of competitors, and 3) the data center stocks are particularly susceptible to fluctuations in interest rates in which rising/falling rates may have a negative/positive impact on the stock price. www.cowen.com10 Cowen and Company Equity Research CyrusOne February 19, 2015 Thisreportisintendedforworld-cowen-morningnotesdistribution@cowen.com.Unauthorizedredistributionofthisreportisprohibited.
  • 11. Addendum Analyst Certification Each author of this research report hereby certifies that (i) the views expressed in the research report accurately reflect his or her personal views about any and all of the subject securities or issuers, and (ii) no part of his or her compensation was, is, or will be related, directly or indirectly, to the specific recommendations or views expressed in this report. Important Disclosures This report constitutes a compendium report (covers six or more subject companies). As such, Cowen and Company, LLC chooses to provide specific disclosures for the companies mentioned by reference. To access current disclosures for the all companies in this report, clients should refer to https://cowen.bluematrix.com/sellside/Disclosures.action or contact your Cowen and Company, LLC representative for additional information. Cowen and Company, LLC compensates research analysts for activities and services intended to benefit the firm's investor clients. Individual compensation determinations for research analysts, including the author(s) of this report, are based on a variety of factors, including the overall profitability of the firm and the total revenue derived from all sources, including revenues from investment banking. Cowen and Company, LLC does not compensate research analysts based on specific investment banking transactions. Disclaimer This research is for our clients only. Our research is disseminated primarily electronically and, in some cases, in printed form. Research distributed electronically is available simultaneously to all Cowen and Company, LLC clients. All published research can be obtained on the Firm's client website, https://cowenlibrary.bluematrix.com/client/library.jsp. Further information on any of the above securities may be obtained from our offices. This report is published solely for information purposes, and is not to be construed as an offer to sell or the solicitation of an offer to buy any security in any state where such an offer or solicitation would be illegal. Other than disclosures relating to Cowen and Company, LLC, the information herein is based on sources we believe to be reliable but is not guaranteed by us and does not purport to be a complete statement or summary of the available data. Any opinions expressed herein are statements of our judgment on this date and are subject to change without notice. For important disclosures regarding the companies that are the subject of this research report, please contact Compliance Department, Cowen and Company, LLC, 599 Lexington Avenue, 20th Floor, New York, NY 10022. In addition, the same important disclosures, with the exception of the valuation methods and risks, are available on the Firm's disclosure website at https://cowen.bluematrix.com/sellside/Disclosures.action. Price Targets: Cowen and Company, LLC assigns price targets on all covered companies unless noted otherwise. The price target for an issuer's stock represents the value that the analyst reasonably expects the stock to reach over a performance period of twelve months. The price targets in this report should be considered in the context of all prior published Cowen and Company, LLC research reports (including the disclosures in any such report or on the Firm's disclosure website), which may or may not include price targets, as well as developments relating to the issuer, its industry and the financial markets. For price target valuation methodology and risks associated with the achievement of any given price target, please see the analyst's research report publishing such targets. Notice to UK Investors: This publication is produced by Cowen and Company, LLC which is regulated in the United States by FINRA. It is to be communicated only to persons of a kind described in Articles 19 and 49 of the Financial Services and Markets Act 2000 (Financial Promotion) Order 2005. It must not be further transmitted to any other person without our consent. Copyright, User Agreement and other general information related to this report © 2015 Cowen and Company, LLC. Member NYSE, FINRA and SIPC. All rights reserved. This research report is prepared for the exclusive use of Cowen clients and may not be reproduced, displayed, modified, distributed, transmitted or disclosed, in whole or in part, or in any form or manner, to others outside your organization without the express prior written consent of Cowen. Cowen research reports are distributed simultaneously to all clients eligible to receive such research reports. Any unauthorized use or disclosure is prohibited. Receipt and/or review of this research constitutes your agreement not to reproduce, display, modify, distribute, transmit, or disclose to others outside your organization the contents, opinions, conclusion, or information contained in this report (including any investment recommendations, estimates or price targets). All Cowen trademarks displayed in this report are owned by Cowen and may not be used without its prior written consent. Cowen and Company, LLC. New York (646) 562-1000 Boston (617) 946-3700 San Francisco (415) 646-7200 Chicago (312) 577-2240 Cleveland (440) 331-3531 Atlanta (866) 544-7009 London (affiliate) 44-207-071-7500 COWEN AND COMPANY RATING DEFINITIONS Cowen and Company Rating System effective May 25, 2013 Outperform (1): The stock is expected to achieve a total positive return of at least 15% over the next 12 months Market Perform (2): The stock is expected to have a total return that falls between the parameters of an Outperform and Underperform over the next 12 months Underperform (3): Stock is expected to achieve a total negative return of at least 10% over the next 12 months Assumption: The expected total return calculation includes anticipated dividend yield Cowen and Company Rating System until May 25, 2013 Outperform (1): Stock expected to outperform the S&P 500 Neutral (2): Stock expected to perform in line with the S&P 500 Underperform (3): Stock expected to underperform the S&P 500 Assumptions: Time horizon is 12 months; S&P 500 is flat over forecast period Cowen Securities, formerly known as Dahlman Rose & Company, Rating System until May 25, 2013 Buy – The fundamentals/valuations of the subject company are improving and the investment return is expected to be 5 to 15 percentage points higher than the general market return Sell – The fundamentals/valuations of the subject company are deteriorating and the investment return is expected to be 5 to 15 percentage points lower than the general market return Hold – The fundamentals/valuations of the subject company are neither improving nor deteriorating and the investment return is expected to be in line with the general market return www.cowen.com 11 Cowen and Company Equity Research CyrusOne February 19, 2015 Thisreportisintendedforworld-cowen-morningnotesdistribution@cowen.com.Unauthorizedredistributionofthisreportisprohibited.
  • 12. Cowen And Company Rating Definitions Distribution of Ratings/Investment Banking Services (IB) as of 12/31/14 Rating Count Ratings Distribution  Count IB Services/Past 12 Months Buy (a) 461 60.50%  109 23.64% Hold (b) 288 37.80%  14 4.86% Sell (c) 13 1.71%  0 0.00% (a) Corresponds to "Outperform" rated stocks as defined in Cowen and Company, LLC's rating definitions. (b) Corresponds to "Market Perform" as defined in Cowen and Company, LLC's ratings definitions. (c) Corresponds to "Underperform" as defined in Cowen and Company, LLC's ratings definitions. Note: "Buy", "Hold" and "Sell" are not terms that Cowen and Company, LLC uses in its ratings system and should not be construed as investment options. Rather, these ratings terms are used illustratively to comply with FINRA and NYSE regulations. www.cowen.com12 Cowen and Company Equity Research CyrusOne February 19, 2015 Thisreportisintendedforworld-cowen-morningnotesdistribution@cowen.com.Unauthorizedredistributionofthisreportisprohibited.
  • 13. Points Of Contact Analyst Profiles Colby Synesael New York 646.562.1355 colby.synesael@cowen.com Colby Synesael is a senior analyst covering telecom & data services. He joined Cowen in 2010 and has been on Wall Street since 2001. Jonathan Charbonneau New York 646.562.1356 jonathan.charbonneau@cowen.com Jonathan Charbonneau is an associate covering telecom & data services. He previously worked at Kaufman Bros. and Merriman Curhan Ford. Gregory Williams, CFA New York 646.562.1367 gregory.williams@cowen.com Gregory Williams is an associate covering telecom & data services. He worked a combined twelve years at AT&T, J.P. Morgan and Sidoti & Co. Reaching Cowen Main U.S. Locations New York 599 Lexington Avenue New York, NY 10022 646.562.1000 800.221.5616 Atlanta 3399 Peachtree Road NE Suite 417 Atlanta, GA 30326 866.544.7009 Boston Two International Place Boston, MA 02110 617.946.3700 800.343.7068 Chicago 181 West Madison Street Suite 3135 Chicago, IL 60602 312.577.2240 Cleveland 20006 Detroit Road Suite 100 Rocky River, OH 44116 440.331.3531 San Francisco 555 California Street, 5th Floor San Francisco, CA 94104 415.646.7200 800.858.9316 International Locations Cowen International Limited Cowen and Company (Asia) Limited London 1 Snowden Street - 11th Floor London EC2A 2DQ United Kingdom 44.20.7071.7500 Hong Kong Suite 1401 Henley Building No. 5 Queens Road Central Central, Hong Kong 852 3752 2333 @CowenResearch Cowen and Company www.cowen.com 13 Cowen and Company Equity Research CyrusOne February 19, 2015 Thisreportisintendedforworld-cowen-morningnotesdistribution@cowen.com.Unauthorizedredistributionofthisreportisprohibited.