Argie bond quant track record
•
0 gostou•232 visualizações

Argie Bond Quant is an ARS denominated sovereign fixed income portfolio that is always on the cheap side of the market.

Recomendados
Mais conteúdo relacionado
Mais procurados
Mais procurados (20)
Destaque
Destaque (19)
Semelhante a Argie bond quant track record
Semelhante a Argie bond quant track record (17)
Último
Último (20)
Argie bond quant track record
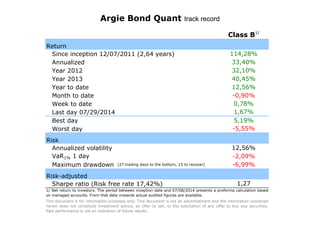
- 1. Return Since inception 12/07/2011 (2,64 years) Annualized Year 2012 Year 2013 Year to date Month to date Week to date Last day 07/29/2014 Best day Worst day Risk Annualized volatility VaR1% 1 day Maximum drawdown (27 trading days to the bottom, 15 to recover) Risk-adjusted Sharpe ratio (Risk free rate 17,42%) Argie Bond Quant track record -2,09% -6,99% 1,67% -0,90% 0,78% 1,27 40,45% 12,56% Class B1/ 114,28% 33,40% 32,10% 5,19% This document is for information purposes only. This document is not an advertisement and the information contained herein does not constitute investment advice, an offer to sell, or the solicitation of any offer to buy any securities. Past performance is not an indication of future results. 12,56% -5,55% 1/ Net return to investors. The period between inception date and 07/08/2014 presents a proforma calculation based on managed accounts. From that date onwards actual audited figures are available.
- 2. Daily data Inception date 12/07/2011 =0,4500 Argie Bond Quant track record The period between inception date and 07/08/2014 presents a proforma calculation based on managed accounts. From that date onwards actual audited figures are available. 0,40 0,50 0,60 0,70 0,80 0,90 1,00 1,10 D ____ E 2012 F M A M J J A S O N D E 2013 F M A M J J A S O N D E 2014 F M A M J J Maximum drawdown Recovery Argie Bond Quant
- 3. J F M A M J J* A S O N D Year 2011 2,60% 2,60% 2012 3,92% 3,05% 2,58% 0,50% -2,11% 4,23% 4,55% 0,94% 4,05% -1,45% 2,48% 5,75% 32,10% 2013 5,71% -3,57% 6,81% 6,16% -2,54% -0,68% 5,78% 2,26% 7,55% 8,06% -1,13% 1,01% 40,45% 2014 8,43% 1,41% 0,61% 0,90% 2,67% -0,90% -0,90% 12,56% * as of 07/29/2014 Argie Bond Quant track record