Tax Day Charts 2015
•
46 gostaram•9,487 visualizações

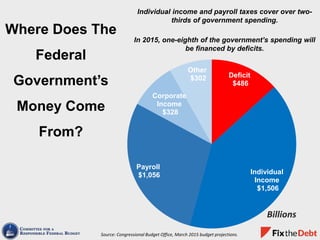
Individual income and payroll taxes cover over two-thirds of government spending. In 2015, one-eighth of the government’s spending will be financed by deficits. The top 20% of households pay almost 70% of the nation’s taxes, with the top 1% paying nearly a quarter. Tax expenditures have grown over time and now equal over a quarter of total government spending.

Recomendados
Mais conteúdo relacionado
Mais procurados
Mais procurados (18)
Destaque
Destaque (20)
Semelhante a Tax Day Charts 2015
Semelhante a Tax Day Charts 2015 (20)
Mais de Fix the Debt Campaign
Mais de Fix the Debt Campaign (20)
Último
Último (20)
Tax Day Charts 2015
- 1. Individual income and payroll taxes cover over two- thirds of government spending. In 2015, one-eighth of the government’s spending will be financed by deficits. Where Does The Federal Government’s Money Come From? Source: Congressional Budget Office, March 2015 budget projections. Deficit $486 Individual Income $1,506 Payroll $1,056 Corporate Income $328 Other $302 Billions
- 2. Income Tax Rates 0% 5% 10% 15% 20% 25% 30% 35% 40% 0 $50k $100k $150k $200k $250k $300k $350k $400k $450k $500k Gross Income Marginal Rate Average Rate (Tax rates in 2014 for a married couple filing jointly)
- 3. Who Pays Federal Taxes? Source: Congressional Budget Office, “The Distribution of Household Income and Federal Taxes, 2011.” Bottom 20% 0.6% Second 20% 4% Middle 20% 9% Fourth 20% 18% 81st to 99th Percentiles 45% Top 1% 24% The top 20% of households pay almost 70% of the nation’s taxes. The top 1% is responsible for paying nearly a quarter. (Percentage of all federal taxes paid, by household income)
- 4. 10% 12% 14% 16% 18% 20% 22% 24% 26% 1990 1995 2000 2005 2010 2015 2020 2025 Revenues Don’t Cover Spending Source: Congressional Budget Office, March 2015 budget projections. Percent of the economy (GDP) Actual Projected 20.2%SPENDING AVERAGE 17.2%REVENUES AVERAGE Deficit
- 5. $0 $200 $400 $600 $800 $1,000 $1,200 $1,400 $1,600 1974 1978 1982 1986 1990 1994 1998 2002 2006 2010 2014 2018 Tax Breaks Have Grown Over Time Actual Projected Source: U.S. Department of the Treasury, compiled by the National Priorities Project. Inflation-adjusted dollars Tax Reform Act of 1986 There is now twice as much money in “tax expenditures” – deductions, credits, and other tax breaks – as there was after Congress last overhauled the tax code in 1986.
- 6. Source: Congressional Budget Office, Joint Committee on Taxation Tax Expenditures: Another Kind of Spending Tax Expenditures aren’t part of the budget that Congress passes every year, but are similar to government spending programs. Think about it: $1,000 given out in Pell grants and $1,000 given out through education tax credits will both give $1,000 to students. If they were counted as a normal part of the budget, tax expenditures would be over a quarter of spending. Tax Expenditures 26% Social Security 18% Health Care 19% Defense 13% Non-Defense Discretionary 12% Interest 5% Other, 7%
- 7. High Earners Benefit Most From Tax Expenditures Most tax expenditures are regressive and provide a bigger benefit to the wealthy. The top 20% receives 50% of the benefit from the largest tax expenditures. Percent of “major” tax expenditures received 0% 10% 20% 30% 40% 50% 60% Lowest Quintile Second Quintile Middle Quintile Fourth Quintile Highest Quintile Top 1% Source: Congressional Budget Office, “The Distribution of Major Tax Expenditures in the Individual Income Tax System.” Note: Graph shows ten “major” income tax expenditures as identified by Congressional Budget Office, which make up two-thirds of total tax expenditures by dollar amount.
- 8. Tax Expenditures Rival Spending Programs in Size *Spending represented by HUD Budget. Source: Office of Management and Budget, President’s Budget FY 2016; Joint Committee on Taxation **Spending represented by Pell Grants. Source: Joint Committee on Taxation *** Refundable credits include EITC and Child Tax Credit. Spending includes SSI,TANF, and Foster Care Assistance. Source: HHS, SSA $0 $20 $40 $60 $80 $100 $120 $140 Housing* Education** Income Support*** Tax Expenditures Program Spending Billions, FY2014
- 9. U.S. Has World’s Highest Corporate Tax Rate, but Only Average Collection The official U.S. corporate tax rate is the highest in the developed world, but the average rate paid after deductions and credits is more typical. Source: U.S. Department of the Treasury, “The President’s Framework for Business Tax Reform.” Data from Fiscal Year 2011. 0% 5% 10% 15% 20% 25% 30% 35% 40% 45% United States UK Italy Canada Germany France MarginalCorporateTaxRate Statutory Rate Effective Rate
- 10. The Tax Reform Act of 2014 would have increased the size of the economy by between 0.1 percent and 1.6 percent by 2023. Tax Reform Promotes Economic Growth 0.0% 0.2% 0.4% 0.6% 0.8% 1.0% 1.2% 1.4% 1.6% 1.8% MEG Model, Low Change In Employment MEG Model, High Change In Employment OLG Model Low Estimate High Estimate Source: Joint Committee on Taxation
- 11. Where Tax Dollars Went In 2014 Share of Each $100 Paid in Taxes Social Security $24.11 Health $23.72 Medicare $14.42 Medicaid $8.60 Other Health $0.69 Defense and Military Benefits $21.49 Interest $6.54 Civilian Federal Retirement $2.86 Transportation $2.62 Refundable Credits $2.45 Food Stamps $2.18 Education $1.84 Supplemental Security Income $1.54 Justice $1.44 Housing Assistance $1.36 Unemployment Insurance $1.26 Natural Resource Protection $1.03 Foreign Aid $1.00 Agriculture $0.70 Other $3.87 Total $100