Osisko Gold Royalties Ltd - Corporate Presentation, April 10, 2024
Executive summary 1Q14
1. IR Department e: ir@ferrovial.com - +34 915862730 1
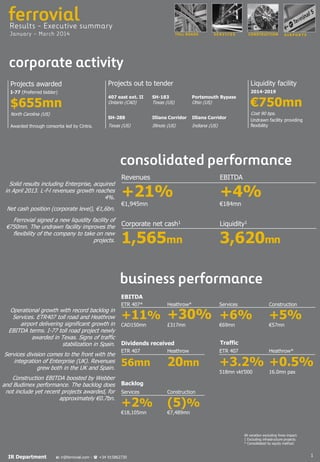
Projects awarded
I-77 (Preferred bidder)
$655mn
North Carolina (US)
Awarded through consortia led by Cintra.
A I R P O R T SCONSTRUCTIONS E R V I C E STOLL ROADS
Dividends received
ETR 407
56mn
Heathrow
20mn
Backlog
ETR 407*
+11%
CAD150mn
Services
+6%
€69mn
Heathrow*
+30%
£317mn
Construction
+5%
€57mn
EBITDA
Revenues
+21%
€1,945mn
EBITDA
+4%
€184mn
Corporate net cash1
1,565mn
Operational growth with record backlog in
Services. ETR407 toll road and Heathrow
airport delivering significant growth in
EBITDA terms. I-77 toll road project newly
awarded in Texas. Signs of traffic
stabilization in Spain.
Services division comes to the front with the
integration of Enterprise (UK). Revenues
grew both in the UK and Spain.
Construction EBITDA boosted by Webber
and Budimex performance. The backlog does
not include yet recent projects awarded, for
approximately €0.7bn.
Solid results including Enterprise, acquired
in April 2013. L-f-l revenues growth reaches
4%.
Net cash position (corporate level), €1,6bn.
Ferrovial signed a new liquidity facility of
€750mn. The undrawn facility improves the
flexibility of the company to take on new
projects.
Liquidity1
3,620mn
Traffic
ETR 407
+3.2%
518mn vkt’000
Heathrow*
+0.5%
16.0mn pax
All variation excluding forex impact.
1 Excluding infrastructure projects.
* Consolidated by equity method.
Services
+2%
€18,105mn
Construction
(5)%
€7,489mn
Projects out to tender
407 east ext. II SH-183 Portsmouth Bypass
Ontario (CAD) Texas (US) Ohio (US)
SH-288 Illiana Corridor Illiana Corridor
Texas (US) Illinois (US) Indiana (US)
Liquidity facility
2014-2019
€750mn
Cost 90 bps.
Undrawn facility providing
flexibility
2. 2
Enterprise acquisition is progressing as expected, with the
necessary actions to achieve synergies in procurement and
supply areas, plus cross-selling between activities.
Revenues
+45.7%
1,033mn
Spain.- Growth in revenues
supported by new contracts. Lower
margins in EBITDA due to costs
related with start up contracts &
integration. Profitability expected to
increase through the year.
EBITDA
+6.1%
69mn/6.7%
UK.- Figures reflect the Enterprise
acquisition (April ‘13). The drop in
profitability is due to lower margins
in Enterprise, expected to increase
trough the year.
Backlog
+1.5%
18,105mn
International.- This division
includes Chile (10mn), Portugal (5mn)
and Poland (2mn).
P&L affected by a provision reversal in 2013 (€7mn).
Excluding this impact, performance would be positive.
Slight improvement in European traffic, although affected
by the Easter timing (April ´14 vs March´13).
Revenues
(5.3)%
91mn
EBITDA
(2.1)%
55mn/60.3%
Positive performance due to the tariff increase and higher
passengers traffic volume.
EBITDA 2014 will be affected by the increase in operating
costs related to the opening of Terminal 2 (June´14).
Revenues
+10.4%
£614mn
EBITDA
+28.0%
£319mn/51.9%
Chicago Skyway
Stake 55%
(5.2)%
32,514
1.1mn
Indiana*
Stake 50%
(3.1)%
21,917
+2.4%
34mn
2.8mn
Ausol **
Stake 80%
(0.4)%
11,867
(5.8)%
7mn
0.4mn
M4
Stake 66%
+4.2%
24,177
+4.4%
5mn
0.1mn
407ETR*
Stake 43%
+3.2%
518mn VKT
+11.2%
122mn
3.8mn
Traffic Revenues EBITDA Net debt
Ferrovial controls 25% of HAH
Consolidated by equity method
Debt
6.8bn
Others
Heathrow +0.5%
16mn
+10.5%
576mn
Traffic Revenues EBITDA
+30.3%
317mn/55.0%
+6.2%
2.5mn
+6.2%
39mn
+16.4%
9mn/24.2%
(2.7)%
12mn
0.9%
24mn/70.1%
(3.7)%
5mn/73.5%
+6.0%
4mn/69.7%
+11.0%
99mn/81.1%
(4.2)%
10mn/83.5%
INVESTOR RELATIONS DEPARTMENT
C/ Príncipe de Vergara, 135 - 28002 MADRID (Spain) Tlf: +34 91 586 27 30 Fax: +34 91 586 28 69
e-mail: ir@ferrovial.es website: www.ferrovial.com
Debt
£12.8bn
RAB £14.9bn
* Consolidated by equity method
** Ausol II traffic
EBITDA growth thanks to better margins at Budimex and
Webber. Backlog does not include recently awarded
projects (I-77 North Carolina, power plant in Poland and a
highway in Australia).
Poland
Budimex.- High level of
contracting activity, based on new
polish government road plan 2014-
2020.
Revenues
0.7%
795mn
US
Webber.-Performance affected
by weather conditions, besides the
lower activity in NTE and LBJ, which
are almost completed.
EBITDA
+4.7%
57mn/7.1%
Backlog
(4.7)%
7,489mn
RoW
F. Agroman.- Important
number of new works contracted
after the end of the quarter, around
€0.9bn. Those new contracts provide
visibility on future growth.
+81.8%
640mn
+49.7%
17mn
(13.8)%
0.4mn/2.1%
+8.8%
375mn
(17.9)%
39mn/10.3%
Revenues EBITDA Backlog
+58.8%
30mn/4.7%
(1.4)%
228mn
(1.1)%
6,264mn
+3.0%
11,613mn
Revenues EBITDA Backlog
(8.9)%
138mn
+25.1%
8mn/6.1%
(10.0)%
986mn
+3.2%
485mn
(0.6)%
41mn/8.5%
(5.4)%
5,413mn
+2.4%
172mn
+18.3%
7mn/4.0%
+4.6%
1,090mn
New regulatory period (Q6) started on 1st April 2014 until
31th December 2018. Maximum allowable yield per
passenger will be RPI minus 1.5%.
2014 tariff increase has been deferred from April to July.
3. Fixed
Assets
17.3bn
Current
Assets
5.6bn
22.9bn
Total
Equity
6.0bn
Non current
Liabilities & others
12.0bn
Current
Liabilities
4.9bn
Gross cash 2.7bn
total
1.6bn
Gross debt 1.1bn
Corporate (1.6)bn
Projects 7.1bn
corporate
53mn
2014
38mn
2015
20mn
2016
11mn
2017
Total cash
2.7bn
Total liquidity 3.6bn
Undrawn lines
0.9bn
1.0bn
2018+
Strong balance sheet and high liquidity position to
face future opportunities.
At the end of March´14, Ferrovial’s net cash
position, excluding infrastructure projects,
amounted to EUR1,565mn.
Standard & Poor’s
BBB / stable
Fitch
BBB- / stable
IR Department e: ir@ferrovial.com - +34 915862730 3
86%
Bonds
4. 4
Women in the company
28,2%
Women in management positions
14%
Spain
55%
America
7%
UK
28%
Poland
6%
RoW
4%
Employees worldwide
66,088
2013
52mn
Investment
In infrastructure &
technologies to reduce
environment impact
2010 - 2013
Lower energy
consumption
2010 2011 2012 2013
311
270
6,900
6,200
2009 - 2013
-31.9%
Reduction of
carbon footprint
Power supply
(,000 Mvh)
-11.6%
Fuels
(,000 Gj)
-8.7%
Risk management
and environment
responsibility
Management of
new business
oportunities
PrioritiesThe combination of talent and commitment made by
Ferrovial’s professionals is one of the pillars of its success
and future sustainability. Professional development,
transversal management of talent and the increasing
internationalisation are among the company’s strategic
priorities, in an environment that guarantees equal
opportunities on the basis of merit.
INVESTOR RELATIONS DEPARTMENT
C/ Príncipe de Vergara, 135 - 28002 MADRID (Spain)
Tlf: +34 91 586 27 30 Fax: +34 91 586 28 69
e-mail: ir@ferrovial.es website: www.ferrovial.com
2013: balanced contribution between fix,
variable and long term incentives:
Metrics of The Long Term Incentive Grant 2013 are a mix of: EBITDA / Net Productive Asset , Cash Flow , TSR *
in comparison with 16 international listed companies:
*ACS, OHL, FCC, Abertis, Paris CdG, Fraport, Serco, Carilion, Bilfinger Berger, Vinci, Strabag, Eiffage, Balfour Beatty, Transurban, SNC Lavalin.
22%
Fix
39%
Variable
39%
Long Term
incentives
2010 Grant
Ferrovial compares with IBEX35 and is in the
average compensation of that group.
Euros
0 200,000 400,000
Percentile
75
0-25%il
25-50%il
50-75%il
75-90%il
Percentile
25
Percentile
90
Mean
Media
Board remuneration non executive
President & CEO remuneration
Source: Towers Watson