Gold appears to be nearing the projected top of an Elliott wave triangle pattern near $1,100 based on technical analysis of price movements and contracting waves. Implied volatility in gold has not risen as expected with the recent price increases, suggesting waning speculation, which is a signal that the top may be near. The analysis provides several limited risk trades to profit from a potential price drop to $955 or further increases, including buying puts, a straddle, or calls with risk management protections.
Beginners Guide to TikTok for Search - Rachel Pearson - We are Tilt __ Bright...
Outlook on Gold - Nov. 4, 2009
1. Volatility Research & Trading
Research@vVolatility.com
04 November 2009
Volume 1, Issue 4
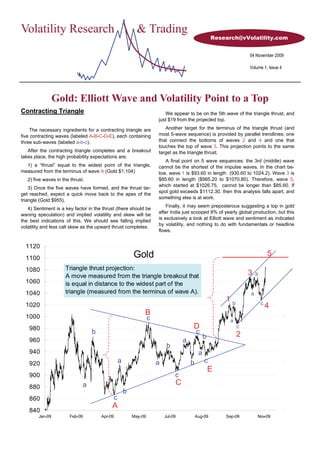
Gold: Elliott Wave and Volatility Point to a Top
Contracting Triangle We appear to be on the 5th wave of the triangle thrust, and
just $19 from the projected top.
The necessary ingredients for a contracting triangle are Another target for the terminus of the triangle thrust (and
five contracting waves (labeled A-B-C-D-E), each containing most 5-wave sequence) is provided by parallel trendlines; one
three sub-waves (labeled a-b-c). that connect the bottoms of waves 2 and 4 and one that
touches the top of wave 3. This projection points to the same
After the contracting triangle completes and a breakout target as the triangle thrust.
takes place, the high probability expectations are;
A final point on 5 wave sequences: the 3rd (middle) wave
1) a “thrust” equal to the widest point of the triangle, cannot be the shortest of the impulse waves. In the chart be-
measured from the terminus of wave A (Gold $1,104) low, wave 1 is $93.60 in length (930.60 to 1024.2). Wave 3 is
2) five waves in the thrust. $85.60 in length ($985.20 to $1070.80). Therefore, wave 5,
which started at $1026.75, cannot be longer than $85.60. If
3) Once the five waves have formed, and the thrust tar-
spot gold exceeds $1112.30, then this analysis falls apart, and
get reached, expect a quick move back to the apex of the
something else is at work.
triangle (Gold $955).
Finally, it may seem preposterous suggesting a top in gold
4) Sentiment is a key factor in the thrust (there should be
after India just scooped 8% of yearly global production, but this
waning speculation) and implied volatility and skew will be
is exclusively a look at Elliott wave and sentiment as indicated
the best indications of this. We should see falling implied
by volatility, and nothing to do with fundamentals or headline
volatility and less call skew as the upward thrust completes.
flows.
1120
1100 Gold 5
1080 Triangle thrust projection: 11
A move measured from the triangle breakout that 3 b
1060 is equal in distance to the widest part of the
1040 triangle (measured from the terminus of wave A). a
1b c
1020 4
1000
B 9
c a
980 D c
b c 2
b
960 a
b
940 a
920 a a b c 7
E
900 c
a C
880
b
860 c
A
840 5
Jan-09 Feb-09 Apr-09 May-09 Jul-09 Aug-09 Sep-09 Nov-09
2. Implied Volatility is unimpressed with higher Gold
The break of the triangle
1120 5 was initially met with excite-
1100 Gold
ment, renewed gold fever and
1080 3 11 a spectacularly fast jump in
b
1060 one-month implied volatility
1040 1 a
from 16% to 26%. Implied
1020 B
b c
4 volatility was cheap and had
1000 c a 9 been relatively motionless for
D c
980 b c 2 the previous two months, so a
b
960 a move of that extent was not
b
940 a entirely unexpected.
920 a a b c 7
E What did seem a bit odd,
900 c
a C was the speed with which 1m
880 b vol fell back to 17% once the
860 c
A spot advance paused.
840 5
Jan-09 Feb-09 Apr-09 May-09 Jul-09 Aug-09 Sep-09 Nov-09 On the next jump in gold
(wave 3 on the top chart), im-
1120 45 plied volatility rose again, but
was unable to surmount the
1100 43 wave 1 high.
1080 41
The current gold rise has
1060 39 produced an even more pa-
1040 37 thetic volatility response. 1m
1020 35 vol is languishing below 19%,
a full 7% less than it attained
1000 33 after the initial triangle break.
1y Implied Vol
980 31
One-year implied vol is also
960 29 unable to exceed recent highs
940 27 as gold propels higher. 1y vol
920 25 has been overvalued by at
least 10% for a long time now,
900 23
1m Implied Vol so the muted vol response is
880 21 less of a surprise than the 1
860 19 month stupor.
840 17 The lower chart shows 1m
820 15 and 1y 25 delta risk reversals
Jan-09 Feb-09 Apr-09 May-09 Jul-09 Aug-09 Sep-09 Nov-09 (25d call vol - 25d put vol). The
1m RR managed to reach
1120 12 3.5% on the wave 1 and 3 ad-
vances, but has dropped below
1100 11 2% on the current gold rise.
1y 25d Risk Reversal
1080 10 This is a clear example of a
lack of participation by the
1060 9 speculative community.
1040 8 The 1y RR is more reflec-
tive of real (long-term) gold
1020 7
demand, and is at silly levels to
1000 6 begin with. With implied vol
falling as gold rallies, the RR
980 5 should be on a fast track to
960 4 zero.
1m 25d Risk Reversal
940 3 There must be a level
where both specs and long-
920 2 term security seekers re-enter
the market via gold calls, but
900 1
that level is likely significantly
880 0 higher (beyond the triangle
Jan-09 Feb-09 Apr-09 May-09 Jul-09 Aug-09 Sep-09 Nov-09 thrust projection top?).
Volume 1, Issue 4 Page 2
3. One-year Implied Volatility is expensive; One-month vol is fair.
The premium of one-year implied volatility
1120 46
over one-year realized volatility remains
1100
extreme. (realized vol is exponentially 44
1080 weighted using hourly data). 42 1y Implied vol
1060
1040 40 has been consis-
tently overvalued
1020 38 since Dec 08.
1000
36 It fell 20% from
980
the March 09 44%
960 34
top, but has further
940 32 to go.
920
900 Gold 30 Who buys this
stuff at a negative
28
880 edge of 10% to
860 26 15%?
840 24 At some point I
820 1 yr Implied Vol would expect a
22 degree of capitula-
800
10.9% 20 tion from the 1y vol
780
buyers.
760 1 yr Realized Vol 18
740
16
720
700 14
680 12
Oct-08 Dec-08 Jan-09 Mar-09 Apr-09 May-09 Jul-09 Aug-09 Sep-09
While one-year implied vol is extremely expensive, one-month 60 1m Implied vol
implied vol is fairly valued. The recent jumps in 1m vol were displays the volatile
1080 58
unsupported by realized volatility, but any move back to 16-17% nature of specula-
56
1055 tors.
appears to offer reasonably-priced gamma for the next gold move. 54
1030 52 While realized
50 vol was first stead-
1005 ily lower, and then
980
Gold 48
consistently side-
46
ways, the jumpi-
955 44
ness of implied vol
42
930 shows the desire of
40 specs to hop on
905 38 breakouts.
36
880 At these levels,
34
1m vol is a safe buy
855 32
when it trades at or
30
830 below weighted
1m Implied Vol 28
realized vol.
805 26
780 24
22
755 20
730 18
16
705
14
1m Realized Vol
680 12
Oct-08 Dec-08 Jan-09 Mar-09 Apr-09 May-09 Jul-09 Aug-09 Sep-09
Page 3 Volatility Research & Trading
4. Limited Loss Trades to play a
top at $1,100 and a dip to $955
Trade Ideas: affected by skew) costs 10% of payout. Odds are therefore
Implied Vol is reasonable in the front end of the curve and 9:1. For every $10 you bet, $100 is received if $955 touches.
rich in the back end, so any strategy should incorporate either
front end purchases, back end sales, or both. Trade 3: Buy a 1.5 month ATM straddle
Skew is extreme for calls in the one year, so that favours
selling low delta calls and buying low delta puts. But since the
absolute level of 1y vol is high, we are left with just 1y call An idea with much less leverage, but a greater chance of
selling. turning a profit is a simple purchase of an at-the-money
straddle, again for the 18 Dec 09 date. With implied volatility
Skew is moderate for the one-month, so buying puts is at 20.5%, an atm straddle costs $57. Breakeven is $57 either
reasonable (they are cheaper than calls. Avoid selling gamma side of spot, so if our $955 target comes to pass the profit
(Gold calls), since we want to make a bit of money if correct (on expiration) would be 1.55 times premium. If India has
in our analysis, not lose our jobs if wrong. several more tones of gold to buy, or if all fiat currencies sud-
One month is a bit too short, and two months is too long, denly disappear, the topside profit potential could also be
so we’ll settle on 18 Dec (46 days) for option expiries. attractive.
Trade 1: Buy a 1.5 month 30 delta put Trade 4: Buy a 1y Gold call with a $1,300 RKO (for the
With Gold at 1,100, and 46 day 30 delta puts at 20% vol, tempered bulls).
the cost of buying an 18 Dec 09 $1,065 Put would be $14.70.
Our target is $955 (triangle apex), so if correct we would To sell both high 1y skew and high 1y implied volatility, a
make a net gain of $95.30, or 6.5 times premium. If wrong, 1y $1,100 Gold call (off a spot of $1,100) with a reverse
we would lose $14.70. knockout at $1,300 costs a mere $10. The premium rises to
Trade 2: Buy a 1.5 month $955 one-touch $20 if the knockout is pushed higher to $1,400. The risk in
these trades is a Gold rises beyond the topside barrier. You
would lose the premium despite calling the direction cor-
A $955 one-touch (American style—look any time) also rectly.
based off a $1,100 spot and 19.5% vol (lower than the previ-
ous trade because it is a lower delta and is therefore more
Ma
nag
e th
eD
own
sid
e...
Please direct any enquiries or feedback to:
Research@vVolatility.com
Page 4 Volatility Research & Trading
Disclaimer: This document researches assets from primarily a volatility perspective. No forecasts made or implied in this analysis should be used as a basis for
assuming, increasing or reducing risk of any sort. The opinions expressed in this publication are those of the author, and are subject to frequent and dramatic
change as new information is introduced. This document is for entertainment purposes only.