Brown school is situated on Avenue Road just south of St. Clair Avenue. The first school was built in 1910 and was replaced with a new building in 1972. Brown is celebrating its 100th anniversary in 2010. This is a special year for our school celebrating 100 years of excellence. For a century, Brown School has had a tradition of strong academic achievement and close relationships with our families and community. Our staff is a team of dedicated teachers and support staff who bring unique talents to our classrooms, along with many co-curricular activies. Each child is encouraged to strive for academic excellence while also adding balance to the day by pursuing an interest or talent from an extensive number of activities that are offered.
EQAO ensures greater accountability and better quality in Ontario’s publicly funded school system. An arm’s-length agency of the provincial government, EQAO provides parents, teachers and the public with accurate and reliable information about student achievement. EQAO also makes recommendations for improvement that educators, parents, policy-makers and others in the education community can use to improve learning and teaching.
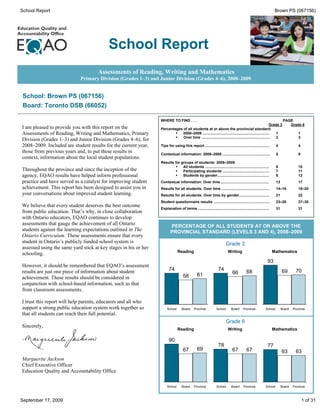
1. School Report Brown PS (067156)
School Report
Assessments of Reading, Writing and Mathematics
Primary Division (Grades 1–3) and Junior Division (Grades 4–6), 2008–2009
School: Brown PS (067156)
Board: Toronto DSB (66052)
WHERE TO FIND . . . PAGE
Grade 3 Grade 6
I am pleased to provide you with this report on the Percentages of all students at or above the provincial standard:
Assessments of Reading, Writing and Mathematics, Primary · 2008–2009 .................................................................. 1 1
· Over time .................................................................... 2 3
Division (Grades 1–3) and Junior Division (Grades 4–6), for
2008–2009. Included are student results for the current year, Tips for using this report ................................................................ 4 4
those from previous years and, to put these results in Contextual information: 2008–2009 ............................................... 5 9
context, information about the local student populations.
Results for groups of students: 2008–2009
· All students ............................................................... 6 10
Throughout the province and since the inception of the · Participating students .............................................. 7 11
agency, EQAO results have helped inform professional · Students by gender................................................... 8 12
practice and have served as a catalyst for improving student Contextual information: Over time ............................................... 13 17
achievement. This report has been designed to assist you in Results for all students: Over time ............................................... 14–16 18–20
your conversations about improved student learning. Results for all students: Over time by gender.............................. 21 22
Student questionnaire results ....................................................... 23–26 27–30
We believe that every student deserves the best outcome
Explanation of terms ...................................................................... 31 31
from public education. That’s why, in close collaboration
with Ontario educators, EQAO continues to develop
assessments that gauge the achievement of all Ontario
PERCENTAGE OF ALL STUDENTS AT OR ABOVE THE
students against the learning expectations outlined in The PROVINCIAL STANDARD (LEVELS 3 AND 4), 2008–2009
Ontario Curriculum. These assessments ensure that every
student in Ontario’s publicly funded school system is Grade 3
assessed using the same yard stick at key stages in his or her
Reading Writing Mathematics
schooling.
93
However, it should be remembered that EQAO’s assessment
results are just one piece of information about student 74 74 68 69 70
61 66
achievement. These results should be considered in 58
conjunction with school-based information, such as that
from classroom assessments.
I trust this report will help parents, educators and all who
support a strong public education system work together so School Board Province School Board Province School Board Province
that all students can reach their full potential.
Grade 6
Sincerely,
Reading Writing Mathematics
90
78 77
67 69 67 67 63 63
Marguerite Jackson
Chief Executive Officer
Education Quality and Accountability Office
School Board Province School Board Province School Board Province
September 17, 2009 1 of 31
2. School Report Brown PS (067156)
RESULTS FOR ALL STUDENTS AT OR ABOVE THE PROVINCIAL STANDARD (LEVELS 3 AND 4) OVER TIME
Percentage of Students: Grade 3
Reading Writing Mathematics
93
80 80 84
76 78 79
74 74
64 64
54 57 58
53
SCHOOL
66 65 66 66 67 69
61 64 64 64
56 59 57 57 58
BOARD
66 68 66 68 69 68 70
62 62 61 61 61 64 64
59
PROVINCE
2004–2005 2005–2006 2006–2007 2007–2008 2008–2009
Total Number of Grade 3 Students
2004–2005 2005–2006 2006–2007 2007–2008 2008–2009
School 83 73 77 76 69
Board 19 094 18 401 17 813 17 210 17 392
Province 135 740 132 782 131 012 128 660 125 481
September 17, 2009 2 of 31
3. School Report Brown PS (067156)
RESULTS FOR ALL STUDENTS AT OR ABOVE THE PROVINCIAL STANDARD (LEVELS 3 AND 4) OVER TIME
Percentage of Students: Grade 6
Reading Writing Mathematics
88 90 87 88
84 81 80 80
75 79 78 77 77
72 68
SCHOOL
63 63 67 66 67 63
61 61 59 61 61 62 60 59 60
BOARD
66 69 67 67
63 64 64 61 61 60 61 61 63
59 59
PROVINCE
2004–2005 2005–2006 2006-2007 2007-2008 2008-2009
Total Number of Grade 6 Students
2004–2005 2005–2006 2006–2007 2007–2008 2008–2009
School 61 72 69 69 60
Board 18 492 19 238 19 086 18 355 17 552
Province 143 421 146 711 145 901 140 420 136 076
September 17, 2009 3 of 31
4. School Report Brown PS (067156)
TIPS ABOUT THIS SCHOOL OR BOARD REPORT
Each school or board is This report shows how well students have met curriculum expectations to the end of the
unique. To appreciate the Primary Division and the end of the Junior Division. Students complete a set of test
distinctive character of a booklets that allow them to show what they have learned in reading, writing and
school or board, look at the mathematics. The assessments are based on The Ontario Curriculum.
contextual information to
understand the features and
characteristics of the This report includes
community it serves. ¨ results for this year
– ¨ a comparison of results over the past four years to aid in monitoring
improvement
Every assessment captures ¨ information about the characteristics of the students who participated
the performance of students
at one point in time each ¨ summary graphs showing the percentage of students achieving the provincial
year. Consider the results standard in reading, writing and mathematics
along with other information ¨ detailed tables and graphs showing results for all levels of achievement, results
about students’ achievement
in reading, writing and
for gender and participation information
mathematics. ¨ student questionnaire results
¨ an explanation of all terms used in this report.
–
Exercise caution when
interpreting results for small HOW TO USE THIS REPORT
schools or boards. Results
may vary considerably from ¨ Examine the contextual information to understand the similarities and differences
year to year, and differences between the school, the board and the province; the board and the province.
may look exaggerated. For Consider the challenges that any differences might present.
example, in a school of 20
students, a difference of 10% ¨ Examine the results for reading, writing and mathematics.
represents only two students. · Are these results consistent with what you would expect?
· How do the school results compare to the board and the province; the board
– results compare to the province?
· How do these results compare over time?
Trends may be difficult to
identify or to interpret. This is · What influence might students’ attitudes have on student performance (refer
especially true in small
schools or boards, or in to the questionnaire results)?
schools where there is a high ¨ Speak to school or board staff about the goals for school improvement related to
turnover in the student reading, writing and mathematics.
population.
–
EQAO values students’
privacy. Results are not
reported publicly for schools
where fewer than 15
students participated,
because it might be possible The Education Quality and Accountability Office is an independent agency that gathers information
to identify individual about student achievement through province-wide assessments. Each year, all Grade 3 and Grade 6
students across Ontario take part in these assessments of reading, writing and mathematics.
students. Individual results are reported to students and to parents and guardians. School, board and provincial
results are released publicly.
Learn more about us at www.eqao.com.
September 17, 2009 4 of 31
5. School Report Brown PS (067156)
Assessments of Reading, Writing and Mathematics, Primary and Junior Divisions, 2008–2009
Contextual Information: Grade 3*
This information provides a context for interpreting the school’s results.
Demographic Information School Board Province
Enrolment
Number of Grade 3 students 69 17 392 125 481
Number of classes with Grade 3 students 4 1 578 9 385
Number of schools with Grade 3 classes Not applicable 400 3 399
Number Percent Number Percent Number Percent
Gender
Female 26 38% 8 453 49% 60 999 49%
Male 43 62% 8 939 51% 64 482 51%
Gender not specified 0 0% 0 0% 0 0%
Student Status
English language learners** 0 0% 670 4% 11 281 9%
Students with special needs (excluding gifted)** 6 9% 3 193 18% 18 291 15%
Place of Birth
Born in Canada 57 83% 13 419 77% 111 561 89%
Born outside Canada 12 17% 3 959 23% 13 717 11%
In Canada less than one year 0 0% 152 1% 804 1%
In Canada one year or more but less than three years 0 0% 835 5% 2 893 2%
In Canada three years or more 9 13% 2 403 14% 8 946 7%
Language
First language learned at home was other than English 14 20% 8 230 47% 27 084 22%
Year Student Entered Current School
Year of the assessment 6 9% 2 274 13% 16 746 13%
Year prior to the assessment 3 4% 2 174 12% 14 545 12%
2 years prior to the assessment 10 14% 2 289 13% 16 821 13%
3 or more years prior to the assessment 50 72% 10 607 61% 76 849 61%
Data not available 0 0% 48 <1% 520 <1%
Year Student Entered Current Board
Year of the assessment 3 4% 1 140 7% 8 720 7%
Year prior to the assessment 1 1% 1 193 7% 8 048 6%
2 years prior to the assessment 9 13% 1 480 9% 11 982 10%
3 or more years prior to the assessment 56 81% 13 467 77% 93 098 74%
Data not available 0 0% 112 1% 3 633 3%
* Contextual data pertaining to gender, student status, place of birth, language learned at home and year entered school and board are provided by schools and/or boards
through the Student Data Collection process. Some data may be missing because they were not provided by the school or the board.
** See the Explanation of Terms.
September 17, 2009 5 of 31
6. School Report Brown PS (067156)
Results in Reading, Writing and Mathematics, 2008–2009
Grade 3: All Students††
Grade 3: Reading* Percentage of All Grade 3 Students at All Levels: Reading*
School Board Province
Number of Students 31 16 062 121 787
# % % %
Level 4 7 23% 8% 7%
Level 3 16 52% 50% 53%
Level 2 5 16% 24% 26% 52 50 53
Level 1 1 3% 8% 7%
NE1** 0 0% 2% 2% 24 26 23
Participating 16
29 94% 92% 95% 8 7 8 7
Students 0 2 2 3
No Data 0 0% 2% 1%
NE1 Level 1 Level 2 Level 3 Level 4
Exempt 2 6% 6% 4%
At or Above School Board Province
Provincial Standard 74% 58% 61%
(Levels 3 and 4) †
Grade 3: Writing* Percentage of All Grade 3 Students at All Levels: Writing*
School Board Province
Number of Students 31 16 062 121 788
# % % %
Level 4 2 6% 5% 4%
Level 3 21 68% 61% 63% 68
61 63
Level 2 6 19% 26% 28%
Level 1 0 0% <1% <1%
NE1** 0 0% <1% <1% 26 28
19
Participating
29 94% 92% 96% 6 5 4
Students 0 <1 <1 0 <1 <1
No Data 0 0% 2% 1%
NE1 Level 1 Level 2 Level 3 Level 4
Exempt 2 6% 6% 3%
At or Above School Board Province
Provincial Standard 74% 66% 68%
(Levels 3 and 4) †
Grade 3: Mathematics* Percentage of All Grade 3 Students at All Levels: Mathematics*
School Board Province
Number of Students 69 17 388 125 464
# % % %
Level 4 25 36% 16% 12%
Level 3 39 57% 53% 58%
57 58
Level 2 3 4% 21% 23% 53
Level 1 0 0% 2% 2% 36
NE1** 0 0% <1% <1% 23
21
Participating 16 12
67 97% 93% 96% 4
Students 0 <1 <1 0 2 2
No Data 0 0% 2% 1%
NE1 Level 1 Level 2 Level 3 Level 4
Exempt 2 3% 5% 3%
At or Above School Board Province
Provincial Standard 93% 69% 70%
(Levels 3 and 4) †
* Because percentages in tables and graphs are rounded, and because graphs do not show all reporting categories, percentages may not add to 100.
** See the Explanation of Terms.
† These percentages are based on the actual number of students and cannot be calculated simply by adding the rounded percentages of students at Levels 3 and 4.
†† Some French Immersion students do not write all components of the assessment in Grade 3; the numbers shown reflect those students who were expected to write
each component as determined by the French Immersion participation option selected by boards.
September 17, 2009 6 of 31
7. School Report Brown PS (067156)
Results in Reading, Writing and Mathematics, 2008–2009
Grade 3: Participating Students (excludes “no data” and “exempt” categories)
Grade 3: Reading* Percentage of Participating Grade 3 Students at All Levels: Reading*
School Board Province
Number of Students 29 14 761 116 256
# % % %
Level 4 7 24% 9% 7%
Level 3 16 55% 54% 56%
Level 2 5 17% 27% 27% 55 54 56
Level 1 1 3% 8% 8%
NE1** 0 0% 2% 2% 27 27 24
17
At or Above 8 8 9 7
Provincial Standard 79% 63% 63% 0 2 2 3
(Levels 3 and 4) †
NE1 Level 1 Level 2 Level 3 Level 4
School Board Province
Grade 3: Writing* Percentage of Participating Grade 3 Students at All Levels: Writing*
School Board Province
Number of Students 29 14 817 116 812
# % % %
Level 4 2 7% 6% 5%
72
Level 3 21 72% 66% 66% 66 66
Level 2 6 21% 28% 29%
Level 1 0 0% <1% <1%
NE1** 0 0% <1% <1% 28 29
21
At or Above 7
79% 71% 71% 6 5
Provincial Standard 0 <1 <1 0 <1 <1
(Levels 3 and 4) †
NE1 Level 1 Level 2 Level 3 Level 4
School Board Province
Grade 3: Mathematics* Percentage of Participating Grade 3 Students at All Levels: Mathematics*
School Board Province
Number of Students 67 16 183 120 405
# % % %
Level 4 25 37% 17% 13%
Level 3 39 58% 57% 60%
58 57 60
Level 2 3 4% 23% 24%
Level 1 0 0% 2% 2% 37
NE1** 0 0% <1% <1% 23 24
17 13
At or Above
Provincial Standard 96% 74% 73% 0 <1 <1 0 2 2 4
(Levels 3 and 4) †
NE1 Level 1 Level 2 Level 3 Level 4
School Board Province
* Because percentages in tables and graphs are rounded, percentages may not add to 100.
** See the Explanation of Terms.
† These percentages are based on the actual number of students and cannot be calculated simply by adding the rounded percentages of students at Levels 3 and 4.
September 17, 2009 7 of 31
8. School Report Brown PS (067156)
Results in Reading, Writing and Mathematics, 2008–2009
Grade 3: Gender††
Grade 3: School* Percentage of All Grade 3 Students
Reading Writing Mathematics at or Above Provincial Standard: School†
Female Male Female Male Female Male
Number of Students Reading Writing Mathematics
N/R N/R N/R N/R 26 43
Level 4 N/R N/R N/R N/R 15% 49% 98
Level 3 N/R N/R N/R N/R 69% 49% 85
Level 2 N/R N/R N/R N/R 12% 0%
Level 1 N/R N/R N/R N/R 0% 0%
NE1** N/R N/R N/R N/R 0% 0%
Participating
N/R N/R N/R N/R 96% 98%
Students
N/R N/R N/R N/R
No Data N/R N/R N/R N/R 0% 0%
Exempt N/R N/R N/R N/R 4% 2%
At or Above Female Male
Provincial Standard N/R N/R N/R N/R 85% 98%
(Levels 3 and 4)†
Grade 3: Board* Percentage of All Grade 3 Students
Reading Writing Mathematics at or Above Provincial Standard: Board†
Female Male Female Male Female Male
Number of Students 7 722 Reading Writing Mathematics
8 340 7 722 8 340 8 450 8 938
Level 4 10% 6% 7% 3% 16% 16%
Level 3 53% 47% 65% 56% 55% 52%
73 71
Level 2 22% 26% 21% 31% 21% 22% 63 67
59
Level 1 7% 8% <1% <1% 2% 2% 53
NE1** 2% 3% <1% <1% <1% 1%
Participating
94% 90% 94% 91% 95% 92%
Students
No Data 2% 2% 2% 2% 2% 2%
Exempt 5% 8% 4% 7% 4% 7%
At or Above Female Male
Provincial Standard 63% 53% 73% 59% 71% 67%
(Levels 3 and 4)†
Grade 3: Province* Percentage of All Grade 3 Students
Reading Writing Mathematics at or Above Provincial Standard: Province†
Female Male Female Male Female Male
Number of Students 58 888 Reading Writing Mathematics
62 899 58 889 62 899 60 985 64 479
Level 4 9% 5% 6% 3% 12% 12%
Level 3 56% 51% 69% 58% 59% 56%
75 72
Level 2 24% 28% 22% 34% 23% 24% 65 69
61
56
Level 1 6% 8% <1% <1% 2% 2%
NE1** 1% 2% <1% <1% <1% <1%
Participating
97% 94% 97% 95% 97% 95%
Students
No Data 1% 1% 1% 1% 1% 1%
Exempt 3% 5% 2% 4% 2% 4%
At or Above Female Male
Provincial Standard 65% 56% 75% 61% 72% 69%
(Levels 3 and 4)†
* Because percentages in tables are rounded, percentages may not add to 100.
** See the Explanation of Terms.
† These percentages are based on the actual number of students and cannot be calculated simply by adding the rounded percentages of students at Levels 3 and 4.
†† Results include only students for whom gender data were available.
September 17, 2009 8 of 31
9. School Report Brown PS (067156)
Assessments of Reading, Writing and Mathematics, Primary and Junior Divisions, 2008–2009
Contextual Information: Grade 6*
This information provides a context for interpreting the school’s results.
Demographic Information School Board Province
Enrolment
Number of Grade 6 students 60 17 552 136 076
Number of classes with Grade 6 students 3 1 308 8 285
Number of schools with Grade 6 classes Not applicable 330 3 216
Number Percent Number Percent Number Percent
Gender
Female 28 47% 8 545 49% 66 276 49%
Male 32 53% 9 007 51% 69 800 51%
Gender not specified 0 0% 0 0% 0 0%
Student Status
English language learners** 0 0% 651 4% 7 538 6%
Students with special needs (excluding gifted)** 5 8% 3 601 21% 24 326 18%
Place of Birth
Born in Canada 49 82% 12 613 72% 118 305 87%
Born outside Canada 11 18% 4 931 28% 17 592 13%
In Canada less than one year 0 0% 147 1% 768 1%
In Canada one year or more but less than three years 3 5% 873 5% 2 991 2%
In Canada three years or more 8 13% 3 382 19% 12 798 9%
Language
First language learned at home was other than English 11 18% 8 609 49% 27 824 20%
Year Student Entered Current School
Year of the assessment 3 5% 6 519 37% 30 253 22%
Year prior to the assessment 6 10% 1 370 8% 13 485 10%
2 years prior to the assessment 1 2% 1 637 9% 12 503 9%
3 or more years prior to the assessment 50 83% 7 996 46% 79 176 58%
Data not available 0 0% 30 <1% 659 <1%
Year Student Entered Current Board
Year of the assessment 3 5% 1 053 6% 9 175 7%
Year prior to the assessment 5 8% 995 6% 7 907 6%
2 years prior to the assessment 0 0% 974 6% 7 896 6%
3 or more years prior to the assessment 52 87% 14 401 82% 105 510 78%
Data not available 0 0% 129 1% 5 588 4%
* Contextual data pertaining to gender, student status, place of birth, language learned at home and year entered school and board are provided by schools and/or boards
through the Student Data Collection process. Some data may be missing because they were not provided by the school or the board.
** See the Explanation of Terms.
September 17, 2009 9 of 31
10. School Report Brown PS (067156)
Results in Reading, Writing and Mathematics, 2008–2009
Grade 6: All Students
Grade 6: Reading* Percentage of All Grade 6 Students at All Levels: Reading*
School Board Province
Number of Students 60 17 546 136 069
# % % %
Level 4 20 33% 12% 11%
Level 3 34 57% 55% 59%
57 55 59
Level 2 4 7% 20% 22%
Level 1 0 0% 6% 5%
33
NE1** 0 0% 1% <1% 22
20
Participating 12 11
58 97% 94% 96% 6 5 7
Students 0 1 <1 0
No Data 1 2% 1% 1%
NE1 Level 1 Level 2 Level 3 Level 4
Exempt 1 2% 5% 3%
At or Above School Board Province
Provincial Standard 90% 67% 69%
(Levels 3 and 4) †
Grade 6: Writing* Percentage of All Grade 6 Students at All Levels: Writing*
School Board Province
Number of Students 60 17 546 136 075
# % % %
Level 4 12 20% 11% 9%
Level 3 35 58% 56% 58%
58 56 58
Level 2 11 18% 26% 29%
Level 1 0 0% 1% <1%
NE1** 0 0% <1% <1% 26 29
18 20
Participating 11 9
58 97% 94% 96%
Students 0 <1 <1 0 1 <1
No Data 1 2% 1% 1%
NE1 Level 1 Level 2 Level 3 Level 4
Exempt 1 2% 5% 3%
At or Above School Board Province
Provincial Standard 78% 67% 67%
(Levels 3 and 4) †
Grade 6: Mathematics* Percentage of All Grade 6 Students at All Levels: Mathematics*
School Board Province
Number of Students 60 17 535 136 075
# % % %
Level 4 16 27% 17% 13%
Level 3 30 50% 46% 49%
Level 2 11 18% 23% 27% 50 49
46
Level 1 1 2% 7% 6%
NE1** 0 0% 1% <1% 23 27 27
18 17
Participating 13
58 97% 94% 96% 7 6
Students 0 1 <1 2
No Data 1 2% 1% 1%
NE1 Level 1 Level 2 Level 3 Level 4
Exempt 1 2% 5% 3%
At or Above School Board Province
Provincial Standard 77% 63% 63%
(Levels 3 and 4) †
* Because percentages in tables and graphs are rounded, and because graphs do not show all reporting categories, percentages may not add to 100.
** See the Explanation of Terms.
† These percentages are based on the actual number of students and cannot be calculated simply by adding the rounded percentages of students at Levels 3 and 4.
September 17, 2009 10 of 31
11. School Report Brown PS (067156)
Results in Reading, Writing and Mathematics, 2008–2009
Grade 6: Participating Students (excludes “no data” and “exempt” categories)
Grade 6: Reading* Percentage of Participating Grade 6 Students at All Levels: Reading*
School Board Province
Number of Students 58 16 527 131 173
# % % %
Level 4 20 34% 13% 11%
Level 3 34 59% 58% 61%
59 58 61
Level 2 4 7% 22% 22%
Level 1 0 0% 6% 5%
34
NE1** 0 0% 1% 1% 22 22
At or Above 13 11
6 5 7
Provincial Standard 93% 71% 72% 0 1 1 0
(Levels 3 and 4) †
NE1 Level 1 Level 2 Level 3 Level 4
School Board Province
Grade 6: Writing* Percentage of Participating Grade 6 Students at All Levels: Writing*
School Board Province
Number of Students 58 16 538 131 296
# % % %
Level 4 12 21% 12% 9%
Level 3 35 60% 60% 61%
60 60 61
Level 2 11 19% 27% 30%
Level 1 0 0% 1% <1%
27 30
NE1** 0 0% <1% <1%
19 21
At or Above 12 9
Provincial Standard 81% 72% 70% 0 <1 <1 0 1 <1
(Levels 3 and 4) †
NE1 Level 1 Level 2 Level 3 Level 4
School Board Province
Grade 6: Mathematics* Percentage of Participating Grade 6 Students at All Levels: Mathematics*
School Board Province
Number of Students 58 16 509 130 902
# % % %
Level 4 16 28% 18% 14%
Level 3 30 52% 49% 51%
Level 2 11 19% 25% 28% 52 49 51
Level 1 1 2% 7% 7%
NE1** 0 0% 1% <1% 25 28 28
19 18
At or Above 14
7 7
Provincial Standard 79% 67% 65% 0 1 <1 2
(Levels 3 and 4) †
NE1 Level 1 Level 2 Level 3 Level 4
School Board Province
* Because percentages in tables and graphs are rounded, percentages may not add to 100.
** See the Explanation of Terms.
† These percentages are based on the actual number of students and cannot be calculated simply by adding the rounded percentages of students at Levels 3 and 4.
September 17, 2009 11 of 31
12. School Report Brown PS (067156)
Results in Reading, Writing and Mathematics, 2008–2009
Grade 6: Gender††
Grade 6: School* Percentage of All Grade 6 Students
Reading Writing Mathematics at or Above Provincial Standard: School†
Female Male Female Male Female Male
Number of Students Reading Writing Mathematics
28 32 28 32 28 32
Level 4 43% 25% 21% 19% 25% 28% 93 93
88
Level 3 50% 62% 71% 47% 54% 47% 79 75
Level 2 7% 6% 7% 28% 14% 22% 66
Level 1 0% 0% 0% 0% 4% 0%
NE1** 0% 0% 0% 0% 0% 0%
Participating
100% 94% 100% 94% 96% 97%
Students
No Data 0% 3% 0% 3% 0% 3%
Exempt 0% 3% 0% 3% 4% 0%
At or Above Female Male
Provincial Standard 93% 88% 93% 66% 79% 75%
(Levels 3 and 4)†
Grade 6: Board* Percentage of All Grade 6 Students
Reading Writing Mathematics at or Above Provincial Standard: Board†
Female Male Female Male Female Male
Number of Students 8 545 Reading Writing Mathematics
9 001 8 545 9 001 8 533 9 002
Level 4 16% 9% 16% 7% 17% 18%
Level 3 57% 53% 61% 52% 49% 44% 77
73
Level 2 19% 22% 19% 33% 24% 23% 62 66 62
59
Level 1 4% 7% <1% 1% 6% 7%
NE1** 1% 1% <1% <1% <1% 1%
Participating
96% 93% 96% 93% 96% 93%
Students
No Data 1% 1% 1% 1% 1% 1%
Exempt 3% 6% 3% 6% 3% 6%
At or Above Female Male
Provincial Standard 73% 62% 77% 59% 66% 62%
(Levels 3 and 4)†
Grade 6: Province* Percentage of All Grade 6 Students
Reading Writing Mathematics at or Above Provincial Standard: Province†
Female Male Female Male Female Male
Number of Students 66 270 Reading Writing Mathematics
69 799 66 275 69 800 66 275 69 800
Level 4 14% 8% 13% 5% 13% 13%
Level 3 61% 57% 65% 52% 52% 47% 78
75
Level 2 19% 24% 20% 37% 27% 27% 64 64
57 61
Level 1 4% 6% <1% 1% 5% 7%
NE1** <1% 1% <1% <1% <1% <1%
Participating
97% 96% 97% 96% 97% 95%
Students
No Data 1% 1% 1% 1% 1% 1%
Exempt 2% 4% 2% 4% 2% 4%
At or Above Female Male
Provincial Standard 75% 64% 78% 57% 64% 61%
(Levels 3 and 4)†
* Because percentages in tables are rounded, percentages may not add to 100.
** See the Explanation of Terms.
† These percentages are based on the actual number of students and cannot be calculated simply by adding the rounded percentages of students at Levels 3 and 4.
†† Results include only students for whom gender data were available.
September 17, 2009 12 of 31
13. School Report Brown PS (067156)
Assessments of Reading, Writing and Mathematics, Primary and Junior Divisions, 2008–2009
Contextual Information over Time: Grade 3*
This information provides a context for interpreting the school’s results over the past five years.
Grade 3 2004–2005 2005–2006 2006–2007 2007–2008 2008–2009
Enrolment
Number of students 83 73 77 76 69
Participation in the Assessment
Reading† 95% 85% 93% 83% 94%
Writing† 95% 85% 93% 83% 94%
Mathematics† 100% 95% 97% 95% 97%
Gender
Female 53% 49% 52% 53% 38%
Male 46% 51% 48% 47% 62%
Student Status
English language learners** 6% 1% 1% 0% 0%
Students with special needs (excluding gifted)** 7% 7% 8% 7% 9%
Place of Birth
Born in Canada 72% 84% 75% 84% 83%
Born outside Canada 25% 14% 25% 16% 17%
In Canada less than one year 5% 0% 1% 0% 0%
In Canada one year or more but less than three years 5% 4% 9% 7% 0%
In Canada three years or more 14% 10% 10% 9% 13%
Language
First language learned at home was other than English 19% 12% 23% 25% 20%
Year Student Entered Current School
Year of the assessment 3% 9% 12% 9%
Year prior to the assessment Data not 11% 10% 1% 4%
2 years prior to the assessment collected†† 15% 12% 9% 14%
3 or more years prior to the assessment 68% 69% 78% 72%
Data not available 3% 0% 0% 0%
* Contextual data pertaining to gender, student status, place of birth, language learned at home and year entered school are provided by schools and/or boards through
the Student Data Collection process. Some data may be missing because they were not provided by the school or the board.
† Some French Immersion students do not write all components of the assessment in Grade 3; the numbers shown reflect those students who were expected to write each
component as determined by the French Immersion participation option selected by boards.
** See the Explanation of Terms.
†† The question related to student mobility changed in 2005–2006.
September 17, 2009 13 of 31
14. School Report Brown PS (067156)
Results over Time, 2005–2006 to 2008–2009®
Grade 3: Reading
Grade 3 Reading: School* Percentage of All Grade 3 Students at All Levels in Reading: School*
Year '05–'06 '06–'07 '07–'08 '08–'09
Number of
Students
33 43 30 31
Level 4 18% 9% 0% 23% 80
Level 3 45% 44% 80% 52%
Level 2 18% 33% 3% 16% 52
45 44
Level 1 3% 7% 0% 3% 33
NE1** 0% 0% 0% 0% 23
18 16 18
Participating 7 9
Students
X
85% 93% 83% 94% 3 3 3
X
0 0 0 0 0 0
No Data 3% 2% 3% 0%
NE1 Level 1 Level 2 Level 3 Level 4
Exempt 12% 5% 13% 6%
At or Above
Provincial 64% 53% 80% 74% 2005–2006 2006–2007 2007–2008 2008–2009
Standard†
Grade 3 Reading: Board* Percentage of All Grade 3 Students at All Levels in Reading: Board*
Year '05–'06 '06–'07 '07–'08 '08–'09
Number of
Students
17 219 16 526 15 866 16 062
Level 4 7% 7% 8% 8%
Level 3 52% 51% 49% 50%
Level 2 24% 25% 25% 24% 52 51 49 50
Level 1 6% 7% 7% 8%
NE1** 2% 2% 2% 2% 24 25 25 24
Participating 7 7 8 7 7 8 8
X
91% 91% 92% 92% 6
Students X 2 2 2 2
No Data 3% 2% 2% 2%
NE1 Level 1 Level 2 Level 3 Level 4
Exempt 6% 6% 6% 6%
At or Above
Provincial 59% 57% 57% 58% 2005–2006 2006–2007 2007–2008 2008–2009
Standard†
Grade 3 Reading: Province* Percentage of All Grade 3 Students at All Levels in Reading: Province*
Year '05–'06 '06–'07 '07–'08 '08–'09
Number of
Students
129 630 127 618 125 088 121 787
Level 4 6% 6% 8% 7%
Level 3 56% 55% 53% 53%
56 55 53 53
Level 2 24% 25% 26% 26%
Level 1 6% 6% 7% 7%
NE1** 1% 2% 2% 2% 24 25 26 26
Participating 7 7 8 7
X
94% 95% 95% 95% 6 6 6 6
Students X
1 2 2 2
No Data 1% 1% 1% 1%
NE1 Level 1 Level 2 Level 3 Level 4
Exempt 5% 4% 4% 4%
At or Above
Provincial 62% 62% 61% 61% 2005–2006 2006–2007 2007–2008 2008–2009
Standard†
· Refer to the EQAO Web site (www.eqao.com) for data from previous years.
* Because percentages in tables and graphs are rounded, and because graphs do not show all reporting categories, percentages may not add to 100.
** See the Explanation of Terms.
† These percentages are based on the actual number of students and cannot be calculated simply by adding the rounded percentages of students at Levels 3 and 4.
September 17, 2009 14 of 31
15. School Report Brown PS (067156)
Results over Time, 2005–2006 to 2008–2009®
Grade 3: Writing
Grade 3 Writing: School* Percentage of All Grade 3 Students at All Levels in Writing: School*
Year '05–'06 '06–'07 '07–'08 '08–'09
Number of
Students
33 43 30 31
Level 4 15% 9% 3% 6% 77
68
Level 3 48% 49% 77% 68%
Level 2 21% 35% 3% 19% 48 49
Level 1 0% 0% 0% 0% 35
NE1** 0% 0% 0% 0% 21 19
15
Participating 9
Students
X
85% 93% 83% 94% 3 3 6
X
0 0 0 0 0 0 0 0
No Data 3% 2% 3% 0%
NE1 Level 1 Level 2 Level 3 Level 4
Exempt 12% 5% 13% 6%
At or Above
Provincial 64% 58% 80% 74% 2005–2006 2006–2007 2007–2008 2008–2009
Standard†
Grade 3 Writing: Board* Percentage of All Grade 3 Students at All Levels in Writing: Board*
Year '05–'06 '06–'07 '07–'08 '08–'09
Number of
Students
17 219 16 525 15 866 16 062
Level 4 7% 7% 6% 5%
Level 3 57% 57% 58% 61% 61
57 57 58
Level 2 27% 27% 28% 26%
Level 1 <1% <1% <1% <1%
27 27 28 26
NE1** 1% <1% <1% <1%
Participating 7 7
Students
X
91% 91% 92% 92% 6 5
X
1 <1 <1 <1 <1 <1 <1 <1
No Data 3% 3% 2% 2%
NE1 Level 1 Level 2 Level 3 Level 4
Exempt 6% 6% 6% 6%
At or Above
Provincial 64% 64% 64% 66% 2005–2006 2006–2007 2007–2008 2008–2009
Standard†
Grade 3 Writing: Province* Percentage of All Grade 3 Students at All Levels in Writing: Province*
Year '05–'06 '06–'07 '07–'08 '08–'09
Number of
Students
129 630 127 618 125 088 121 788
Level 4 6% 6% 5% 4%
Level 3 58% 58% 61% 63% 63
58 58 61
Level 2 29% 30% 29% 28%
Level 1 <1% <1% <1% <1%
29 30 29 28
NE1** <1% <1% <1% <1%
Participating
Students
X
94% 95% 96% 96% 6 6 5 4
X
<1 <1 <1 <1 <1 <1 <1 <1
No Data 1% 1% 1% 1%
NE1 Level 1 Level 2 Level 3 Level 4
Exempt 5% 4% 3% 3%
At or Above
Provincial 64% 64% 66% 68% 2005–2006 2006–2007 2007–2008 2008–2009
Standard†
· Refer to the EQAO Web site (www.eqao.com) for data from previous years.
* Because percentages in tables and graphs are rounded, and because graphs do not show all reporting categories, percentages may not add to 100.
** See the Explanation of Terms.
† These percentages are based on the actual number of students and cannot be calculated simply by adding the rounded percentages of students at Levels 3 and 4.
September 17, 2009 15 of 31
16. School Report Brown PS (067156)
Results over Time, 2005–2006 to 2008–2009®
Grade 3: Mathematics
Grade 3 Mathematics: School* Percentage of All Grade 3 Students at All Levels in Mathematics: School*
Year '05–'06 '06–'07 '07–'08 '08–'09
Number of
Students
73 77 76 69
Level 4 30% 13% 17% 36%
Level 3 53% 65% 62% 57% 65 62
57
Level 2 10% 19% 16% 4% 53
Level 1 1% 0% 0% 0% 36
30
NE1** 0% 0% 0% 0% 19 16 17
Participating 10 13
Students
X
95% 97% 95% 97% 4
X
0 0 0 0 1 0 0 0
No Data 1% 1% 1% 0%
NE1 Level 1 Level 2 Level 3 Level 4
Exempt 4% 1% 4% 3%
At or Above
Provincial 84% 78% 79% 93% 2005–2006 2006–2007 2007–2008 2008–2009
Standard†
Grade 3 Mathematics: Board* Percentage of All Grade 3 Students at All Levels in Mathematics: Board*
Year '05–'06 '06–'07 '07–'08 '08–'09
Number of
Students
18 401 17 813 17 210 17 388
Level 4 13% 13% 14% 16%
Level 3 53% 53% 52% 53%
Level 2 23% 23% 23% 21% 53 53 52 53
Level 1 3% 3% 3% 2%
NE1** 1% 1% <1% <1% 23 23 23 21
Participating 13 13 14 16
X
93% 93% 93% 93% 3 3 3
Students X
1 1 <1 <1 2
No Data 2% 2% 2% 2%
NE1 Level 1 Level 2 Level 3 Level 4
Exempt 5% 5% 5% 5%
At or Above
Provincial 66% 66% 67% 69% 2005–2006 2006–2007 2007–2008 2008–2009
Standard†
Grade 3 Mathematics: Province* Percentage of All Grade 3 Students at All Levels in Mathematics: Province*
Year '05–'06 '06–'07 '07–'08 '08–'09
Number of
Students
132 782 130 996 128 659 125 464
Level 4 11% 11% 12% 12%
Level 3 57% 57% 56% 58%
57 57 56 58
Level 2 23% 24% 25% 23%
Level 1 3% 3% 3% 2%
NE1** <1% <1% <1% <1% 23 24 25 23
Participating 11 11 12 12
X
95% 95% 96% 96% 3 3 3
Students X
<1 <1 <1 <1 2
No Data 1% 1% 1% 1%
NE1 Level 1 Level 2 Level 3 Level 4
Exempt 4% 3% 3% 3%
At or Above
Provincial 68% 69% 68% 70% 2005–2006 2006–2007 2007–2008 2008–2009
Standard†
· Refer to the EQAO Web site (www.eqao.com) for data from previous years.
* Because percentages in tables and graphs are rounded, and because graphs do not show all reporting categories, percentages may not add to 100.
** See the Explanation of Terms.
† These percentages are based on the actual number of students and cannot be calculated simply by adding the rounded percentages of students at Levels 3 and 4.
September 17, 2009 16 of 31
17. School Report Brown PS (067156)
Assessments of Reading, Writing and Mathematics, Primary and Junior Divisions, 2008–2009
Contextual Information over Time: Grade 6*
This information provides a context for interpreting the school’s results over the past five years.
Grade 6 2004–2005 2005–2006 2006–2007 2007–2008 2008–2009
Enrolment
Number of students 61 72 69 69 60
Participation in the Assessment
Reading 100% 100% 99% 99% 97%
Writing 100% 100% 99% 99% 97%
Mathematics 100% 100% 99% 99% 97%
Gender
Female 46% 44% 54% 52% 47%
Male 54% 56% 46% 48% 53%
Student Status
English language learners** 3% 0% 0% 0% 0%
Students with special needs (excluding gifted)** 7% 1% 7% 6% 8%
Place of Birth
Born in Canada 85% 79% 86% 75% 82%
Born outside Canada 15% 21% 14% 25% 18%
In Canada less than one year 2% 1% 0% 0% 0%
In Canada one year or more but less than three years 0% 6% 1% 1% 5%
In Canada three years or more 13% 14% 12% 19% 13%
Language
First language learned at home was other than English 8% 17% 13% 17% 18%
Year Student Entered Current School
Year of the assessment 4% 6% 4% 5%
Year prior to the assessment Data not 10% 4% 7% 10%
2 years prior to the assessment collected†† 6% 7% 1% 2%
3 or more years prior to the assessment 81% 83% 87% 83%
Data not available 0% 0% 0% 0%
* Contextual data pertaining to gender, student status, place of birth, language learned at home and year entered school are provided by schools and/or boards through
the Student Data Collection process. Some data may be missing because they were not provided by the school or the board.
** See the Explanation of Terms.
†† The question related to student mobility changed in 2005–2006.
September 17, 2009 17 of 31