Metro Boston Monthly Indicators Report, October 2012
•
0 gostou•373 visualizações

Here's October 2012's Monthly Indicators report from the Greater Boston Association of Realtors®

Recomendados
Recomendados
Mais conteúdo relacionado
Mais procurados
Mais procurados (18)
Semelhante a Metro Boston Monthly Indicators Report, October 2012
Semelhante a Metro Boston Monthly Indicators Report, October 2012 (20)
Mais de Unit Realty Group
Mais de Unit Realty Group (20)
Último
Último (20)
Metro Boston Monthly Indicators Report, October 2012
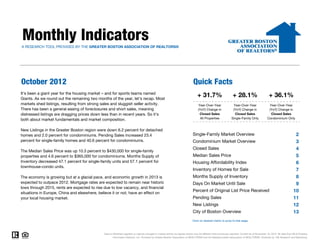
- 1. Monthly Indicators A RESEARCH TOOL PROVIDED BY THE GREATER BOSTON ASSOCIATION OF REALTORS® October 2012 Quick Facts It's been a giant year for the housing market – and for sports teams named Giants. As we round out the remaining two months of the year, let's recap. Most + 31.7% + 28.1% + 36.1% markets shed listings, resulting from strong sales and sluggish seller activity. Year-Over-Year Year-Over-Year Year-Over-Year There has been a general easing of foreclosures and short sales, meaning (YoY) Change in (YoY) Change in (YoY) Change in distressed listings are dragging prices down less than in recent years. So it's Closed Sales Closed Sales Closed Sales both about market fundamentals and market composition. All Properties Single-Family Only Condominium Only New Listings in the Greater Boston region were down 6.2 percent for detached homes and 2.0 percent for condominiums. Pending Sales increased 23.4 Single-Family Market Overview 2 percent for single-family homes and 40.6 percent for condominiums. Condominium Market Overview 3 Closed Sales 4 The Median Sales Price was up 10.3 percent to $430,000 for single-family properties and 4.6 percent to $365,000 for condominiums. Months Supply of Median Sales Price 5 Inventory decreased 47.1 percent for single-family units and 57.1 percent for Housing Affordability Index 6 townhouse-condo units. Inventory of Homes for Sale 7 The economy is growing but at a glacial pace, and economic growth in 2013 is Months Supply of Inventory 8 expected to outpace 2012. Mortgage rates are expected to remain near historic Days On Market Until Sale 9 lows through 2015, rents are expected to rise due to low vacancy, and financial situations in Europe, China and elsewhere, believe it or not, have an effect on Percent of Original List Price Received 10 your local housing market. Pending Sales 11 New Listings 12 City of Boston Overview 13 Click on desired metric to jump to that page. Data is refreshed regularly to capture changes in market activity so figures shown may be different than previously reported. Current as of November 16, 2012. All data from MLS Property Information Network, Inc. Provided by Greater Boston Association of REALTORS® and the Massachusetts Association of REALTORS®. Powered by 10K Research and Marketing.
- 2. Single-Family Market Overview Key market metrics for the current month and year-to-date figures for Single-Family Homes Only. Key Metrics Historical Sparklines Oct-2011 Oct-2012 +/– YTD 2011 YTD 2012 +/– Closed Sales 619 793 + 28.1% 7,634 9,127 + 19.6% 10-2009 10-2010 10-2011 10-2012 Median Sales Price $390,000 $430,000 + 10.3% $455,500 $458,000 + 0.5% 10-2009 10-2010 10-2011 10-2012 Housing Affordability Index 116 115 - 0.6% 101 109 + 7.7% 10-2009 10-2010 10-2011 10-2012 Inventory of Homes for Sale 5,417 3,670 - 32.3% -- -- -- 10-2009 10 2009 10-2010 10 2010 10-2011 10 2011 10-2012 10 2012 Months Supply of Inventory 8.8 4.6 - 47.1% -- -- -- 10-2009 10-2010 10-2011 10-2012 Days on Market Until Sale 108 91 - 16.2% 103 99 - 3.9% 10-2009 10-2010 10-2011 10-2012 Percent of Original 91.8% 94.4% + 2.8% 93.3% 94.4% + 1.2% List Price Received 10-2009 10-2010 10-2011 10-2012 Pending Sales 744 918 + 23.4% 7,928 9,723 + 22.6% 10-2009 10-2010 10-2011 10-2012 New Listings 1,159 1,087 - 6.2% 14,245 13,901 - 2.4% 10-2009 10-2010 10-2011 10-2012 All data from MLS Property Information Network, Inc. Provided by the Greater Boston Association of REALTORS® and the Massachusetts Association of REALTORS®. Powered by 10K Research and Marketing. | Click for Cover Page | 2
- 3. Condominium Market Overview Key market metrics for the current month and year-to-date figures for Condominium Properties Only. Key Metrics Historical Sparklines Oct-2011 Oct-2012 +/– YTD 2011 YTD 2012 +/– Closed Sales 513 698 + 36.1% 6,734 8,141 + 20.9% 10-2009 10-2010 10-2011 10-2012 Median Sales Price $349,000 $365,000 + 4.6% $360,000 $378,000 + 5.0% 10-2009 10-2010 10-2011 10-2012 Housing Affordability Index 128 134 + 4.3% 125 130 + 4.0% 10-2009 10-2010 10-2011 10-2012 Inventory of Homes for Sale 4,095 2,391 - 41.6% -- -- -- 10-2009 10 2009 10-2010 10 2010 10-2011 10 2011 10-2012 10 2012 Months Supply of Inventory 8.0 3.4 - 57.1% -- -- -- 10-2009 10-2010 10-2011 10-2012 Days on Market Until Sale 95 83 - 12.0% 104 88 - 15.2% 10-2009 10-2010 10-2011 10-2012 Percent of Original 93.6% 95.8% + 2.4% 94.1% 95.7% + 1.8% List Price Received 10-2009 10-2010 10-2011 10-2012 Pending Sales 593 834 + 40.6% 6,937 8,736 + 25.9% 10-2009 10-2010 10-2011 10-2012 New Listings 902 884 - 2.0% 12,632 11,630 - 7.9% 10-2009 10-2010 10-2011 10-2012 All data from MLS Property Information Network, Inc. Provided by the Greater Boston Association of REALTORS® and the Massachusetts Association of REALTORS®. Powered by 10K Research and Marketing. | Click for Cover Page | 3
- 4. Closed Sales A count of the actual sales that have closed in a given month. October Year to Date Single-Family YoY Change Condominium YoY Change Nov-2011 690 + 8.8% 562 + 11.1% 9,127 Dec-2011 745 + 1.2% 645 - 1.5% 793 8,141 Jan-2012 526 + 12.6% 413 + 2.7% 698 7,779 7,634 619 7,145 Feb-2012 474 + 33.5% 385 + 12.2% 584 6,734 Mar-2012 657 + 16.5% 608 + 10.9% 513 482 Apr-2012 752 + 12.1% 759 + 19.7% May-2012 1,017 + 20.4% 1,013 + 32.1% Jun-2012 1,529 + 21.4% 1,269 + 20.1% Jul-2012 1,291 + 25.2% 1,039 + 21.5% Aug-2012 1,316 + 26.7% 1,204 + 24.5% Sep-2012 772 - 1.5% 753 + 16.2% 2010 2011 2012 2010 2011 2012 2010 2011 2012 2010 2011 2012 Oct-2012 793 + 28.1% 698 + 36.1% +6.0% +28.1% +6.4% +36.1% -1.9% +19.6% -5.8% +20.9% Total 10,562 + 17.3% 9,348 + 18.4% Single-Family Condominium Single-Family Condominium Historical Closed Sales Activity Single-Family Condominium 1,800 1,600 1,400 1,200 1,000 800 600 400 200 Jan-2003 Jan-2004 Jan-2005 Jan-2006 Jan-2007 Jan-2008 Jan-2009 Jan-2010 Jan-2011 Jan-2012 All data from MLS Property Information Network, Inc. Provided by the Greater Boston Association of REALTORS® and the Massachusetts Association of REALTORS®. Powered by 10K Research and Marketing. | Click for Cover Page | 4
- 5. Median Sales Price Median price point for all closed sales, not accounting for seller concessions, in a given month. October Year to Date Single-Family YoY Change Condominium YoY Change Nov-2011 $423,000 - 4.6% $350,500 - 7.3% $451,100 $455,500 $458,000 Dec-2011 $440,000 + 1.1% $344,500 - 3.0% $441,250 $430,000 Jan-2012 $405,000 - 9.0% $349,950 - 1.7% $390,000 $378,000 $365,000 $360,000 Feb-2012 $391,875 + 3.4% $371,000 + 6.6% $349,000 $345,000 $333,000 Mar-2012 $411,000 - 1.3% $340,000 + 4.8% Apr-2012 $414,850 - 3.3% $370,750 + 5.0% May-2012 $465,000 + 1.3% $381,000 + 4.4% Jun-2012 $500,000 - 0.2% $400,000 + 6.7% Jul-2012 $510,000 + 2.2% $387,000 + 6.3% Aug-2012 $489,450 - 1.9% $380,000 + 3.5% Sep-2012 $430,000 - 4.3% $375,000 + 2.0% 2010 2011 2012 2010 2011 2012 2010 2011 2012 2010 2011 2012 Oct-2012 $430,000 + 10.3% $365,000 + 4.6% -11.6% +10.3% +4.8% +4.6% +1.0% +0.5% +4.3% +5.0% Median $453,000 + 0.4% $375,000 + 4.2% Single-Family Condominium Single-Family Condominium Historical Median Sales Price Single-Family Condominium $550,000 $500,000 $450,000 $400,000 $350,000 $300,000 $250,000 Jan-2003 Jan-2004 Jan-2005 Jan-2006 Jan-2007 Jan-2008 Jan-2009 Jan-2010 Jan-2011 Jan-2012 All data from MLS Property Information Network, Inc. Provided by the Greater Boston Association of REALTORS® and the Massachusetts Association of REALTORS®. Powered by 10K Research and Marketing. | Click for Cover Page | 5
- 6. Housing Affordability Index This index measures housing affordability for the region. An index of 120 means the median household income was 120% of what is necessary to qualify for the median-priced home under prevailing interest rates. A higher number means greater affordability. October Year to Date Single-Family YoY Change Condominium YoY Change 130 Nov-2011 108 + 10.0% 128 + 12.8% 122 125 134 Dec-2011 104 + 5.9% 130 + 9.9% 125 128 109 116 115 101 Jan-2012 113 + 17.4% 129 + 9.3% 95 Feb-2012 119 + 7.9% 125 + 4.9% 97 Mar-2012 114 + 11.5% 135 + 5.6% Apr-2012 112 + 13.1% 124 + 4.8% May-2012 102 + 7.2% 122 + 4.2% Jun-2012 97 + 8.5% 118 + 1.9% Jul-2012 96 + 7.9% 124 + 3.9% Aug-2012 100 + 11.0% 127 + 5.5% Sep-2012 116 + 15.2% 131 + 8.5% 2010 2011 2012 2010 2011 2012 2010 2011 2012 2010 2011 2012 Oct-2012 115 - 0.6% 134 + 4.3% +19.3% -0.6% +2.2% +4.3% +6.4% +7.7% +2.5% +4.0% Average 108 +9.6% 127 +6.3% Single-Family Condominium Single-Family Condominium Historical Housing Affordability Index Single-Family Condominium 140 130 120 110 100 90 80 70 60 Jan-2004 Jan-2005 Jan-2006 Jan-2007 Jan-2008 Jan-2009 Jan-2010 Jan-2011 Jan-2012 All data from MLS Property Information Network, Inc. Provided by the Greater Boston Association of REALTORS® and the Massachusetts Association of REALTORS®. Powered by 10K Research and Marketing. | Click for Cover Page | 6
- 7. Inventory of Homes for Sale The number of properties available for sale in active status at the end of a given month. October Single-Family YoY Change Condominium YoY Change Nov-2011 4,600 - 3.4% 3,592 - 20.9% 5,419 5,417 Dec-2011 3,654 - 2.9% 2,809 - 20.8% 5,175 Jan-2012 3,688 - 2.8% 2,968 - 19.3% Feb-2012 4,077 + 6.3% 3,257 - 16.8% 4,095 3,670 Mar-2012 4,694 + 1.5% 3,683 - 21.4% Apr-2012 5,037 - 5.3% 3,832 - 26.1% May-2012 5,134 - 10.4% 3,638 - 30.3% 2,391 Jun-2012 4,796 - 16.2% 3,341 - 34.5% Jul-2012 4,334 - 22.5% 3,047 - 35.4% Aug-2012 3,916 - 27.0% 2,603 - 38.2% Sep-2012 4,076 - 27.7% 2,684 - 37.9% 2010 2011 2012 2010 2011 2012 Oct-2012 3,670 - 32.3% 2,391 - 41.6% -0.0% 32 3% -32.3% -20.9% -41.6% Average 4,306 - 13.3% 3,154 - 28.9% Single-Family Condominium Historical Inventory of Homes for Sale Single-Family Condominium 9,000 8,000 7,000 6,000 5,000 4,000 3,000 2,000 Jan-2003 Jan-2004 Jan-2005 Jan-2006 Jan-2007 Jan-2008 Jan-2009 Jan-2010 Jan-2011 Jan-2012 All data from MLS Property Information Network, Inc. Provided by the Greater Boston Association of REALTORS® and the Massachusetts Association of REALTORS®. Powered by 10K Research and Marketing. | Click for Cover Page | 7
- 8. Months Supply of Inventory The inventory of homes for sale at the end of a given month, divided by the average monthly pending sales from the last 12 months. October Single-Family YoY Change Condominium YoY Change 10.7 Nov-2011 6.7 - 11.2% 6.4 - 28.8% Dec-2011 4.9 - 4.1% 4.4 - 19.5% 9.3 8.8 Jan-2012 7.0 - 13.7% 7.2 - 21.5% 8.0 Feb-2012 8.6 - 20.4% 8.5 - 25.9% Mar-2012 7.1 - 12.9% 6.1 - 29.2% Apr-2012 6.7 - 15.5% 5.0 - 38.2% 4.6 May-2012 5.0 - 25.6% 3.6 - 47.3% Jun-2012 3.1 - 31.0% 2.6 - 45.4% 3.4 Jul-2012 3.4 - 38.1% 2.9 - 46.8% Aug-2012 3.0 - 42.4% 2.2 - 50.4% Sep-2012 5.3 - 26.6% 3.6 - 46.6% 2010 2011 2012 2010 2011 2012 Oct-2012 4.6 - 47.1% 3.4 - 57.1% -5.7% -47.1% -25.7% -57.1% Average 5.4 - 19.6% 4.5 - 32.9% Single-Family Condominium Historical Months Supply of Inventory Single-Family Condominium 14 12 10 8 6 4 2 Jan-2004 Jan-2005 Jan-2006 Jan-2007 Jan-2008 Jan-2009 Jan-2010 Jan-2011 Jan-2012 All data from MLS Property Information Network, Inc. Provided by the Greater Boston Association of REALTORS® and the Massachusetts Association of REALTORS®. Powered by 10K Research and Marketing. | Click for Cover Page | 8
- 9. Days on Market Until Sale Average number of days between when a property is listed and when an offer is accepted in a given month. October Year to Date Single-Family YoY Change Condominium YoY Change Nov-2011 110 + 4.1% 109 + 7.7% 108 111 105 Dec-2011 112 - 0.3% 120 + 11.8% 103 101 104 99 Jan-2012 130 + 15.0% 124 - 5.1% 95 93 91 88 83 Feb-2012 134 + 2.9% 123 - 9.8% Mar-2012 131 - 3.1% 118 - 4.2% Apr-2012 120 - 1.4% 98 - 16.9% May-2012 96 - 6.4% 86 - 12.0% Jun-2012 90 - 0.1% 75 - 19.4% Jul-2012 81 - 4.4% 71 - 20.7% Aug-2012 88 - 5.4% 76 - 18.3% Sep-2012 89 - 12.2% 85 - 17.9% 2010 2011 2012 2010 2011 2012 2010 2011 2012 2010 2011 2012 Oct-2012 91 - 16.2% 83 - 12.0% +3.7% -16.2% -14.8% -12.0% +11.2% -3.9% +2.0% -15.2% Total 101 - 3.2% 84 - 10.8% Single-Family Condominium Single-Family Condominium Historical Days on Market Until Sale Single-Family Condominium 160 140 120 100 80 60 40 Jan-2003 Jan-2004 Jan-2005 Jan-2006 Jan-2007 Jan-2008 Jan-2009 Jan-2010 Jan-2011 Jan-2012 All data from MLS Property Information Network, Inc. Provided by the Greater Boston Association of REALTORS® and the Massachusetts Association of REALTORS®. Powered by 10K Research and Marketing. | Click for Cover Page | 9
- 10. Percent of Original List Price Received Percentage found when dividing a property’s sales price by its original list price, then taking the average for all properties sold in a given month, not accounting for seller concessions. October Year to Date Single-Family YoY Change Condominium YoY Change Nov-2011 92.4% - 0.3% 93.8% - 0.2% Dec-2011 92.2% + 1.0% 93.0% + 0.1% 93.5% 93.6% 95.8% 94.5% 94.1% 95.7% Jan-2012 90.5% - 0.4% 92.8% + 0.5% 92.1% 91.8% 94.4% 93.9% 93.3% 94.4% Feb-2012 91.2% + 0.3% 93.4% + 1.5% Mar-2012 93.0% + 0.8% 94.0% + 0.9% Apr-2012 93.5% + 0.9% 95.7% + 2.0% May-2012 95.4% + 1.2% 96.1% + 1.0% Jun-2012 95.3% + 0.8% 96.3% + 1.7% Jul-2012 95.7% + 1.5% 96.6% + 1.7% Aug-2012 94.8% + 1.5% 96.2% + 2.2% Sep-2012 94.5% + 1.5% 96.4% + 2.4% 2010 2011 2012 2010 2011 2012 2010 2011 2012 2010 2011 2012 Oct-2012 94.4% + 2.8% 95.8% + 2.4% -0.4% +2.8% +0.1% +2.4% -0.7% +1.2% -0.5% +1.8% Average 94.1% + 1.1% 95.4% + 1.5% Single-Family Condominium Single-Family Condominium Historical Percent of Original List Price Received Single-Family Condominium 99% 98% 97% 96% 95% 94% 93% 92% 91% 90% 89% Jan-2003 Jan-2004 Jan-2005 Jan-2006 Jan-2007 Jan-2008 Jan-2009 Jan-2010 Jan-2011 Jan-2012 All data from MLS Property Information Network, Inc. Provided by the Greater Boston Association of REALTORS® and the Massachusetts Association of REALTORS®. Powered by 10K Research and Marketing. | Click for Cover Page | 10
- 11. Pending Sales A count of the properties in UAG status between the first and last day in a given month, regardless of current status (based on Off Market Date). October Year to Date Single-Family YoY Change Condominium YoY Change Nov-2011 684 + 16.7% 564 - 2.1% 918 Dec-2011 570 + 5.2% 471 + 6.3% 834 9,723 Jan-2012 546 + 26.7% 484 + 18.6% 722 744 8,736 Feb-2012 651 + 23.1% 636 + 24.2% 8,005 7,928 7,183 6,937 Mar-2012 997 + 24.9% 1,015 + 32.7% 593 554 Apr-2012 1,154 + 21.9% 1,049 + 24.3% May-2012 1,340 + 23.2% 1,270 + 28.8% Jun-2012 1,273 + 13.8% 1,049 + 19.6% Jul-2012 1,057 + 26.6% 840 + 9.9% Aug-2012 923 + 19.4% 828 + 23.6% Sep-2012 864 + 30.1% 731 + 41.1% 2010 2011 2012 2010 2011 2012 2010 2011 2012 2010 2011 2012 Oct-2012 918 + 23.4% 834 + 40.6% +3.0% +23.4% +7.0% +40.6% -1.0% +22.6% -3.4% +25.9% Total 10,977 + 21.2% 9,771 + 22.8% Single-Family Condominium Single-Family Condominium Historical Pending Sales Activity Single-Family Condominium 1,400 1,200 1,000 800 600 400 200 Jan-2003 Jan-2004 Jan-2005 Jan-2006 Jan-2007 Jan-2008 Jan-2009 Jan-2010 Jan-2011 Jan-2012 All data from MLS Property Information Network, Inc. Provided by the Greater Boston Association of REALTORS® and the Massachusetts Association of REALTORS®. Powered by 10K Research and Marketing. | Click for Cover Page | 11
- 12. New Listings A count of the properties that have been newly listed on the market in a given month. October Year to Date Single-Family YoY Change Condominium YoY Change Nov-2011 682 - 8.6% 628 - 11.8% 14,680 14,245 14,736 Dec-2011 459 + 6.0% 389 - 20.4% 1,186 1,159 13,901 1,087 1,125 12,632 Jan-2012 974 + 14.3% 958 - 1.8% 11,630 Feb-2012 1,336 + 51.3% 1,145 + 5.8% 902 884 Mar-2012 2,023 + 3.1% 1,741 - 12.0% Apr-2012 1,812 - 9.3% 1,503 - 13.1% May-2012 1,810 - 4.1% 1,391 - 7.5% Jun-2012 1,371 - 15.2% 1,155 - 14.1% Jul-2012 1,036 - 13.1% 905 - 7.6% Aug-2012 1,012 - 8.5% 792 - 7.4% Sep-2012 1,440 - 9.4% 1,156 - 9.8% 2010 2011 2012 2010 2011 2012 2010 2011 2012 2010 2011 2012 Oct-2012 1,087 - 6.2% 884 - 2.0% -2.3% -6.2% -19.8% -2.0% -3.0% -2.4% -14.3% -7.9% Total 15,042 - 2.5% 12,647 - 8.6% Single-Family Condominium Single-Family Condominium Historical New Listing Activity Single-Family Condominium 2,750 2,500 2,250 2,000 1,750 1,500 1,250 1,000 750 500 250 Jan-2003 Jan-2004 Jan-2005 Jan-2006 Jan-2007 Jan-2008 Jan-2009 Jan-2010 Jan-2011 Jan-2012 All data from MLS Property Information Network, Inc. Provided by the Greater Boston Association of REALTORS® and the Massachusetts Association of REALTORS®. Powered by 10K Research and Marketing. | Click for Cover Page | 12
- 13. City of Boston – Market Overview Key market metrics for the current month and year-to-date figures for the City of Boston. Key Metrics Historical Sparklines Oct-2011 Oct-2012 +/– YTD 2011 YTD 2012 +/– Closed Sales 281 364 + 29.5% 3,704 4,561 + 23.1% 10-2009 10-2010 10-2011 10-2012 Median Sales Price $352,000 $415,000 + 17.9% $375,000 $400,000 + 6.7% 10-2009 10-2010 10-2011 10-2012 Housing Affordability Index 116 115 - 0.6% 101 109 + 7.7% 10-2009 10-2010 10-2011 10-2012 Inventory of Homes for Sale 2,191 1,204 - 45.0% -- -- -- 10-2009 10 2009 10-2010 10 2010 10-2011 10 2011 10-2012 10 2012 Months Supply of Inventory 7.8 3.3 - 57.6% -- -- -- 10-2009 10-2010 10-2011 10-2012 Days on Market Until Sale 95 70 - 26.6% 99 84 - 15.9% 10-2009 10-2010 10-2011 10-2012 Percent of Original 92.8% 96.0% + 3.5% 93.8% 95.6% + 1.9% List Price Received 10-2009 10-2010 10-2011 10-2012 Pending Sales 344 456 + 32.6% 3,850 4,863 + 26.3% 10-2009 10-2010 10-2011 10-2012 New Listings 511 517 + 1.2% 7,135 6,558 - 8.1% 10-2009 10-2010 10-2011 10-2012 All data from MLS Property Information Network, Inc. Provided by the Greater Boston Association of REALTORS® and the Massachusetts Association of REALTORS®. Powered by 10K Research and Marketing. | Click for Cover Page | 13