SlideShare uma empresa Scribd logo
1 de 13
Baixar para ler offline
Monthly Indicators
A RESEARCH TOOL PROVIDED BY THE GREATER BOSTON ASSOCIATION OF REALTORS®


February 2013                                                                                                                   Quick Facts
The sun is shining brighter for longer, the birds are chirping a bit louder and
people have a renewed spring in their step. And then there's the climate. Home
                                                                                                                                     + 0.7%                           - 7.5%                         + 10.7%
buyers and sellers are readying themselves for an exciting spring market.                                                           Year-Over-Year                  Year-Over-Year                   Year-Over-Year
Buyers are motivated by an attractive affordability environment, while more and                                                     (YoY) Change in                 (YoY) Change in                  (YoY) Change in
more sellers are receiving near top dollar for their home. We've come a long                                                         Closed Sales                    Closed Sales                     Closed Sales
way over the past 12 to 18 months but we're not there yet. Here's how February                                                        All Properties               Single-Family Only               Condominium Only

stacked up.

New Listings in the Greater Boston region were down 22.2 percent for detached                                                  Single-Family Market Overview                                                                 2
homes and 15.5 percent for condominiums. Closed Sales decreased 7.5                                                            Condominium Market Overview                                                                   3
percent for detached homes but increased 10.7 percent for condominiums.
                                                                                                                               Closed Sales                                                                                  4
The Median Sales Price was up 8.8 percent to $429,900 for single-family                                                        Median Sales Price                                                                            5
properties but decreased 5.2 percent to $350,750 for condominiums. Months                                                      Housing Affordability Index                                                                   6
Supply of Inventory decreased 30.6 percent for single-family units and 46.9
                                                                                                                               Inventory of Homes for Sale                                                                   7
percent for townhouse-condo units.
                                                                                                                               Months Supply of Inventory                                                                    8
A few consumers may feel less confident due to Washington's latest self-                                                       Days On Market Until Sale                                                                     9
inflicted crisis. Others would advise not to read the news in the first place. The
fact is, the economy continues to grow, but at a snail's pace. Sequestration is
                                                                                                                               Percent of Original List Price Received                                                      10
more of a nuisance than a real threat to recovery; and there's significant                                                     Pending Sales                                                                                11
pent–up demand from renters, first-timers, parental basement dwellers and                                                      New Listings                                                                                 12
investors to counteract it.
                                                                                                                               City of Boston Overview                                                                      13
                                                                                                                               Click on desired metric to jump to that page.


                                                   Data is refreshed regularly to capture changes in market activity so figures shown may be different than previously reported. Current as of March 16, 2013. All data from MLS Property
                                                      Information Network, Inc. Provided by Greater Boston Association of REALTORS® and the Massachusetts Association of REALTORS®. Powered by 10K Research and Marketing.
Single-Family Market Overview
Key market metrics for the current month and year-to-date figures for Single-Family Homes Only.


 Key Metrics                                            Historical Sparklines                                                            Feb-2012 Feb-2013                      +/–            YTD 2012 YTD 2013                      +/–


 Closed Sales                                                                                                                                464               429             - 7.5%              987              1,033           + 4.7%
                                                       2-2010                  2-2011                  2-2012                  2-2013


 Median Sales Price                                                                                                                      $395,000          $429,900            + 8.8%          $402,000          $430,000           + 7.0%
                                                       2-2010                  2-2011                  2-2012                  2-2013


 Housing Affordability Index                                                                                                                 124               122             - 2.0%              122               122             - 0.6%
                                                       2-2010                  2-2011                  2-2012                  2-2013


 Inventory of Homes for Sale                                                                                                                4,040             2,592           - 35.8%                --                --                --
                                                       2-2010
                                                       2 2010                  2-2011
                                                                               2 2011                  2-2012
                                                                                                       2 2012                  2-2013
                                                                                                                               2 2013


 Months Supply of Inventory                                                                                                                   8.7               6.0           - 30.6%                --                --                --
                                                       2-2010                  2-2011                  2-2012                  2-2013


 Days on Market Until Sale                                                                                                                   134               109            - 18.6%              132               109            - 17.5%
                                                       2-2010                  2-2011                  2-2012                  2-2013


 Percent of Original
                                                                                                                                           91.2%             94.1%             + 3.2%            90.8%             93.9%            + 3.4%
 List Price Received
                                                       2-2010                  2-2011                  2-2012                  2-2013


 Pending Sales                                                                                                                               639               683             + 6.9%             1,179             1,269           + 7.6%
                                                       2-2010                  2-2011                  2-2012                  2-2013


 New Listings                                                                                                                               1,319             1,026           - 22.2%             2,282             1,929           - 15.5%
                                                       2-2010                  2-2011                  2-2012                  2-2013


                     All data from MLS Property Information Network, Inc. Provided by the Greater Boston Association of REALTORS® and the Massachusetts Association of REALTORS®. Powered by 10K Research and Marketing. | Click for Cover Page | 2
Condominium Market Overview
Key market metrics for the current month and year-to-date figures for Condominium Properties Only.


 Key Metrics                                            Historical Sparklines                                                            Feb-2012 Feb-2013                      +/–            YTD 2012 YTD 2013                      +/–


 Closed Sales                                                                                                                                384               425            + 10.7%              796               936            + 17.6%
                                                       2-2010                  2-2011                  2-2012                  2-2013


 Median Sales Price                                                                                                                      $370,000          $350,750            - 5.2%          $360,000          $360,000             0.0%
                                                       2-2010                  2-2011                  2-2012                  2-2013


 Housing Affordability Index                                                                                                                 132               146            + 11.0%              135               143            + 6.1%
                                                       2-2010                  2-2011                  2-2012                  2-2013


 Inventory of Homes for Sale                                                                                                                3,257             1,915           - 41.2%                --                --                --
                                                       2-2010
                                                       2 2010                  2-2011
                                                                               2 2011                  2-2012
                                                                                                       2 2012                  2-2013
                                                                                                                               2 2013


 Months Supply of Inventory                                                                                                                   8.5               4.5           - 46.9%                --                --                --
                                                       2-2010                  2-2011                  2-2012                  2-2013


 Days on Market Until Sale                                                                                                                   123                93            - 24.6%              124                90            - 27.1%
                                                       2-2010                  2-2011                  2-2012                  2-2013


 Percent of Original
                                                                                                                                           93.4%             96.8%             + 3.6%            93.2%             96.3%            + 3.4%
 List Price Received
                                                       2-2010                  2-2011                  2-2012                  2-2013


 Pending Sales                                                                                                                               635               644             + 1.4%             1,118             1,263           + 13.0%
                                                       2-2010                  2-2011                  2-2012                  2-2013


 New Listings                                                                                                                               1,141              964            - 15.5%             2,095             1,878           - 10.4%
                                                       2-2010                  2-2011                  2-2012                  2-2013


                     All data from MLS Property Information Network, Inc. Provided by the Greater Boston Association of REALTORS® and the Massachusetts Association of REALTORS®. Powered by 10K Research and Marketing. | Click for Cover Page | 3
Closed Sales
A count of the actual sales that have closed in a given month.


 February                                                                     Year to Date                                                                                            Single-Family
                                                                                                                                                                                                           YoY
                                                                                                                                                                                                          Change
                                                                                                                                                                                                                       Condominium
                                                                                                                                                                                                                                            YoY
                                                                                                                                                                                                                                           Change

                                                                                                                                                                     Mar-2012               648          + 16.5%             607          + 11.0%
               464
                                                                                                                                                                     Apr-2012               743          + 12.6%             758          + 20.1%
                         429                                 425                                        1,033
                                                                                              987                                                                    May-2012              1,005         + 20.5%            1,012         + 32.1%
                                                   384                                                                                        936
        351                                                                                                                                                          Jun-2012              1,510         + 21.3%            1,264         + 20.3%
                                        342                                         811                                             796
                                                                                                                         742                                         Jul-2012              1,279         + 25.3%            1,040         + 21.6%
                                                                                                                                                                     Aug-2012             1,299          + 26.0%            1,204         + 25.3%
                                                                                                                                                                     Sep-2012               766           - 1.2%             753          + 16.4%
                                                                                                                                                                     Oct-2012               791          + 28.6%             711          + 38.9%
                                                                                                                                                                     Nov-2012               907          + 32.6%             760          + 35.2%
                                                                                                                                                                     Dec-2012               824          + 11.8%             767          + 19.3%
                                                                                                                                                                     Jan-2013               604          + 15.5%             511          + 24.0%
        2011    2012     2013            2011       2012      2013                  2011       2012      2013            2011       2012       2013
                                                                                                                                                                     Feb-2013               429           - 7.5%             425          + 10.7%
               +32.2%   -7.5%                     +12.3%    +10.7%                           +21.7%     +4.7%                      +7.3%     +17.6%
                                                                                                                                                                     Total                10,805         + 18.2%            9,812         + 23.1%
          Single-Family                    Condominium                                 Single-Family                        Condominium


Historical Closed Sales Activity                                                                                                                                             Single-Family                        Condominium
1,800

1,600

1,400

1,200

1,000

 800

 600

 400

 200
  Jan-2003              Jan-2004                Jan-2005             Jan-2006                Jan-2007               Jan-2008               Jan-2009                Jan-2010               Jan-2011               Jan-2012                Jan-2013


                         All data from MLS Property Information Network, Inc. Provided by the Greater Boston Association of REALTORS® and the Massachusetts Association of REALTORS®. Powered by 10K Research and Marketing. | Click for Cover Page | 4
Median Sales Price
Median price point for all closed sales, not accounting for seller concessions, in a given month.


February                                                                       Year to Date                                                                                            Single-Family
                                                                                                                                                                                                            YoY
                                                                                                                                                                                                           Change
                                                                                                                                                                                                                        Condominium
                                                                                                                                                                                                                                             YoY
                                                                                                                                                                                                                                            Change

                                                                                                                                                                      Mar-2012           $414,838          - 1.5%         $340,000          + 4.6%
                                                                                                                                                                      Apr-2012           $418,500          - 2.9%         $371,500          + 4.6%
                         $429,900                                                                       $430,000
                                                                                    $409,130 $402,000                                                                 May-2012           $465,000          + 1.4%         $381,000          + 4.4%
              $395,000
   $380,000
                                                  $370,000
                                       $348,500              $350,750                                                   $350,000
                                                                                                                                   $360,000 $360,000                  Jun-2012           $503,250          - 0.3%         $400,000          + 6.7%
                                                                                                                                                                      Jul-2012           $510,000          + 2.0%         $387,000          + 6.3%
                                                                                                                                                                      Aug-2012           $490,000          - 1.8%         $380,000          + 3.0%
                                                                                                                                                                      Sep-2012           $430,475          - 4.3%         $375,000          + 2.0%
                                                                                                                                                                      Oct-2012           $430,000         + 10.3%         $366,265          + 5.1%
                                                                                                                                                                      Nov-2012           $447,500          + 5.8%         $380,000          + 8.4%
                                                                                                                                                                      Dec-2012           $470,000          + 6.8%         $382,000         + 10.7%
                                                                                                                                                                      Jan-2013           $430,000          + 6.2%         $370,000          + 4.2%
     2011        2012     2013           2011       2012       2013                  2011       2012      2013            2011       2012       2013
                                                                                                                                                                      Feb-2013           $429,900          + 8.8%         $350,750           - 5.2%
               +3.9%     +8.8%                     +6.2%      -5.2%                            -1.7%     +7.0%                      +2.9%      0.0%
                                                                                                                                                                      Median             $461,000          + 2.4%         $379,000          + 5.3%
       Single-Family                        Condominium                                 Single-Family                        Condominium


Historical Median Sales Price                                                                                                                                                  Single-Family                        Condominium
$550,000


$500,000


$450,000


$400,000


$350,000


$300,000


$250,000
      Jan-2003              Jan-2004              Jan-2005               Jan-2006              Jan-2007               Jan-2008               Jan-2009              Jan-2010               Jan-2011               Jan-2012               Jan-2013


                          All data from MLS Property Information Network, Inc. Provided by the Greater Boston Association of REALTORS® and the Massachusetts Association of REALTORS®. Powered by 10K Research and Marketing. | Click for Cover Page | 5
Housing Affordability Index
This index measures housing affordability for the region. An index of 120 means the median household income was 120% of what is necessary
to qualify for the median-priced home under prevailing interest rates. A higher number means greater affordability.


February                                                                   Year to Date                                                                                            Single-Family
                                                                                                                                                                                                        YoY
                                                                                                                                                                                                       Change
                                                                                                                                                                                                                    Condominium
                                                                                                                                                                                                                                         YoY
                                                                                                                                                                                                                                        Change

                                                          146                                                                              143                    Mar-2012               117          + 15.8%             141           + 9.5%
                                                132                                                                              135                              Apr-2012               118          + 18.1%             132          + 10.2%
             124      122                                                                  122        122
                                     120                                                                              119                                         May-2012               109          + 13.2%             131          + 10.1%
      111
                                                                                 104                                                                              Jun-2012               102          + 14.4%             126           + 7.4%
                                                                                                                                                                  Jul-2012               102          + 13.9%             131           + 9.5%
                                                                                                                                                                  Aug-2012               105          + 14.0%             133           + 9.0%
                                                                                                                                                                  Sep-2012               121          + 17.2%             137          + 10.4%
                                                                                                                                                                  Oct-2012               120           + 3.2%             139           + 7.8%
                                                                                                                                                                  Nov-2012               117           + 6.8%             135           + 4.4%
                                                                                                                                                                  Dec-2012               113           + 6.8%             136           + 3.3%
                                                                                                                                                                  Jan-2013               125           + 3.7%             143           + 5.4%
      2011    2012    2013           2011       2012       2013                  2011       2012      2013            2011       2012       2013
                                                                                                                                                                  Feb-2013               122           - 2.0%             146          + 11.0%
             +12.2%   -2.0%                    +10.0%    +11.0%                           +17.9%      -0.6%                     +13.0%     +6.1%
                                                                                                                                                                  Average                114           +10.4%             136            +8.2%
        Single-Family                   Condominium                                 Single-Family                        Condominium


Historical Housing Affordability Index                                                                                                                                 Single-Family                          Condominium
160

150

140

130

120

110

100

 90

 80

 70

 60
 Jan-2004             Jan-2005                 Jan-2006                  Jan-2007                  Jan-2008                  Jan-2009                  Jan-2010                  Jan-2011                  Jan-2012                  Jan-2013


                      All data from MLS Property Information Network, Inc. Provided by the Greater Boston Association of REALTORS® and the Massachusetts Association of REALTORS®. Powered by 10K Research and Marketing. | Click for Cover Page | 6
Inventory of Homes for Sale
The number of properties available for sale in active status at the end of a given month.


February                                                                                                                                                                            Single-Family
                                                                                                                                                                                                         YoY
                                                                                                                                                                                                        Change
                                                                                                                                                                                                                     Condominium
                                                                                                                                                                                                                                          YoY
                                                                                                                                                                                                                                         Change

                                                                                                                                                                   Mar-2012              4,668          + 2.1%            3,691          - 21.1%
                                 4,040                                                  3,909                                                                      Apr-2012              5,018          - 4.4%            3,844          - 25.7%
              3,785
                                                                                                                                                                   May-2012              5,115          - 9.7%            3,657          - 29.8%
                                                                                                             3,257                                                 Jun-2012              4,797          - 15.2%           3,392          - 33.4%
                                                                                                                                                                   Jul-2012              4,372          - 20.7%           3,128          - 33.5%
                                                    2,592
                                                                                                                                                                   Aug-2012              4,026          - 23.9%           2,729          - 35.2%
                                                                                                                                 1,915                             Sep-2012              4,232          - 24.1%           2,850          - 34.0%
                                                                                                                                                                   Oct-2012              3,947          - 26.1%           2,618          - 36.0%
                                                                                                                                                                   Nov-2012              3,319          - 26.8%           2,218          - 38.2%
                                                                                                                                                                   Dec-2012              2,480          - 31.3%           1,674          - 40.5%
                                                                                                                                                                   Jan-2013              2,486          - 31.9%           1,754          - 41.0%
              2011               2012                2013                                 2011                2012                 2013                            Feb-2013              2,592          - 35.8%           1,915          - 41.2%
                             +6.7%                 -35.8%                                                 -16.7%                -41.2%                             Average               3,921          - 19.8%           2,789          - 33.2%
                          Single-Family                                                                Condominium


Historical Inventory of Homes for Sale                                                                                                                                     Single-Family                         Condominium
9,000

8,000

7,000

6,000

5,000

4,000

3,000

2,000

1,000
   Jan-2003           Jan-2004              Jan-2005               Jan-2006               Jan-2007               Jan-2008               Jan-2009               Jan-2010                Jan-2011               Jan-2012               Jan-2013


                       All data from MLS Property Information Network, Inc. Provided by the Greater Boston Association of REALTORS® and the Massachusetts Association of REALTORS®. Powered by 10K Research and Marketing. | Click for Cover Page | 7
Months Supply of Inventory
The inventory of homes for sale at the end of a given month, divided by the average monthly pending sales from the last 12 months.


February                                                                                                                                                                          Single-Family
                                                                                                                                                                                                       YoY
                                                                                                                                                                                                      Change
                                                                                                                                                                                                                   Condominium
                                                                                                                                                                                                                                        YoY
                                                                                                                                                                                                                                       Change

                                                                                                                                                                 Mar-2012               7.2           - 12.4%            6.1           - 28.9%
                                                                                       11.4                                                                      Apr-2012               6.8           - 15.1%            5.1           - 38.1%
             10.8
                                                                                                                                                                 May-2012               5.1           - 25.1%            3.6           - 46.9%
                                                                                                                                                                 Jun-2012               3.2           - 30.1%            2.7           - 44.6%
                                8.7                                                                          8.5
                                                                                                                                                                 Jul-2012               3.4           - 36.7%            3.0           - 45.3%
                                                                                                                                                                 Aug-2012               3.1           - 39.6%            2.3           - 48.3%
                                                    6.0
                                                                                                                                                                 Sep-2012               5.5           - 23.2%            3.8           - 43.3%
                                                                                                                                 4.5                             Oct-2012               5.0           - 42.5%            3.7           - 53.9%
                                                                                                                                                                 Nov-2012               3.7           - 44.8%            2.9           - 54.3%
                                                                                                                                                                 Dec-2012               3.0           - 38.5%            2.2           - 50.1%
                                                                                                                                                                 Jan-2013               4.1           - 41.0%            3.4           - 52.4%
             2011               2012               2013                                 2011                2012                2013                             Feb-2013               6.0           - 30.6%            4.5           - 46.9%
                           -19.3%                -30.6%                                                -25.8%                 -46.9%                             Average                4.7           - 29.3%            3.8           - 41.0%
                        Single-Family                                                                Condominium


Historical Months Supply of Inventory                                                                                                                                 Single-Family                          Condominium
16

14

12

10

 8

 6

 4

 2

 0
Jan-2004             Jan-2005                 Jan-2006                  Jan-2007                  Jan-2008                  Jan-2009                  Jan-2010                  Jan-2011                  Jan-2012                  Jan-2013


                     All data from MLS Property Information Network, Inc. Provided by the Greater Boston Association of REALTORS® and the Massachusetts Association of REALTORS®. Powered by 10K Research and Marketing. | Click for Cover Page | 8
Days on Market Until Sale
Average number of days between when a property is listed and when an offer is accepted in a given month.


February                                                                    Year to Date                                                                                            Single-Family
                                                                                                                                                                                                         YoY
                                                                                                                                                                                                        Change
                                                                                                                                                                                                                     Condominium
                                                                                                                                                                                                                                          YoY
                                                                                                                                                                                                                                         Change

                                                                                                                                                                   Mar-2012               130           - 3.1%             117            - 4.6%
                                                                                                                                                                   Apr-2012               120           - 1.7%              98           - 16.8%
             134                      137                                                                              134
      129                                                                                   132                                                                    May-2012               96            - 5.9%              86           - 11.9%
                                                 123                              120                                             124
                                                                                                                                                                   Jun-2012               90            - 0.2%              75           - 20.4%
                      109                                                                              109
                                                                                                                                                                   Jul-2012               80            - 3.9%              71           - 20.6%
                                                            93                                                                               90
                                                                                                                                                                   Aug-2012               87            - 5.8%              76           - 18.2%
                                                                                                                                                                   Sep-2012               89            - 12.0%             85           - 18.1%
                                                                                                                                                                   Oct-2012               90            - 17.6%             84           - 11.4%
                                                                                                                                                                   Nov-2012               89            - 18.0%             77           - 30.0%
                                                                                                                                                                   Dec-2012               97            - 12.4%             84           - 30.1%
                                                                                                                                                                   Jan-2013               109           - 16.5%             88           - 29.2%
      2011   2012     2013            2011       2012      2013                   2011      2012       2013            2011       2012       2013
                                                                                                                                                                   Feb-2013               109           - 18.6%             93           - 24.6%
             +3.7%    -18.6%                     -9.8%    -24.6%                            +9.7%     -17.5%                      -7.1%     -27.1%
                                                                                                                                                                   Total                  96            - 9.3%              78           - 18.2%
        Single-Family                    Condominium                                 Single-Family                        Condominium


Historical Days on Market Until Sale                                                                                                                                       Single-Family                        Condominium
160


140


120


100


 80


 60


 40
 Jan-2003            Jan-2004                Jan-2005              Jan-2006               Jan-2007               Jan-2008                 Jan-2009              Jan-2010               Jan-2011               Jan-2012                Jan-2013


                       All data from MLS Property Information Network, Inc. Provided by the Greater Boston Association of REALTORS® and the Massachusetts Association of REALTORS®. Powered by 10K Research and Marketing. | Click for Cover Page | 9
Percent of Original List Price Received
Percentage found when dividing a property’s sales price by its original list price, then taking the average for all properties sold in a given month,
not accounting for seller concessions.


February                                                                      Year to Date                                                                                          Single-Family
                                                                                                                                                                                                         YoY
                                                                                                                                                                                                        Change
                                                                                                                                                                                                                     Condominium
                                                                                                                                                                                                                                          YoY
                                                                                                                                                                                                                                         Change

                                                                                                                                                                   Mar-2012             93.0%           + 0.7%           94.0%           + 0.9%
                                                                                                                                                                   Apr-2012             93.5%           + 0.8%           95.7%           + 2.0%

                94.1%                                     96.8%                                                                            96.3%                   May-2012             95.4%           + 1.1%           96.1%           + 1.0%
    90.9% 91.2%                      92.0% 93.4%                                90.9% 90.8% 93.9%                     92.2% 93.2%
                                                                                                                                                                   Jun-2012             95.3%           + 0.8%           96.4%           + 1.8%
                                                                                                                                                                   Jul-2012             95.8%           + 1.6%           96.6%           + 1.7%
                                                                                                                                                                   Aug-2012             94.8%           + 1.5%           96.3%           + 2.2%
                                                                                                                                                                   Sep-2012             94.6%           + 1.5%           96.4%           + 2.3%
                                                                                                                                                                   Oct-2012             94.3%           + 2.8%           95.9%           + 2.5%
                                                                                                                                                                   Nov-2012             94.6%           + 2.3%           96.2%           + 2.5%
                                                                                                                                                                   Dec-2012             94.2%           + 2.2%           96.2%           + 3.4%
                                                                                                                                                                   Jan-2013             93.8%           + 3.6%           96.0%           + 3.3%
      2011    2012     2013           2011       2012       2013                  2011       2012      2013            2011       2012       2013
                                                                                                                                                                   Feb-2013             94.1%           + 3.2%           96.8%           + 3.6%
             +0.3%    +3.2%                      +1.5%     +3.6%                            -0.1%      +3.4%                     +1.1%      +3.4%
                                                                                                                                                                   Average              94.7%           + 1.7%           96.1%           + 2.2%
        Single-Family                    Condominium                                 Single-Family                        Condominium


Historical Percent of Original List Price Received                                                                                                                          Single-Family                        Condominium
99%

98%

97%

96%

95%

94%

93%

92%

91%

90%

89%
  Jan-2003           Jan-2004             Jan-2005                 Jan-2006              Jan-2007              Jan-2008               Jan-2009               Jan-2010               Jan-2011              Jan-2012               Jan-2013


                      All data from MLS Property Information Network, Inc. Provided by the Greater Boston Association of REALTORS® and the Massachusetts Association of REALTORS®. Powered by 10K Research and Marketing. | Click for Cover Page | 10
Pending Sales
A count of the properties in UAG status between the first and last day in a given month, regardless of current status (based on Off Market Date).


February                                                                      Year to Date                                                                                            Single-Family
                                                                                                                                                                                                           YoY
                                                                                                                                                                                                          Change
                                                                                                                                                                                                                       Condominium
                                                                                                                                                                                                                                            YoY
                                                                                                                                                                                                                                           Change

                                                                                                                                                                     Mar-2012               982          + 25.1%            1,009         + 32.2%
                                                                                                        1,269                                1,263                   Apr-2012              1,142         + 21.7%            1,047         + 24.6%
                         683                                                                 1,179
               639                                 635        644                                                                 1,118                              May-2012              1,326         + 23.1%            1,266         + 28.9%
                                                                                                                                                                     Jun-2012              1,255         + 13.3%            1,039         + 19.3%
        523                                                                         946                                  918
                                        511                                                                                                                          Jul-2012              1,044         + 26.2%             831           + 9.1%
                                                                                                                                                                     Aug-2012               895          + 17.0%             815          + 22.2%
                                                                                                                                                                     Sep-2012               840          + 27.7%             717          + 38.4%
                                                                                                                                                                     Oct-2012               869          + 17.8%             820          + 38.7%
                                                                                                                                                                     Nov-2012               787          + 16.6%             664          + 18.1%
                                                                                                                                                                     Dec-2012               596           + 5.9%             503           + 7.5%
                                                                                                                                                                     Jan-2013               586           + 8.5%             619          + 28.2%
        2011    2012     2013           2011       2012       2013                  2011       2012      2013            2011       2012       2013
                                                                                                                                                                     Feb-2013               683           + 6.9%             644           + 1.4%
               +22.2%   +6.9%                     +24.3%     +1.4%                            +24.6%    +7.6%                     +21.8%     +13.0%
                                                                                                                                                                     Total                11,005         + 18.2%            9,974         + 22.5%
          Single-Family                    Condominium                                 Single-Family                        Condominium


Historical Pending Sales Activity                                                                                                                                            Single-Family                        Condominium
1,400


1,200


1,000


 800


 600


 400


 200
  Jan-2003              Jan-2004               Jan-2005               Jan-2006               Jan-2007               Jan-2008               Jan-2009                Jan-2010               Jan-2011               Jan-2012                Jan-2013


                        All data from MLS Property Information Network, Inc. Provided by the Greater Boston Association of REALTORS® and the Massachusetts Association of REALTORS®. Powered by 10K Research and Marketing. | Click for Cover Page | 11
New Listings
A count of the properties that have been newly listed on the market in a given month.


February                                                                      Year to Date                                                                                            Single-Family
                                                                                                                                                                                                           YoY
                                                                                                                                                                                                          Change
                                                                                                                                                                                                                       Condominium
                                                                                                                                                                                                                                            YoY
                                                                                                                                                                                                                                           Change

                                                                                                                                                                     Mar-2012              2,008          + 3.3%            1,741          - 11.7%
               1,319
                                                                                             2,282                                                                   Apr-2012              1,798          - 8.8%            1,499          - 13.0%
                                                  1,141                                                                 2,055 2,095                                  May-2012              1,783          - 4.6%            1,387           - 7.6%
                                       1,081                                                            1,929                                1,878
                        1,026                                                                                                                                        Jun-2012              1,352          - 15.3%           1,152          - 14.2%
                                                              964                  1,716
        879                                                                                                                                                          Jul-2012              1,022          - 12.5%            902            - 7.6%
                                                                                                                                                                     Aug-2012              1,001          - 8.7%             790            - 7.5%
                                                                                                                                                                     Sep-2012              1,419          - 10.2%           1,153           - 9.6%
                                                                                                                                                                     Oct-2012              1,078          - 4.6%             881            - 2.1%
                                                                                                                                                                     Nov-2012               650           - 3.1%             561           - 10.4%
                                                                                                                                                                     Dec-2012               364           - 19.5%            317           - 18.3%
                                                                                                                                                                     Jan-2013               903           - 6.2%             914            - 4.2%
        2011    2012     2013           2011       2012       2013                  2011       2012      2013            2011       2012       2013
                                                                                                                                                                     Feb-2013              1,026          - 22.2%            964           - 15.5%
               +50.1%   -22.2%                     +5.6%     -15.5%                           +33.0%   -15.5%                      +1.9%      -10.4%
                                                                                                                                                                     Total                14,404          - 8.6%           12,261          - 10.2%
          Single-Family                    Condominium                                 Single-Family                        Condominium


Historical New Listing Activity                                                                                                                                                  Single-Family                       Condominium
2,750

2,500

2,250

2,000

1,750

1,500

1,250

1,000

 750

 500

 250

   0
  Jan-2003              Jan-2004               Jan-2005               Jan-2006              Jan-2007               Jan-2008                Jan-2009              Jan-2010                Jan-2011               Jan-2012               Jan-2013


                        All data from MLS Property Information Network, Inc. Provided by the Greater Boston Association of REALTORS® and the Massachusetts Association of REALTORS®. Powered by 10K Research and Marketing. | Click for Cover Page | 12
City of Boston – Market Overview
Key market metrics for the current month and year-to-date figures for the City of Boston.


 Key Metrics                                             Historical Sparklines                                                            Feb-2012 Feb-2013                       +/–           YTD 2012 YTD 2013                      +/–


 Closed Sales                                                                                                                                  203              221             + 8.9%              444               490            + 10.4%
                                                        2-2010                  2-2011                  2-2012                  2-2013


 Median Sales Price                                                                                                                       $399,000          $385,000            - 3.5%          $386,500          $406,750            + 5.2%
                                                        2-2010                  2-2011                  2-2012                  2-2013


 Housing Affordability Index                                                                                                                   124              122             - 2.0%              122               122             - 0.6%
                                                        2-2010                  2-2011                  2-2012                  2-2013


 Inventory of Homes for Sale                                                                                                                 1,725              949            - 45.0%                --                --                --
                                                        2-2010
                                                        2 2010                  2-2011
                                                                                2 2011                  2-2012
                                                                                                        2 2012                  2-2013
                                                                                                                                2 2013


 Months Supply of Inventory                                                                                                                    8.5               4.3           - 49.5%                --                --                --
                                                        2-2010                  2-2011                  2-2012                  2-2013


 Days on Market Until Sale                                                                                                                     120               80            - 33.4%              120                78            - 35.1%
                                                        2-2010                  2-2011                  2-2012                  2-2013


 Percent of Original
                                                                                                                                            93.9%             96.9%             + 3.2%            93.4%             96.6%             + 3.5%
 List Price Received
                                                        2-2010                  2-2011                  2-2012                  2-2013


 Pending Sales                                                                                                                                 362              376             + 3.9%              629               681             + 8.3%
                                                        2-2010                  2-2011                  2-2012                  2-2013


 New Listings                                                                                                                                  648              570            - 12.0%             1,217             1,054           - 13.4%
                                                        2-2010                  2-2011                  2-2012                  2-2013


                     All data from MLS Property Information Network, Inc. Provided by the Greater Boston Association of REALTORS® and the Massachusetts Association of REALTORS®. Powered by 10K Research and Marketing. | Click for Cover Page | 13

Mais conteúdo relacionado

Mais procurados

This Month in Real Estate for Canada - December 2011
This Month in Real Estate for Canada - December 2011This Month in Real Estate for Canada - December 2011
This Month in Real Estate for Canada - December 2011Keller Williams Careers
 
Market Watch for Toronto June 2011
Market Watch for Toronto June 2011Market Watch for Toronto June 2011
Market Watch for Toronto June 2011Brent Reid
 
Toronto real estate statistics august 2011
Toronto real estate statistics august 2011Toronto real estate statistics august 2011
Toronto real estate statistics august 2011John Helfrich
 
Greater Princeton NJ Real Estate Market Update 1 31 13
Greater Princeton NJ Real Estate Market Update 1 31 13Greater Princeton NJ Real Estate Market Update 1 31 13
Greater Princeton NJ Real Estate Market Update 1 31 13Ann Harwood
 
Market Watch July 2010
Market Watch July 2010Market Watch July 2010
Market Watch July 2010Derek Cardona
 
The Nest Report Q1 2012
The Nest Report Q1 2012The Nest Report Q1 2012
The Nest Report Q1 2012Jeremy Hart
 
11.08.2011 jpm
11.08.2011 jpm11.08.2011 jpm
11.08.2011 jpmgcutte
 
Hyre Weekly Commentary
Hyre Weekly CommentaryHyre Weekly Commentary
Hyre Weekly Commentaryhyrejam
 
Economy And Apartment Outlook - May 2011
Economy And Apartment Outlook - May 2011Economy And Apartment Outlook - May 2011
Economy And Apartment Outlook - May 2011jdpackwood
 
Hotel Data Conference: Holy Recovery, Batman
Hotel Data Conference: Holy Recovery, BatmanHotel Data Conference: Holy Recovery, Batman
Hotel Data Conference: Holy Recovery, BatmanJan Freitag
 
The Nest Report Q2 2012
The Nest Report Q2 2012The Nest Report Q2 2012
The Nest Report Q2 2012Jeremy Hart
 
5th Annual Appraisal Summit
5th Annual Appraisal Summit5th Annual Appraisal Summit
5th Annual Appraisal SummitNVAR .com
 
Construction White Paper
Construction White PaperConstruction White Paper
Construction White PaperBob Lowery
 

Mais procurados (16)

This Month in Real Estate for Canada - December 2011
This Month in Real Estate for Canada - December 2011This Month in Real Estate for Canada - December 2011
This Month in Real Estate for Canada - December 2011
 
Market Watch for Toronto June 2011
Market Watch for Toronto June 2011Market Watch for Toronto June 2011
Market Watch for Toronto June 2011
 
Collateral
CollateralCollateral
Collateral
 
Goldman
GoldmanGoldman
Goldman
 
Toronto real estate statistics august 2011
Toronto real estate statistics august 2011Toronto real estate statistics august 2011
Toronto real estate statistics august 2011
 
Greater Princeton NJ Real Estate Market Update 1 31 13
Greater Princeton NJ Real Estate Market Update 1 31 13Greater Princeton NJ Real Estate Market Update 1 31 13
Greater Princeton NJ Real Estate Market Update 1 31 13
 
Toronto Real Estate Market Watch July 2010
Toronto Real Estate Market Watch July 2010Toronto Real Estate Market Watch July 2010
Toronto Real Estate Market Watch July 2010
 
Market Watch July 2010
Market Watch July 2010Market Watch July 2010
Market Watch July 2010
 
The Nest Report Q1 2012
The Nest Report Q1 2012The Nest Report Q1 2012
The Nest Report Q1 2012
 
11.08.2011 jpm
11.08.2011 jpm11.08.2011 jpm
11.08.2011 jpm
 
Hyre Weekly Commentary
Hyre Weekly CommentaryHyre Weekly Commentary
Hyre Weekly Commentary
 
Economy And Apartment Outlook - May 2011
Economy And Apartment Outlook - May 2011Economy And Apartment Outlook - May 2011
Economy And Apartment Outlook - May 2011
 
Hotel Data Conference: Holy Recovery, Batman
Hotel Data Conference: Holy Recovery, BatmanHotel Data Conference: Holy Recovery, Batman
Hotel Data Conference: Holy Recovery, Batman
 
The Nest Report Q2 2012
The Nest Report Q2 2012The Nest Report Q2 2012
The Nest Report Q2 2012
 
5th Annual Appraisal Summit
5th Annual Appraisal Summit5th Annual Appraisal Summit
5th Annual Appraisal Summit
 
Construction White Paper
Construction White PaperConstruction White Paper
Construction White Paper
 

Destaque

S&OP What Works What Doesnt V2
S&OP What Works What Doesnt V2S&OP What Works What Doesnt V2
S&OP What Works What Doesnt V2jkirchner
 
Sales and Operations Planning - S and OP, IBP, IBF -- A View of Sales & Ops P...
Sales and Operations Planning - S and OP, IBP, IBF -- A View of Sales & Ops P...Sales and Operations Planning - S and OP, IBP, IBF -- A View of Sales & Ops P...
Sales and Operations Planning - S and OP, IBP, IBF -- A View of Sales & Ops P...Jim Biel
 
S&op process template
S&op process templateS&op process template
S&op process templateLuke Lenahan
 

Destaque (6)

S&OP What Works What Doesnt V2
S&OP What Works What Doesnt V2S&OP What Works What Doesnt V2
S&OP What Works What Doesnt V2
 
Sales and Operations Planning - S and OP, IBP, IBF -- A View of Sales & Ops P...
Sales and Operations Planning - S and OP, IBP, IBF -- A View of Sales & Ops P...Sales and Operations Planning - S and OP, IBP, IBF -- A View of Sales & Ops P...
Sales and Operations Planning - S and OP, IBP, IBF -- A View of Sales & Ops P...
 
Poer point la materia
Poer point la materiaPoer point la materia
Poer point la materia
 
S&op process template
S&op process templateS&op process template
S&op process template
 
Store management
Store managementStore management
Store management
 
SAP Production Planning
SAP Production PlanningSAP Production Planning
SAP Production Planning
 

Semelhante a February 2013's Monthly Indicators report - Boston Real Estate Market Trends

Greater Boston Real Estate Market Data, September 2012
Greater Boston Real Estate Market Data, September 2012Greater Boston Real Estate Market Data, September 2012
Greater Boston Real Estate Market Data, September 2012Unit Realty Group
 
Residential Sales Report - December 2011
Residential Sales Report - December 2011Residential Sales Report - December 2011
Residential Sales Report - December 2011Team Price Real Estate
 
Charleston Real Estate Sales
Charleston Real Estate SalesCharleston Real Estate Sales
Charleston Real Estate SalesSteve DeGuzman
 
Monthly Real Estate Indicators: Twin Cities Housing Market Info & Statistics
Monthly Real Estate Indicators: Twin Cities Housing Market Info & StatisticsMonthly Real Estate Indicators: Twin Cities Housing Market Info & Statistics
Monthly Real Estate Indicators: Twin Cities Housing Market Info & Statisticspattiann
 
Greater Princeton NJ Real Estate Market October 2012
Greater Princeton NJ Real Estate Market October 2012Greater Princeton NJ Real Estate Market October 2012
Greater Princeton NJ Real Estate Market October 2012Ann Harwood
 
This Month in Real Estate - Sept 2011
This Month in Real Estate - Sept  2011This Month in Real Estate - Sept  2011
This Month in Real Estate - Sept 2011pdrury
 
John Helfrich Real Estate Newsletter January February 2012
John Helfrich Real Estate Newsletter January February 2012John Helfrich Real Estate Newsletter January February 2012
John Helfrich Real Estate Newsletter January February 2012John Helfrich
 
RICS Property World pgs5 8
RICS Property World pgs5 8RICS Property World pgs5 8
RICS Property World pgs5 8RICS Americas
 
Real Estate Capital Markets Are Alive, If Not Quite Well
Real Estate Capital Markets Are Alive, If Not Quite WellReal Estate Capital Markets Are Alive, If Not Quite Well
Real Estate Capital Markets Are Alive, If Not Quite WellDan Hutchins
 
7%20 reasons%20why%20to%20buy%20now
7%20 reasons%20why%20to%20buy%20now7%20 reasons%20why%20to%20buy%20now
7%20 reasons%20why%20to%20buy%20nowAlbert Laing
 
Arbor Single Family Rentals Report 2020 Q1
Arbor Single Family Rentals Report 2020 Q1Arbor Single Family Rentals Report 2020 Q1
Arbor Single Family Rentals Report 2020 Q1Ivan Kaufman
 
Multifamily Market Snapshot (2 Q12)
Multifamily Market Snapshot (2 Q12)Multifamily Market Snapshot (2 Q12)
Multifamily Market Snapshot (2 Q12)jasonwtolliver
 

Semelhante a February 2013's Monthly Indicators report - Boston Real Estate Market Trends (20)

Greater Boston Real Estate Market Data, September 2012
Greater Boston Real Estate Market Data, September 2012Greater Boston Real Estate Market Data, September 2012
Greater Boston Real Estate Market Data, September 2012
 
Market Data, December 2012
Market Data, December 2012Market Data, December 2012
Market Data, December 2012
 
Residential Sales Report - December 2011
Residential Sales Report - December 2011Residential Sales Report - December 2011
Residential Sales Report - December 2011
 
Charleston Real Estate Sales
Charleston Real Estate SalesCharleston Real Estate Sales
Charleston Real Estate Sales
 
Monthly Real Estate Indicators: Twin Cities Housing Market Info & Statistics
Monthly Real Estate Indicators: Twin Cities Housing Market Info & StatisticsMonthly Real Estate Indicators: Twin Cities Housing Market Info & Statistics
Monthly Real Estate Indicators: Twin Cities Housing Market Info & Statistics
 
Greater Princeton NJ Real Estate Market October 2012
Greater Princeton NJ Real Estate Market October 2012Greater Princeton NJ Real Estate Market October 2012
Greater Princeton NJ Real Estate Market October 2012
 
Rei0410
Rei0410Rei0410
Rei0410
 
This Month in Real Estate - Sept 2011
This Month in Real Estate - Sept  2011This Month in Real Estate - Sept  2011
This Month in Real Estate - Sept 2011
 
John Helfrich Real Estate Newsletter January February 2012
John Helfrich Real Estate Newsletter January February 2012John Helfrich Real Estate Newsletter January February 2012
John Helfrich Real Estate Newsletter January February 2012
 
Cre finance council (june 2012)
Cre finance council (june 2012)Cre finance council (june 2012)
Cre finance council (june 2012)
 
RICS Property World pgs5 8
RICS Property World pgs5 8RICS Property World pgs5 8
RICS Property World pgs5 8
 
Realtor Report for July 2020
Realtor Report for July 2020Realtor Report for July 2020
Realtor Report for July 2020
 
April Realtor Report
April Realtor ReportApril Realtor Report
April Realtor Report
 
Real Estate Capital Markets Are Alive, If Not Quite Well
Real Estate Capital Markets Are Alive, If Not Quite WellReal Estate Capital Markets Are Alive, If Not Quite Well
Real Estate Capital Markets Are Alive, If Not Quite Well
 
7%20 reasons%20why%20to%20buy%20now
7%20 reasons%20why%20to%20buy%20now7%20 reasons%20why%20to%20buy%20now
7%20 reasons%20why%20to%20buy%20now
 
Arbor Single Family Rentals Report 2020 Q1
Arbor Single Family Rentals Report 2020 Q1Arbor Single Family Rentals Report 2020 Q1
Arbor Single Family Rentals Report 2020 Q1
 
Month in-review-february-2013
Month in-review-february-2013Month in-review-february-2013
Month in-review-february-2013
 
Month in-review-february-2013
Month in-review-february-2013Month in-review-february-2013
Month in-review-february-2013
 
7 reasons
7 reasons7 reasons
7 reasons
 
Multifamily Market Snapshot (2 Q12)
Multifamily Market Snapshot (2 Q12)Multifamily Market Snapshot (2 Q12)
Multifamily Market Snapshot (2 Q12)
 

Mais de Unit Realty Group

December 2015 multi family housing activity report – boston, ma real estate
December 2015 multi family housing activity report – boston, ma real estateDecember 2015 multi family housing activity report – boston, ma real estate
December 2015 multi family housing activity report – boston, ma real estateUnit Realty Group
 
October 2015 Greater Boston Real Estate Market Trends Report
October 2015 Greater Boston Real Estate Market Trends ReportOctober 2015 Greater Boston Real Estate Market Trends Report
October 2015 Greater Boston Real Estate Market Trends ReportUnit Realty Group
 
September 2015 Greater Boston Real Estate Market Trends Report
September 2015 Greater Boston Real Estate Market Trends ReportSeptember 2015 Greater Boston Real Estate Market Trends Report
September 2015 Greater Boston Real Estate Market Trends ReportUnit Realty Group
 
August 2015 Greater Boston Real Estate Market Trends Report
August 2015 Greater Boston Real Estate Market Trends ReportAugust 2015 Greater Boston Real Estate Market Trends Report
August 2015 Greater Boston Real Estate Market Trends ReportUnit Realty Group
 
February 2015 Greater Boston Real Estate Market Trends Report
February 2015 Greater Boston Real Estate Market Trends ReportFebruary 2015 Greater Boston Real Estate Market Trends Report
February 2015 Greater Boston Real Estate Market Trends ReportUnit Realty Group
 
January 2015′s Monthly Multi-family Housing Activity Report
January 2015′s Monthly Multi-family Housing Activity ReportJanuary 2015′s Monthly Multi-family Housing Activity Report
January 2015′s Monthly Multi-family Housing Activity ReportUnit Realty Group
 
January 2015 Greater Boston Real Estate Market Trends Report
January 2015 Greater Boston Real Estate Market Trends ReportJanuary 2015 Greater Boston Real Estate Market Trends Report
January 2015 Greater Boston Real Estate Market Trends ReportUnit Realty Group
 
December 2014 Greater Boston Real Estate Market Trends Report
December 2014 Greater Boston Real Estate Market Trends ReportDecember 2014 Greater Boston Real Estate Market Trends Report
December 2014 Greater Boston Real Estate Market Trends ReportUnit Realty Group
 
November 2014 Greater Boston Real Estate Market Trends Report
November 2014 Greater Boston Real Estate Market Trends ReportNovember 2014 Greater Boston Real Estate Market Trends Report
November 2014 Greater Boston Real Estate Market Trends ReportUnit Realty Group
 
November 2014 Multi-family Housing Activity Report – Boston, MA Real Estate
November 2014 Multi-family Housing Activity Report – Boston, MA Real EstateNovember 2014 Multi-family Housing Activity Report – Boston, MA Real Estate
November 2014 Multi-family Housing Activity Report – Boston, MA Real EstateUnit Realty Group
 
October 2014 Greater Boston Real Estate Market Trends Report
October 2014 Greater Boston Real Estate Market Trends ReportOctober 2014 Greater Boston Real Estate Market Trends Report
October 2014 Greater Boston Real Estate Market Trends ReportUnit Realty Group
 
September 2014 Multi-family Housing Activity Report – Boston, MA Real Estate
September 2014 Multi-family Housing Activity Report – Boston, MA Real EstateSeptember 2014 Multi-family Housing Activity Report – Boston, MA Real Estate
September 2014 Multi-family Housing Activity Report – Boston, MA Real EstateUnit Realty Group
 
Boston By The Numbers - Boston Housing Stock (Report)
Boston By The Numbers - Boston Housing Stock (Report)Boston By The Numbers - Boston Housing Stock (Report)
Boston By The Numbers - Boston Housing Stock (Report)Unit Realty Group
 
May 2014 Multi-family Housing Activity Report – Boston, MA Real Estate
May 2014 Multi-family Housing Activity Report – Boston, MA Real EstateMay 2014 Multi-family Housing Activity Report – Boston, MA Real Estate
May 2014 Multi-family Housing Activity Report – Boston, MA Real EstateUnit Realty Group
 
January 2014 Greater Boston Real Estate Market Trends Report
January 2014 Greater Boston Real Estate Market Trends ReportJanuary 2014 Greater Boston Real Estate Market Trends Report
January 2014 Greater Boston Real Estate Market Trends ReportUnit Realty Group
 
November 2013 Multi-family Housing Activity Report – Boston, MA Real Estate
November 2013 Multi-family Housing Activity Report – Boston, MA Real EstateNovember 2013 Multi-family Housing Activity Report – Boston, MA Real Estate
November 2013 Multi-family Housing Activity Report – Boston, MA Real EstateUnit Realty Group
 
October 2013 Multi-family Housing Activity Report – Boston, MA Real Estate
October 2013 Multi-family Housing Activity Report – Boston, MA Real EstateOctober 2013 Multi-family Housing Activity Report – Boston, MA Real Estate
October 2013 Multi-family Housing Activity Report – Boston, MA Real EstateUnit Realty Group
 
September 2013 Multifamily Housing Activity Report – Boston, MA Real Estate
September 2013 Multifamily Housing Activity Report – Boston, MA Real EstateSeptember 2013 Multifamily Housing Activity Report – Boston, MA Real Estate
September 2013 Multifamily Housing Activity Report – Boston, MA Real EstateUnit Realty Group
 
August 2013 Multifamily Housing Activity Report – Boston, MA Real Estate
August 2013 Multifamily Housing Activity Report – Boston, MA Real EstateAugust 2013 Multifamily Housing Activity Report – Boston, MA Real Estate
August 2013 Multifamily Housing Activity Report – Boston, MA Real EstateUnit Realty Group
 
July 2013 Multifamily Housing Activity Report – Boston, MA Real Estate
July 2013 Multifamily Housing Activity Report – Boston, MA Real EstateJuly 2013 Multifamily Housing Activity Report – Boston, MA Real Estate
July 2013 Multifamily Housing Activity Report – Boston, MA Real EstateUnit Realty Group
 

Mais de Unit Realty Group (20)

December 2015 multi family housing activity report – boston, ma real estate
December 2015 multi family housing activity report – boston, ma real estateDecember 2015 multi family housing activity report – boston, ma real estate
December 2015 multi family housing activity report – boston, ma real estate
 
October 2015 Greater Boston Real Estate Market Trends Report
October 2015 Greater Boston Real Estate Market Trends ReportOctober 2015 Greater Boston Real Estate Market Trends Report
October 2015 Greater Boston Real Estate Market Trends Report
 
September 2015 Greater Boston Real Estate Market Trends Report
September 2015 Greater Boston Real Estate Market Trends ReportSeptember 2015 Greater Boston Real Estate Market Trends Report
September 2015 Greater Boston Real Estate Market Trends Report
 
August 2015 Greater Boston Real Estate Market Trends Report
August 2015 Greater Boston Real Estate Market Trends ReportAugust 2015 Greater Boston Real Estate Market Trends Report
August 2015 Greater Boston Real Estate Market Trends Report
 
February 2015 Greater Boston Real Estate Market Trends Report
February 2015 Greater Boston Real Estate Market Trends ReportFebruary 2015 Greater Boston Real Estate Market Trends Report
February 2015 Greater Boston Real Estate Market Trends Report
 
January 2015′s Monthly Multi-family Housing Activity Report
January 2015′s Monthly Multi-family Housing Activity ReportJanuary 2015′s Monthly Multi-family Housing Activity Report
January 2015′s Monthly Multi-family Housing Activity Report
 
January 2015 Greater Boston Real Estate Market Trends Report
January 2015 Greater Boston Real Estate Market Trends ReportJanuary 2015 Greater Boston Real Estate Market Trends Report
January 2015 Greater Boston Real Estate Market Trends Report
 
December 2014 Greater Boston Real Estate Market Trends Report
December 2014 Greater Boston Real Estate Market Trends ReportDecember 2014 Greater Boston Real Estate Market Trends Report
December 2014 Greater Boston Real Estate Market Trends Report
 
November 2014 Greater Boston Real Estate Market Trends Report
November 2014 Greater Boston Real Estate Market Trends ReportNovember 2014 Greater Boston Real Estate Market Trends Report
November 2014 Greater Boston Real Estate Market Trends Report
 
November 2014 Multi-family Housing Activity Report – Boston, MA Real Estate
November 2014 Multi-family Housing Activity Report – Boston, MA Real EstateNovember 2014 Multi-family Housing Activity Report – Boston, MA Real Estate
November 2014 Multi-family Housing Activity Report – Boston, MA Real Estate
 
October 2014 Greater Boston Real Estate Market Trends Report
October 2014 Greater Boston Real Estate Market Trends ReportOctober 2014 Greater Boston Real Estate Market Trends Report
October 2014 Greater Boston Real Estate Market Trends Report
 
September 2014 Multi-family Housing Activity Report – Boston, MA Real Estate
September 2014 Multi-family Housing Activity Report – Boston, MA Real EstateSeptember 2014 Multi-family Housing Activity Report – Boston, MA Real Estate
September 2014 Multi-family Housing Activity Report – Boston, MA Real Estate
 
Boston By The Numbers - Boston Housing Stock (Report)
Boston By The Numbers - Boston Housing Stock (Report)Boston By The Numbers - Boston Housing Stock (Report)
Boston By The Numbers - Boston Housing Stock (Report)
 
May 2014 Multi-family Housing Activity Report – Boston, MA Real Estate
May 2014 Multi-family Housing Activity Report – Boston, MA Real EstateMay 2014 Multi-family Housing Activity Report – Boston, MA Real Estate
May 2014 Multi-family Housing Activity Report – Boston, MA Real Estate
 
January 2014 Greater Boston Real Estate Market Trends Report
January 2014 Greater Boston Real Estate Market Trends ReportJanuary 2014 Greater Boston Real Estate Market Trends Report
January 2014 Greater Boston Real Estate Market Trends Report
 
November 2013 Multi-family Housing Activity Report – Boston, MA Real Estate
November 2013 Multi-family Housing Activity Report – Boston, MA Real EstateNovember 2013 Multi-family Housing Activity Report – Boston, MA Real Estate
November 2013 Multi-family Housing Activity Report – Boston, MA Real Estate
 
October 2013 Multi-family Housing Activity Report – Boston, MA Real Estate
October 2013 Multi-family Housing Activity Report – Boston, MA Real EstateOctober 2013 Multi-family Housing Activity Report – Boston, MA Real Estate
October 2013 Multi-family Housing Activity Report – Boston, MA Real Estate
 
September 2013 Multifamily Housing Activity Report – Boston, MA Real Estate
September 2013 Multifamily Housing Activity Report – Boston, MA Real EstateSeptember 2013 Multifamily Housing Activity Report – Boston, MA Real Estate
September 2013 Multifamily Housing Activity Report – Boston, MA Real Estate
 
August 2013 Multifamily Housing Activity Report – Boston, MA Real Estate
August 2013 Multifamily Housing Activity Report – Boston, MA Real EstateAugust 2013 Multifamily Housing Activity Report – Boston, MA Real Estate
August 2013 Multifamily Housing Activity Report – Boston, MA Real Estate
 
July 2013 Multifamily Housing Activity Report – Boston, MA Real Estate
July 2013 Multifamily Housing Activity Report – Boston, MA Real EstateJuly 2013 Multifamily Housing Activity Report – Boston, MA Real Estate
July 2013 Multifamily Housing Activity Report – Boston, MA Real Estate
 

Último

Everything you ever Wanted to Know about Florida Property Tax Exemptions.pdf
Everything you ever Wanted to Know about Florida Property Tax Exemptions.pdfEverything you ever Wanted to Know about Florida Property Tax Exemptions.pdf
Everything you ever Wanted to Know about Florida Property Tax Exemptions.pdfTim Wilmath
 
DLF Plots Sriperumbudur in Chennai E Brochure Pdf
DLF Plots Sriperumbudur in Chennai E Brochure PdfDLF Plots Sriperumbudur in Chennai E Brochure Pdf
DLF Plots Sriperumbudur in Chennai E Brochure Pdfashiyadav24
 
Ryan Mahoney - How Property Technology Is Altering the Real Estate Market
Ryan Mahoney - How Property Technology Is Altering the Real Estate MarketRyan Mahoney - How Property Technology Is Altering the Real Estate Market
Ryan Mahoney - How Property Technology Is Altering the Real Estate MarketRyan Mahoney
 
Call Girls in Inderpuri Delhi 💯Call Us 🔝8264348440🔝
Call Girls in Inderpuri Delhi 💯Call Us 🔝8264348440🔝Call Girls in Inderpuri Delhi 💯Call Us 🔝8264348440🔝
Call Girls in Inderpuri Delhi 💯Call Us 🔝8264348440🔝soniya singh
 
Kohinoor Hinjewadi Phase 2 Pune | E-Brochure
Kohinoor Hinjewadi Phase 2 Pune | E-BrochureKohinoor Hinjewadi Phase 2 Pune | E-Brochure
Kohinoor Hinjewadi Phase 2 Pune | E-BrochureOmanaConsulting
 
The Importance of Parks and Recreation Areas in Reliaable Developers Plot Dev...
The Importance of Parks and Recreation Areas in Reliaable Developers Plot Dev...The Importance of Parks and Recreation Areas in Reliaable Developers Plot Dev...
The Importance of Parks and Recreation Areas in Reliaable Developers Plot Dev...Reliaable Developers
 
The Role of Mortgage Brokers in Retirement Housing: Key Considerations
The Role of Mortgage Brokers in Retirement Housing: Key ConsiderationsThe Role of Mortgage Brokers in Retirement Housing: Key Considerations
The Role of Mortgage Brokers in Retirement Housing: Key Considerationssunlite Mortgage
 
Low Rate Call Girls in Lajpat Nagar Delhi Call 9990771857
Low Rate Call Girls in Lajpat Nagar Delhi Call 9990771857Low Rate Call Girls in Lajpat Nagar Delhi Call 9990771857
Low Rate Call Girls in Lajpat Nagar Delhi Call 9990771857delhimodel235
 
Call Girls In Mayur Vihar-1 Delhi ❤️8860477959 Good Looking Escorts In 24/7 D...
Call Girls In Mayur Vihar-1 Delhi ❤️8860477959 Good Looking Escorts In 24/7 D...Call Girls In Mayur Vihar-1 Delhi ❤️8860477959 Good Looking Escorts In 24/7 D...
Call Girls In Mayur Vihar-1 Delhi ❤️8860477959 Good Looking Escorts In 24/7 D...lizamodels9
 
Call Girls in Pitampura Delhi 💯Call Us 🔝8264348440🔝
Call Girls in Pitampura Delhi 💯Call Us 🔝8264348440🔝Call Girls in Pitampura Delhi 💯Call Us 🔝8264348440🔝
Call Girls in Pitampura Delhi 💯Call Us 🔝8264348440🔝soniya singh
 
What Is Biophilic Design .pdf
What Is Biophilic Design            .pdfWhat Is Biophilic Design            .pdf
What Is Biophilic Design .pdfyamunaNMH
 
Kumar Fireworks Hadapsar Link Road Pune Brochure.pdf
Kumar Fireworks Hadapsar Link Road Pune Brochure.pdfKumar Fireworks Hadapsar Link Road Pune Brochure.pdf
Kumar Fireworks Hadapsar Link Road Pune Brochure.pdfBabyrudram
 
MADHUGIRI FARM LAND BROCHURES (11)_compressed (1).pdf
MADHUGIRI FARM LAND BROCHURES (11)_compressed (1).pdfMADHUGIRI FARM LAND BROCHURES (11)_compressed (1).pdf
MADHUGIRI FARM LAND BROCHURES (11)_compressed (1).pdfknoxdigital1
 
Prestige Rainbow Waters Raidurgam, Gachibowli Hyderabad E- Brochure.pdf
Prestige Rainbow Waters Raidurgam, Gachibowli Hyderabad E- Brochure.pdfPrestige Rainbow Waters Raidurgam, Gachibowli Hyderabad E- Brochure.pdf
Prestige Rainbow Waters Raidurgam, Gachibowli Hyderabad E- Brochure.pdffaheemali990101
 
A Brief History of Intangibles in Ad Valorem Taxation.pdf
A Brief History of Intangibles in Ad Valorem Taxation.pdfA Brief History of Intangibles in Ad Valorem Taxation.pdf
A Brief History of Intangibles in Ad Valorem Taxation.pdfTim Wilmath
 
Covid 19 and Market Impact during the Pandemic
Covid 19 and Market Impact during the PandemicCovid 19 and Market Impact during the Pandemic
Covid 19 and Market Impact during the PandemicTim Wilmath
 
Ajmera Prive at Juhu, Mumbai E-Brochure.pdf
Ajmera Prive at Juhu, Mumbai  E-Brochure.pdfAjmera Prive at Juhu, Mumbai  E-Brochure.pdf
Ajmera Prive at Juhu, Mumbai E-Brochure.pdfManishSaxena95
 

Último (20)

Everything you ever Wanted to Know about Florida Property Tax Exemptions.pdf
Everything you ever Wanted to Know about Florida Property Tax Exemptions.pdfEverything you ever Wanted to Know about Florida Property Tax Exemptions.pdf
Everything you ever Wanted to Know about Florida Property Tax Exemptions.pdf
 
young call girls in Lajpat Nagar,🔝 9953056974 🔝 escort Service
young call girls in Lajpat Nagar,🔝 9953056974 🔝 escort Serviceyoung call girls in Lajpat Nagar,🔝 9953056974 🔝 escort Service
young call girls in Lajpat Nagar,🔝 9953056974 🔝 escort Service
 
DLF Plots Sriperumbudur in Chennai E Brochure Pdf
DLF Plots Sriperumbudur in Chennai E Brochure PdfDLF Plots Sriperumbudur in Chennai E Brochure Pdf
DLF Plots Sriperumbudur in Chennai E Brochure Pdf
 
Low Rate Call Girls in Triveni Complex Delhi Call 9873940964
Low Rate Call Girls in Triveni Complex Delhi Call 9873940964Low Rate Call Girls in Triveni Complex Delhi Call 9873940964
Low Rate Call Girls in Triveni Complex Delhi Call 9873940964
 
Ryan Mahoney - How Property Technology Is Altering the Real Estate Market
Ryan Mahoney - How Property Technology Is Altering the Real Estate MarketRyan Mahoney - How Property Technology Is Altering the Real Estate Market
Ryan Mahoney - How Property Technology Is Altering the Real Estate Market
 
Call Girls in Inderpuri Delhi 💯Call Us 🔝8264348440🔝
Call Girls in Inderpuri Delhi 💯Call Us 🔝8264348440🔝Call Girls in Inderpuri Delhi 💯Call Us 🔝8264348440🔝
Call Girls in Inderpuri Delhi 💯Call Us 🔝8264348440🔝
 
Kohinoor Hinjewadi Phase 2 Pune | E-Brochure
Kohinoor Hinjewadi Phase 2 Pune | E-BrochureKohinoor Hinjewadi Phase 2 Pune | E-Brochure
Kohinoor Hinjewadi Phase 2 Pune | E-Brochure
 
The Importance of Parks and Recreation Areas in Reliaable Developers Plot Dev...
The Importance of Parks and Recreation Areas in Reliaable Developers Plot Dev...The Importance of Parks and Recreation Areas in Reliaable Developers Plot Dev...
The Importance of Parks and Recreation Areas in Reliaable Developers Plot Dev...
 
The Role of Mortgage Brokers in Retirement Housing: Key Considerations
The Role of Mortgage Brokers in Retirement Housing: Key ConsiderationsThe Role of Mortgage Brokers in Retirement Housing: Key Considerations
The Role of Mortgage Brokers in Retirement Housing: Key Considerations
 
Low Rate Call Girls in Lajpat Nagar Delhi Call 9990771857
Low Rate Call Girls in Lajpat Nagar Delhi Call 9990771857Low Rate Call Girls in Lajpat Nagar Delhi Call 9990771857
Low Rate Call Girls in Lajpat Nagar Delhi Call 9990771857
 
Call Girls In Mayur Vihar-1 Delhi ❤️8860477959 Good Looking Escorts In 24/7 D...
Call Girls In Mayur Vihar-1 Delhi ❤️8860477959 Good Looking Escorts In 24/7 D...Call Girls In Mayur Vihar-1 Delhi ❤️8860477959 Good Looking Escorts In 24/7 D...
Call Girls In Mayur Vihar-1 Delhi ❤️8860477959 Good Looking Escorts In 24/7 D...
 
Call Girls in Pitampura Delhi 💯Call Us 🔝8264348440🔝
Call Girls in Pitampura Delhi 💯Call Us 🔝8264348440🔝Call Girls in Pitampura Delhi 💯Call Us 🔝8264348440🔝
Call Girls in Pitampura Delhi 💯Call Us 🔝8264348440🔝
 
What Is Biophilic Design .pdf
What Is Biophilic Design            .pdfWhat Is Biophilic Design            .pdf
What Is Biophilic Design .pdf
 
Kumar Fireworks Hadapsar Link Road Pune Brochure.pdf
Kumar Fireworks Hadapsar Link Road Pune Brochure.pdfKumar Fireworks Hadapsar Link Road Pune Brochure.pdf
Kumar Fireworks Hadapsar Link Road Pune Brochure.pdf
 
MADHUGIRI FARM LAND BROCHURES (11)_compressed (1).pdf
MADHUGIRI FARM LAND BROCHURES (11)_compressed (1).pdfMADHUGIRI FARM LAND BROCHURES (11)_compressed (1).pdf
MADHUGIRI FARM LAND BROCHURES (11)_compressed (1).pdf
 
Prestige Rainbow Waters Raidurgam, Gachibowli Hyderabad E- Brochure.pdf
Prestige Rainbow Waters Raidurgam, Gachibowli Hyderabad E- Brochure.pdfPrestige Rainbow Waters Raidurgam, Gachibowli Hyderabad E- Brochure.pdf
Prestige Rainbow Waters Raidurgam, Gachibowli Hyderabad E- Brochure.pdf
 
A Brief History of Intangibles in Ad Valorem Taxation.pdf
A Brief History of Intangibles in Ad Valorem Taxation.pdfA Brief History of Intangibles in Ad Valorem Taxation.pdf
A Brief History of Intangibles in Ad Valorem Taxation.pdf
 
Covid 19 and Market Impact during the Pandemic
Covid 19 and Market Impact during the PandemicCovid 19 and Market Impact during the Pandemic
Covid 19 and Market Impact during the Pandemic
 
Ajmera Prive at Juhu, Mumbai E-Brochure.pdf
Ajmera Prive at Juhu, Mumbai  E-Brochure.pdfAjmera Prive at Juhu, Mumbai  E-Brochure.pdf
Ajmera Prive at Juhu, Mumbai E-Brochure.pdf
 
Call Girls in Mahavir Nagar whatsaap call US +919953056974
Call Girls in Mahavir Nagar  whatsaap call US  +919953056974Call Girls in Mahavir Nagar  whatsaap call US  +919953056974
Call Girls in Mahavir Nagar whatsaap call US +919953056974
 

February 2013's Monthly Indicators report - Boston Real Estate Market Trends

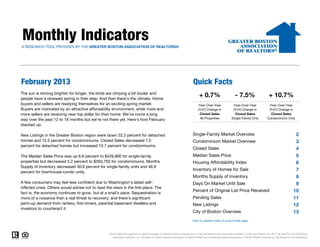
  • 1. Monthly Indicators A RESEARCH TOOL PROVIDED BY THE GREATER BOSTON ASSOCIATION OF REALTORS® February 2013 Quick Facts The sun is shining brighter for longer, the birds are chirping a bit louder and people have a renewed spring in their step. And then there's the climate. Home + 0.7% - 7.5% + 10.7% buyers and sellers are readying themselves for an exciting spring market. Year-Over-Year Year-Over-Year Year-Over-Year Buyers are motivated by an attractive affordability environment, while more and (YoY) Change in (YoY) Change in (YoY) Change in more sellers are receiving near top dollar for their home. We've come a long Closed Sales Closed Sales Closed Sales way over the past 12 to 18 months but we're not there yet. Here's how February All Properties Single-Family Only Condominium Only stacked up. New Listings in the Greater Boston region were down 22.2 percent for detached Single-Family Market Overview 2 homes and 15.5 percent for condominiums. Closed Sales decreased 7.5 Condominium Market Overview 3 percent for detached homes but increased 10.7 percent for condominiums. Closed Sales 4 The Median Sales Price was up 8.8 percent to $429,900 for single-family Median Sales Price 5 properties but decreased 5.2 percent to $350,750 for condominiums. Months Housing Affordability Index 6 Supply of Inventory decreased 30.6 percent for single-family units and 46.9 Inventory of Homes for Sale 7 percent for townhouse-condo units. Months Supply of Inventory 8 A few consumers may feel less confident due to Washington's latest self- Days On Market Until Sale 9 inflicted crisis. Others would advise not to read the news in the first place. The fact is, the economy continues to grow, but at a snail's pace. Sequestration is Percent of Original List Price Received 10 more of a nuisance than a real threat to recovery; and there's significant Pending Sales 11 pent–up demand from renters, first-timers, parental basement dwellers and New Listings 12 investors to counteract it. City of Boston Overview 13 Click on desired metric to jump to that page. Data is refreshed regularly to capture changes in market activity so figures shown may be different than previously reported. Current as of March 16, 2013. All data from MLS Property Information Network, Inc. Provided by Greater Boston Association of REALTORS® and the Massachusetts Association of REALTORS®. Powered by 10K Research and Marketing.
  • 2. Single-Family Market Overview Key market metrics for the current month and year-to-date figures for Single-Family Homes Only. Key Metrics Historical Sparklines Feb-2012 Feb-2013 +/– YTD 2012 YTD 2013 +/– Closed Sales 464 429 - 7.5% 987 1,033 + 4.7% 2-2010 2-2011 2-2012 2-2013 Median Sales Price $395,000 $429,900 + 8.8% $402,000 $430,000 + 7.0% 2-2010 2-2011 2-2012 2-2013 Housing Affordability Index 124 122 - 2.0% 122 122 - 0.6% 2-2010 2-2011 2-2012 2-2013 Inventory of Homes for Sale 4,040 2,592 - 35.8% -- -- -- 2-2010 2 2010 2-2011 2 2011 2-2012 2 2012 2-2013 2 2013 Months Supply of Inventory 8.7 6.0 - 30.6% -- -- -- 2-2010 2-2011 2-2012 2-2013 Days on Market Until Sale 134 109 - 18.6% 132 109 - 17.5% 2-2010 2-2011 2-2012 2-2013 Percent of Original 91.2% 94.1% + 3.2% 90.8% 93.9% + 3.4% List Price Received 2-2010 2-2011 2-2012 2-2013 Pending Sales 639 683 + 6.9% 1,179 1,269 + 7.6% 2-2010 2-2011 2-2012 2-2013 New Listings 1,319 1,026 - 22.2% 2,282 1,929 - 15.5% 2-2010 2-2011 2-2012 2-2013 All data from MLS Property Information Network, Inc. Provided by the Greater Boston Association of REALTORS® and the Massachusetts Association of REALTORS®. Powered by 10K Research and Marketing. | Click for Cover Page | 2
  • 3. Condominium Market Overview Key market metrics for the current month and year-to-date figures for Condominium Properties Only. Key Metrics Historical Sparklines Feb-2012 Feb-2013 +/– YTD 2012 YTD 2013 +/– Closed Sales 384 425 + 10.7% 796 936 + 17.6% 2-2010 2-2011 2-2012 2-2013 Median Sales Price $370,000 $350,750 - 5.2% $360,000 $360,000 0.0% 2-2010 2-2011 2-2012 2-2013 Housing Affordability Index 132 146 + 11.0% 135 143 + 6.1% 2-2010 2-2011 2-2012 2-2013 Inventory of Homes for Sale 3,257 1,915 - 41.2% -- -- -- 2-2010 2 2010 2-2011 2 2011 2-2012 2 2012 2-2013 2 2013 Months Supply of Inventory 8.5 4.5 - 46.9% -- -- -- 2-2010 2-2011 2-2012 2-2013 Days on Market Until Sale 123 93 - 24.6% 124 90 - 27.1% 2-2010 2-2011 2-2012 2-2013 Percent of Original 93.4% 96.8% + 3.6% 93.2% 96.3% + 3.4% List Price Received 2-2010 2-2011 2-2012 2-2013 Pending Sales 635 644 + 1.4% 1,118 1,263 + 13.0% 2-2010 2-2011 2-2012 2-2013 New Listings 1,141 964 - 15.5% 2,095 1,878 - 10.4% 2-2010 2-2011 2-2012 2-2013 All data from MLS Property Information Network, Inc. Provided by the Greater Boston Association of REALTORS® and the Massachusetts Association of REALTORS®. Powered by 10K Research and Marketing. | Click for Cover Page | 3
  • 4. Closed Sales A count of the actual sales that have closed in a given month. February Year to Date Single-Family YoY Change Condominium YoY Change Mar-2012 648 + 16.5% 607 + 11.0% 464 Apr-2012 743 + 12.6% 758 + 20.1% 429 425 1,033 987 May-2012 1,005 + 20.5% 1,012 + 32.1% 384 936 351 Jun-2012 1,510 + 21.3% 1,264 + 20.3% 342 811 796 742 Jul-2012 1,279 + 25.3% 1,040 + 21.6% Aug-2012 1,299 + 26.0% 1,204 + 25.3% Sep-2012 766 - 1.2% 753 + 16.4% Oct-2012 791 + 28.6% 711 + 38.9% Nov-2012 907 + 32.6% 760 + 35.2% Dec-2012 824 + 11.8% 767 + 19.3% Jan-2013 604 + 15.5% 511 + 24.0% 2011 2012 2013 2011 2012 2013 2011 2012 2013 2011 2012 2013 Feb-2013 429 - 7.5% 425 + 10.7% +32.2% -7.5% +12.3% +10.7% +21.7% +4.7% +7.3% +17.6% Total 10,805 + 18.2% 9,812 + 23.1% Single-Family Condominium Single-Family Condominium Historical Closed Sales Activity Single-Family Condominium 1,800 1,600 1,400 1,200 1,000 800 600 400 200 Jan-2003 Jan-2004 Jan-2005 Jan-2006 Jan-2007 Jan-2008 Jan-2009 Jan-2010 Jan-2011 Jan-2012 Jan-2013 All data from MLS Property Information Network, Inc. Provided by the Greater Boston Association of REALTORS® and the Massachusetts Association of REALTORS®. Powered by 10K Research and Marketing. | Click for Cover Page | 4
  • 5. Median Sales Price Median price point for all closed sales, not accounting for seller concessions, in a given month. February Year to Date Single-Family YoY Change Condominium YoY Change Mar-2012 $414,838 - 1.5% $340,000 + 4.6% Apr-2012 $418,500 - 2.9% $371,500 + 4.6% $429,900 $430,000 $409,130 $402,000 May-2012 $465,000 + 1.4% $381,000 + 4.4% $395,000 $380,000 $370,000 $348,500 $350,750 $350,000 $360,000 $360,000 Jun-2012 $503,250 - 0.3% $400,000 + 6.7% Jul-2012 $510,000 + 2.0% $387,000 + 6.3% Aug-2012 $490,000 - 1.8% $380,000 + 3.0% Sep-2012 $430,475 - 4.3% $375,000 + 2.0% Oct-2012 $430,000 + 10.3% $366,265 + 5.1% Nov-2012 $447,500 + 5.8% $380,000 + 8.4% Dec-2012 $470,000 + 6.8% $382,000 + 10.7% Jan-2013 $430,000 + 6.2% $370,000 + 4.2% 2011 2012 2013 2011 2012 2013 2011 2012 2013 2011 2012 2013 Feb-2013 $429,900 + 8.8% $350,750 - 5.2% +3.9% +8.8% +6.2% -5.2% -1.7% +7.0% +2.9% 0.0% Median $461,000 + 2.4% $379,000 + 5.3% Single-Family Condominium Single-Family Condominium Historical Median Sales Price Single-Family Condominium $550,000 $500,000 $450,000 $400,000 $350,000 $300,000 $250,000 Jan-2003 Jan-2004 Jan-2005 Jan-2006 Jan-2007 Jan-2008 Jan-2009 Jan-2010 Jan-2011 Jan-2012 Jan-2013 All data from MLS Property Information Network, Inc. Provided by the Greater Boston Association of REALTORS® and the Massachusetts Association of REALTORS®. Powered by 10K Research and Marketing. | Click for Cover Page | 5
  • 6. Housing Affordability Index This index measures housing affordability for the region. An index of 120 means the median household income was 120% of what is necessary to qualify for the median-priced home under prevailing interest rates. A higher number means greater affordability. February Year to Date Single-Family YoY Change Condominium YoY Change 146 143 Mar-2012 117 + 15.8% 141 + 9.5% 132 135 Apr-2012 118 + 18.1% 132 + 10.2% 124 122 122 122 120 119 May-2012 109 + 13.2% 131 + 10.1% 111 104 Jun-2012 102 + 14.4% 126 + 7.4% Jul-2012 102 + 13.9% 131 + 9.5% Aug-2012 105 + 14.0% 133 + 9.0% Sep-2012 121 + 17.2% 137 + 10.4% Oct-2012 120 + 3.2% 139 + 7.8% Nov-2012 117 + 6.8% 135 + 4.4% Dec-2012 113 + 6.8% 136 + 3.3% Jan-2013 125 + 3.7% 143 + 5.4% 2011 2012 2013 2011 2012 2013 2011 2012 2013 2011 2012 2013 Feb-2013 122 - 2.0% 146 + 11.0% +12.2% -2.0% +10.0% +11.0% +17.9% -0.6% +13.0% +6.1% Average 114 +10.4% 136 +8.2% Single-Family Condominium Single-Family Condominium Historical Housing Affordability Index Single-Family Condominium 160 150 140 130 120 110 100 90 80 70 60 Jan-2004 Jan-2005 Jan-2006 Jan-2007 Jan-2008 Jan-2009 Jan-2010 Jan-2011 Jan-2012 Jan-2013 All data from MLS Property Information Network, Inc. Provided by the Greater Boston Association of REALTORS® and the Massachusetts Association of REALTORS®. Powered by 10K Research and Marketing. | Click for Cover Page | 6
  • 7. Inventory of Homes for Sale The number of properties available for sale in active status at the end of a given month. February Single-Family YoY Change Condominium YoY Change Mar-2012 4,668 + 2.1% 3,691 - 21.1% 4,040 3,909 Apr-2012 5,018 - 4.4% 3,844 - 25.7% 3,785 May-2012 5,115 - 9.7% 3,657 - 29.8% 3,257 Jun-2012 4,797 - 15.2% 3,392 - 33.4% Jul-2012 4,372 - 20.7% 3,128 - 33.5% 2,592 Aug-2012 4,026 - 23.9% 2,729 - 35.2% 1,915 Sep-2012 4,232 - 24.1% 2,850 - 34.0% Oct-2012 3,947 - 26.1% 2,618 - 36.0% Nov-2012 3,319 - 26.8% 2,218 - 38.2% Dec-2012 2,480 - 31.3% 1,674 - 40.5% Jan-2013 2,486 - 31.9% 1,754 - 41.0% 2011 2012 2013 2011 2012 2013 Feb-2013 2,592 - 35.8% 1,915 - 41.2% +6.7% -35.8% -16.7% -41.2% Average 3,921 - 19.8% 2,789 - 33.2% Single-Family Condominium Historical Inventory of Homes for Sale Single-Family Condominium 9,000 8,000 7,000 6,000 5,000 4,000 3,000 2,000 1,000 Jan-2003 Jan-2004 Jan-2005 Jan-2006 Jan-2007 Jan-2008 Jan-2009 Jan-2010 Jan-2011 Jan-2012 Jan-2013 All data from MLS Property Information Network, Inc. Provided by the Greater Boston Association of REALTORS® and the Massachusetts Association of REALTORS®. Powered by 10K Research and Marketing. | Click for Cover Page | 7
  • 8. Months Supply of Inventory The inventory of homes for sale at the end of a given month, divided by the average monthly pending sales from the last 12 months. February Single-Family YoY Change Condominium YoY Change Mar-2012 7.2 - 12.4% 6.1 - 28.9% 11.4 Apr-2012 6.8 - 15.1% 5.1 - 38.1% 10.8 May-2012 5.1 - 25.1% 3.6 - 46.9% Jun-2012 3.2 - 30.1% 2.7 - 44.6% 8.7 8.5 Jul-2012 3.4 - 36.7% 3.0 - 45.3% Aug-2012 3.1 - 39.6% 2.3 - 48.3% 6.0 Sep-2012 5.5 - 23.2% 3.8 - 43.3% 4.5 Oct-2012 5.0 - 42.5% 3.7 - 53.9% Nov-2012 3.7 - 44.8% 2.9 - 54.3% Dec-2012 3.0 - 38.5% 2.2 - 50.1% Jan-2013 4.1 - 41.0% 3.4 - 52.4% 2011 2012 2013 2011 2012 2013 Feb-2013 6.0 - 30.6% 4.5 - 46.9% -19.3% -30.6% -25.8% -46.9% Average 4.7 - 29.3% 3.8 - 41.0% Single-Family Condominium Historical Months Supply of Inventory Single-Family Condominium 16 14 12 10 8 6 4 2 0 Jan-2004 Jan-2005 Jan-2006 Jan-2007 Jan-2008 Jan-2009 Jan-2010 Jan-2011 Jan-2012 Jan-2013 All data from MLS Property Information Network, Inc. Provided by the Greater Boston Association of REALTORS® and the Massachusetts Association of REALTORS®. Powered by 10K Research and Marketing. | Click for Cover Page | 8
  • 9. Days on Market Until Sale Average number of days between when a property is listed and when an offer is accepted in a given month. February Year to Date Single-Family YoY Change Condominium YoY Change Mar-2012 130 - 3.1% 117 - 4.6% Apr-2012 120 - 1.7% 98 - 16.8% 134 137 134 129 132 May-2012 96 - 5.9% 86 - 11.9% 123 120 124 Jun-2012 90 - 0.2% 75 - 20.4% 109 109 Jul-2012 80 - 3.9% 71 - 20.6% 93 90 Aug-2012 87 - 5.8% 76 - 18.2% Sep-2012 89 - 12.0% 85 - 18.1% Oct-2012 90 - 17.6% 84 - 11.4% Nov-2012 89 - 18.0% 77 - 30.0% Dec-2012 97 - 12.4% 84 - 30.1% Jan-2013 109 - 16.5% 88 - 29.2% 2011 2012 2013 2011 2012 2013 2011 2012 2013 2011 2012 2013 Feb-2013 109 - 18.6% 93 - 24.6% +3.7% -18.6% -9.8% -24.6% +9.7% -17.5% -7.1% -27.1% Total 96 - 9.3% 78 - 18.2% Single-Family Condominium Single-Family Condominium Historical Days on Market Until Sale Single-Family Condominium 160 140 120 100 80 60 40 Jan-2003 Jan-2004 Jan-2005 Jan-2006 Jan-2007 Jan-2008 Jan-2009 Jan-2010 Jan-2011 Jan-2012 Jan-2013 All data from MLS Property Information Network, Inc. Provided by the Greater Boston Association of REALTORS® and the Massachusetts Association of REALTORS®. Powered by 10K Research and Marketing. | Click for Cover Page | 9
  • 10. Percent of Original List Price Received Percentage found when dividing a property’s sales price by its original list price, then taking the average for all properties sold in a given month, not accounting for seller concessions. February Year to Date Single-Family YoY Change Condominium YoY Change Mar-2012 93.0% + 0.7% 94.0% + 0.9% Apr-2012 93.5% + 0.8% 95.7% + 2.0% 94.1% 96.8% 96.3% May-2012 95.4% + 1.1% 96.1% + 1.0% 90.9% 91.2% 92.0% 93.4% 90.9% 90.8% 93.9% 92.2% 93.2% Jun-2012 95.3% + 0.8% 96.4% + 1.8% Jul-2012 95.8% + 1.6% 96.6% + 1.7% Aug-2012 94.8% + 1.5% 96.3% + 2.2% Sep-2012 94.6% + 1.5% 96.4% + 2.3% Oct-2012 94.3% + 2.8% 95.9% + 2.5% Nov-2012 94.6% + 2.3% 96.2% + 2.5% Dec-2012 94.2% + 2.2% 96.2% + 3.4% Jan-2013 93.8% + 3.6% 96.0% + 3.3% 2011 2012 2013 2011 2012 2013 2011 2012 2013 2011 2012 2013 Feb-2013 94.1% + 3.2% 96.8% + 3.6% +0.3% +3.2% +1.5% +3.6% -0.1% +3.4% +1.1% +3.4% Average 94.7% + 1.7% 96.1% + 2.2% Single-Family Condominium Single-Family Condominium Historical Percent of Original List Price Received Single-Family Condominium 99% 98% 97% 96% 95% 94% 93% 92% 91% 90% 89% Jan-2003 Jan-2004 Jan-2005 Jan-2006 Jan-2007 Jan-2008 Jan-2009 Jan-2010 Jan-2011 Jan-2012 Jan-2013 All data from MLS Property Information Network, Inc. Provided by the Greater Boston Association of REALTORS® and the Massachusetts Association of REALTORS®. Powered by 10K Research and Marketing. | Click for Cover Page | 10
  • 11. Pending Sales A count of the properties in UAG status between the first and last day in a given month, regardless of current status (based on Off Market Date). February Year to Date Single-Family YoY Change Condominium YoY Change Mar-2012 982 + 25.1% 1,009 + 32.2% 1,269 1,263 Apr-2012 1,142 + 21.7% 1,047 + 24.6% 683 1,179 639 635 644 1,118 May-2012 1,326 + 23.1% 1,266 + 28.9% Jun-2012 1,255 + 13.3% 1,039 + 19.3% 523 946 918 511 Jul-2012 1,044 + 26.2% 831 + 9.1% Aug-2012 895 + 17.0% 815 + 22.2% Sep-2012 840 + 27.7% 717 + 38.4% Oct-2012 869 + 17.8% 820 + 38.7% Nov-2012 787 + 16.6% 664 + 18.1% Dec-2012 596 + 5.9% 503 + 7.5% Jan-2013 586 + 8.5% 619 + 28.2% 2011 2012 2013 2011 2012 2013 2011 2012 2013 2011 2012 2013 Feb-2013 683 + 6.9% 644 + 1.4% +22.2% +6.9% +24.3% +1.4% +24.6% +7.6% +21.8% +13.0% Total 11,005 + 18.2% 9,974 + 22.5% Single-Family Condominium Single-Family Condominium Historical Pending Sales Activity Single-Family Condominium 1,400 1,200 1,000 800 600 400 200 Jan-2003 Jan-2004 Jan-2005 Jan-2006 Jan-2007 Jan-2008 Jan-2009 Jan-2010 Jan-2011 Jan-2012 Jan-2013 All data from MLS Property Information Network, Inc. Provided by the Greater Boston Association of REALTORS® and the Massachusetts Association of REALTORS®. Powered by 10K Research and Marketing. | Click for Cover Page | 11
  • 12. New Listings A count of the properties that have been newly listed on the market in a given month. February Year to Date Single-Family YoY Change Condominium YoY Change Mar-2012 2,008 + 3.3% 1,741 - 11.7% 1,319 2,282 Apr-2012 1,798 - 8.8% 1,499 - 13.0% 1,141 2,055 2,095 May-2012 1,783 - 4.6% 1,387 - 7.6% 1,081 1,929 1,878 1,026 Jun-2012 1,352 - 15.3% 1,152 - 14.2% 964 1,716 879 Jul-2012 1,022 - 12.5% 902 - 7.6% Aug-2012 1,001 - 8.7% 790 - 7.5% Sep-2012 1,419 - 10.2% 1,153 - 9.6% Oct-2012 1,078 - 4.6% 881 - 2.1% Nov-2012 650 - 3.1% 561 - 10.4% Dec-2012 364 - 19.5% 317 - 18.3% Jan-2013 903 - 6.2% 914 - 4.2% 2011 2012 2013 2011 2012 2013 2011 2012 2013 2011 2012 2013 Feb-2013 1,026 - 22.2% 964 - 15.5% +50.1% -22.2% +5.6% -15.5% +33.0% -15.5% +1.9% -10.4% Total 14,404 - 8.6% 12,261 - 10.2% Single-Family Condominium Single-Family Condominium Historical New Listing Activity Single-Family Condominium 2,750 2,500 2,250 2,000 1,750 1,500 1,250 1,000 750 500 250 0 Jan-2003 Jan-2004 Jan-2005 Jan-2006 Jan-2007 Jan-2008 Jan-2009 Jan-2010 Jan-2011 Jan-2012 Jan-2013 All data from MLS Property Information Network, Inc. Provided by the Greater Boston Association of REALTORS® and the Massachusetts Association of REALTORS®. Powered by 10K Research and Marketing. | Click for Cover Page | 12
  • 13. City of Boston – Market Overview Key market metrics for the current month and year-to-date figures for the City of Boston. Key Metrics Historical Sparklines Feb-2012 Feb-2013 +/– YTD 2012 YTD 2013 +/– Closed Sales 203 221 + 8.9% 444 490 + 10.4% 2-2010 2-2011 2-2012 2-2013 Median Sales Price $399,000 $385,000 - 3.5% $386,500 $406,750 + 5.2% 2-2010 2-2011 2-2012 2-2013 Housing Affordability Index 124 122 - 2.0% 122 122 - 0.6% 2-2010 2-2011 2-2012 2-2013 Inventory of Homes for Sale 1,725 949 - 45.0% -- -- -- 2-2010 2 2010 2-2011 2 2011 2-2012 2 2012 2-2013 2 2013 Months Supply of Inventory 8.5 4.3 - 49.5% -- -- -- 2-2010 2-2011 2-2012 2-2013 Days on Market Until Sale 120 80 - 33.4% 120 78 - 35.1% 2-2010 2-2011 2-2012 2-2013 Percent of Original 93.9% 96.9% + 3.2% 93.4% 96.6% + 3.5% List Price Received 2-2010 2-2011 2-2012 2-2013 Pending Sales 362 376 + 3.9% 629 681 + 8.3% 2-2010 2-2011 2-2012 2-2013 New Listings 648 570 - 12.0% 1,217 1,054 - 13.4% 2-2010 2-2011 2-2012 2-2013 All data from MLS Property Information Network, Inc. Provided by the Greater Boston Association of REALTORS® and the Massachusetts Association of REALTORS®. Powered by 10K Research and Marketing. | Click for Cover Page | 13