SlideShare uma empresa Scribd logo
1 de 124
Baixar para ler offline
RURAL WATER SUPPLY MANAGEMENT:
An empirical study on COWSO strategy implementation, Private sector participation and
monitoring systems in Dodoma Region – Tanzania.
The research presented at the Second International Conference on “
Advancement of geography for the people, natural resources and development”
DODOMA, TANZANIA
Luca traini and Japhet Chamgeni: Lay Volunteers International Association.
Alberto Fierro and Elina Nelaj: University of Turin.
Ephraim Mwendamseke: University of Dodoma (UDOM).
November 2015
Lay Volunteers International Association
L.V.I.A.
Office – Cuneo (ITALY)
TANZANIA Office – P.O. BOX 160,
Kongwa
Tel/fax: +255 (0)26 2323131
E-mail: lvia.tanzania@gmail.com
University of Turin
Via Verdi, 8 - 10124 Turin (ITALY)
Tel: +39 011 6706111
P.I. 02099550010
C.F. 80088230018
1
ABSTRACT
Background
In 2015, World Health Organization and UNICEF reported that water coverage in Tanzania is
still low: about 46 percent in rural areas and 56 percent at national level, with a small level of
improvement compared to the total coverage of 54 percent stated in 1990 (JMP 2015, p. 75). In
order to face the current state, the Government of Tanzania structured a sector program in three
main pillars: i) implementations of new water projects or rehabilitations of old ones, ii)
improving water projects management and iii) conducting adequate monitoring.
Aim of the research
The present research contributes to the efforts of improving water supply access and water
management system in rural areas of Tanzania. It is developed as a pilot in the Dodoma Region
and can be extended in other regions as well as country-wide.
The report develops an analysis of the Tanzanian legislative and policy framework on rural water
supply. Then, starting from the recognition of the two main Government's policy principles
(community participation and private sector involvement), the research investigates the
development of the COWSOs (Community Owned Water Supply Organizations) system and
assesses the private sector participation in the management of rural water projects.
The second part of the research focuses on the improvement of water schemes monitoring
systems, analyzing monitoring resources, plans, results, methods and tools of the seven districts
of the Dodoma Region. Furthermore it designs, develops and tests a low-cost, efficient and easy
tool to monitor the performances of water schemes management.
2
Methodology
In order to investigate COWSO strategy implementation, private sector participation and
monitoring system the research team developed a quantitative-qualitative integrated approach.
In the first part, a semi-structured questionnaire was submitted to the District Water Engineers of
the seven Districts of the Dodoma Region. The questionnaire was constituted by 48 questions: 36
closed-ended questions and 12 open-ended questions, in order to integrate DWEs’ suggestions
and opinions.
In the second part, the team visited 25 water schemes of the 7 Dodoma’s Districts (three for each
district, with the exception of Kongwa and Chamwino, where the team visited 5 water schemes
each). The team research submitted to a responsible person of each scheme a questionnaire
consisting of 13 closed-ended questions with the necessary elements (number of DPs, of spare
parts, savings, etc) to calculate the three indicators of the monitoring tool: i) functionality, ii)
stability, iii) communication/satisfaction. The research designed and tested a monitoring tool that
is able to measure the performance of water service management in a scale from 0 to 10. The
“Indicator of Performance” is composed by three sub-indicators with the same scale from 0 to
10: 1) “Functionality”, 2) “Stability” and 3) “Satisfaction/Communication”. Each scale is divided
in 5 groups as follow: “very bad” (from 0 to 2), “bad” (from 2 to 4), “normal” (from 4 to 6),
good (from 6 to 8) and “very good” (from 8 to 10).
Results
In rural area of Dodoma Region, water management systems are distributed as follow: Village
Water Committees 56 percent, Private Operators 28 percent and COWSOs 15 percent.
The research shows that the COWSOs establishment and registration process lack of dedicated
financial resources, clear guidelines and adequate directives from the Central Government to the
3
Local Government Authorities. Only 25 percent of all COWSO planned in 2014 were officially
registered. Districts that have a dedicated budget line for COWSO establishment and registration,
and proper activity plans showed better results in terms of COWSO registered than other
districts.
Concerning, the role of privates, despite the fact that 57 percent of DWEs suggested that POs are
more efficient than other management entities, the institutional environment it is not fully
supportive to the involvement of the private sector. Moreover, contracts between Private
Operators and Village Governments/COWSOs are not drafted using a standard and complete
format.
Monitoring of water scheme in the Dodoma Region is not adequate: districts provide assistance
to water schemes almost only in case of emergencies, denying in this way the prevention role of
monitoring. Furthermore, DWEs do not receive periodical reports from the management entities.
The monitoring activity highlights that the sustainability of the schemes is at serious risk: 80
percent of management was classified by the “Indicator of Stability” as “bad or “very bad”.
Then, the final “Indicator of Performance” shows better general results: 48 percent of
managements are classified as “normal”, 12 percent as “bad” or “very bad”, 36 percent “good”
and 4 percent as “very good”. In Dodoma Region both COWSO and PO perform as well in terms
of Stability and Functionality but COWSO allows better “Saving”. WVC system rates are lower
in all aspects of the performance.
Conclusions and Recommendations
In order to improve the water management system, the principle of community participation
should go together with a continuous and stronger support of LGAs. COWSOs and the private
sector (Private Operators) can coexist in a management formula that holds together the
4
independence and the community participation, guaranteed by COWSOs, as well as the
efficiency in daily management of Private Operators.
Central and local government should increase funds for monitoring and COWSO establishment
and registration process. Monitoring program must be planned in advance, both in short and long
term perspective. Districts should increase/plan community incentives to produce detailed
monthly reports (e.g. communities that regularly submit monthly report and show good
performances can apply for special water loan or other facilities). Concerning contracts between
Private Operators and Village Governments/COWSOs a standard format to be provided by
Central Government could highlight some key elements: expected average revenues, costs of
water projects and the profit margin for the PO.
Finally, it is essential to keep on working on low-cost monitoring tools - like the one designed in
the present research - and effective programs (with high benefit-cost ratio), and to concentrate
resources and efforts on feasible and crucial targets.
5
INDEX
1.1 Improving rural water supply in Tanzania: background information................................... 14
1.2 The legislative and policy framework .................................................................................. 16
1.3 Aim of the research: why water schemes management in rural water projects is a key
element for sustainability .................................................................................................... 21
1.4 Research methodology and study area ................................................................................. 23
1.4.1 Seven districts of the Dodoma region........................................................................... 25
1.4.2 Twenty-five water schemes in seven districts of Dodoma region................................ 27
2. Water schemes management: COWSO system and private sector participation.......................29
2.1 Framework: laws and policy ................................................................................................ 29
2.1.1 COWSO........................................................................................................................ 29
2.1.2 Private sector ................................................................................................................ 31
2.2 Data analysis of the districts................................................................................................. 33
2.2.1 Types of management................................................................................................... 33
2.2.1.1 Types of COWSO.................................................................................................. 36
2.2.2 Resources for COWSO................................................................................................. 39
2.2.2.1 Funds...................................................................................................................... 39
2.2.2.2 Documents & guidelines........................................................................................ 41
2.2.2.3 The role of CWSTs and other district officers....................................................... 42
2.2.3 COWSO’s processes..................................................................................................... 45
2.2.3.1 COWSO formation and registration achievements................................................ 45
2.2.3.2 Steps of establishment and registration.................................................................. 48
2.2.3.3 Average time and funds needed............................................................................. 52
6
2.2.3.4 Problems hindering the establishment and registration of COWSOs.................... 56
2.2.4 Private Sector................................................................................................................ 59
2.2.4.1 Involvement of the district in the selection of Private Operators .......................... 59
2.2.4.2 Contracts ................................................................................................................ 61
2.2.4.3 Suggestions of DWE on the signed contracts........................................................ 61
2.2.4.4 Comparative assessment of Private Operator’s performances............................... 64
2.2.4.5 Possible future impact of private sector................................................................. 66
2.3 Main problems and areas of interventions............................................................................ 68
3. Monitoring and supervision of water schemes: Data analysis and a proposal ..........................71
3.1 Introduction .......................................................................................................................... 71
3.1.1 Background................................................................................................................... 71
3.1.2 Framework: laws and policy ........................................................................................ 71
3.1.3 The concept of monitoring and Tanzania’s strategy .................................................... 73
3.2 Data presentation and analysis ............................................................................................. 74
3.2.1 Status of monitoring and supervision of water schemes at regional level.................... 74
3.2.2Types of monitoring and supervision............................................................................ 75
3.2.3 LGAs support to water schemes................................................................................... 76
3.2.4 Report and information sharing between community and the LGAs........................... 77
3.2.5 Indicators and strategies for good management of water schemes. ............................. 78
3.2.6 Challenges of schemes’ monitoring and supervision ................................................... 83
3.3 A monitoring proposal.......................................................................................................... 84
3.3.1 Three indicators: functionality, stability and satisfaction/communication................... 84
3.3.2 The sample: 25 water schemes in the Dodoma region ................................................. 90
7
3.3.3 The results .................................................................................................................... 94
3.4 Main problems and areas of intervention ........................................................................... 110
4. Conclusion ...............................................................................................................................115
Bibliography ................................................................................................................................120
8
LIST OF GRAPHS
Graph 1: Total number of water schemes in each district of the Dodoma region ........................ 33
Graph 2: Types of management (in percentage) in the Dodoma region....................................... 34
Graph 3: Percentage of each management entity in the seven districts of the Dodoma region.... 35
Graph 4: Percentage of Water Departments’ budget (2015) for COWSOs establishment and
registration. ................................................................................................................ 39
Graph 5: Percentages of availability of some relevant documents at DWEs’ offices.. ................ 41
Graph 6: Facilitating activities implemented by district (in percentage) in COWSOs
establishment process................................................................................................. 44
Graph 7: Percentage of registered and unregistered COWSOs in the Dodoma Region............... 46
Graph 8: Percentage of planned and registered COWSOs ........................................................... 47
Graph 9: The ten steps of the establishment procedure and the percentages, for each step, of
districts that implement them..................................................................................... 50
Graph 10: Average time for COWSO establishment and registration in each district. ................ 53
Graph 11: Total cost, reported by DWEs, for establishing and registering one COWSO............ 55
Graph 12: In percentage, the problems reported by DWEs that hinder COWSOs establishment
and registration........................................................................................................... 58
Graph 13: Proposed DWEs’ strategies (in percentage) to improve COWSOs registration and
performances.............................................................................................................. 59
Graph 14: Percentages of districts involved in the selection of POs. ........................................... 60
Graph 15: Responsible figures for contract drafting, modification and approval ........................ 61
Graph 16: Opinion of DWEs on PO’s performances compared to other management systems. . 64
Graph 17: Advantages and disadvantages of POs according to DWEs........................................ 66
9
Graph 18: Profitable areas in rural water supply sector according to DWEs. .............................. 67
Graph 19: Illustrates the percentage of availability of monitoring plan and monitoring budget at
regional level.............................................................................................................. 75
Graph 20: Illustrates the percentages of supports provided by the LGAs to water scheme. ........ 77
Graph 21: Indicators of a good management suggested by more than one DWE. ...................... 79
Graph 22: strategies of the districts to improve the performance................................................. 82
Graph 23: Classification of water schemes according to the number of people served ............... 92
Graph 24: Classification of water schemes according to the price per water bucket. .................. 93
Graph 25: Bar chart of the villages according to performance indicator...................................... 96
Graph 26: Average performances in the seven districts. .............................................................. 98
Graph 27: Bar chart of all the indicators classified in the five groups. ...................................... 103
Graph 28: Bar chart of the schemes classified according to the type of management and average
scores........................................................................................................................................... 106
10
LIST OF TABLES
Table 1: Results of the indicators for the complete sample.......................................................... 94
Table 2: Descriptive statistics of the performance indicator ........................................................ 95
Table 3: Classification of performance indicator in five groups .................................................. 96
Table 4: Averages scores for each district. All indicators. ........................................................... 97
Table 5: Descriptive statistics of the functionality indicator ........................................................ 99
Table 6: Classification of functionality indicator in five groups .................................................. 99
Table 7: Descriptive statistics of the functionality indicator ...................................................... 100
Table 8: Classification of stability indicator in five groups........................................................ 101
Table 9: Descriptive statistics of the communication/satisfaction indicator .............................. 102
Table 10: Classification of communication/satisfaction indicator in five groups ...................... 102
Table 11: Classification of schemes according to the type of management and average scores 105
Table 12: Classification of schemes according to the number of DPs and average scores ........ 107
Table 13: The results for each indicator in the Nghong'ohna village ......................................... 109
Table 14: The results for each indicator in Kimagai village....................................................... 110
11
LIST OF ACRONYMS
AMCOW African Minister's Council on Water
COWSO Community Owned Water Supply Organisation
CWST Council/Community Water and Sanitation Team
DCDO District Community development Office
DED District Executive Director
DEO District Education Office
DHO District Health Office
DLO District Legal Officer
DP Distribution Point
DPLO District Planning Office
DT District Treasurer
DUWASA Dodoma Water Supply & Sewerage Authority.
DWE District Water Engineer
DWST District Water and Sanitation Team
JMP Joint Monitoring Programme
KKK Kusoma, Kuandika and Kuhesabu
L.V.I.A. Lay volunteers International Association
LGAs Local Government Authorities
MAMADO Maji na Maendeleo Dodoma
MDG Millennium Development Goal
MoW Memorandum of understanding
MOW Ministry of Water
12
NAWAPO National Water Policy 2002
NGO Non-Governmental Organization
NRWSS National Rural Water Sustainability Strategy
O&M Operation and Maintenance
PIM Program Implementation Manual
PMO-RALG Prime Minister’s Office for Regional Administration and Local
Government
PO Private Operator
TASAF Tanzania Social Action Fund
TAWASENET Tanzania Water and Sanitation Network
TSH Tanzanian Shillings
UDOM The University of Dodoma
VEO Village Executive Officer
VG Village Government
VWC Village Water Committees
WA Water Authorities
WCA Water Consumer Associations
WP Water Point
WPM Water Point Mapping
WSDP Water Sector Development Program
WSSA Water Supply and Sanitation Act
WSSR Water and Sanitation Sector Review
WUA Water User Associations
13
WUG Water User Groups
14
1 Introduction
1.1 Improving rural water supply in Tanzania: background information
The aim of this research is to contribute to the general objective of improving access to
sustainable water service in the rural areas of the country. The priority of this goal is strongly
recognized both by the Government and by international organizations: availability of clean and
safe water is a human right and also a key element of United Nations Millennium Development
Goals. In this regard, Target 7.C states that: the objective is to “halve, by 2015, the proportion of
the population without sustainable access to safe drinking water and basic sanitation” (MDG
2015). Despite general acknowledgement of this priority, the actual situation in Tanzania
presents many challenges: for instance, the percentage of people with sustainable access to
improved water supply has not increased considerably in the past twenty years. Therefore, a joint
effort of all the relevant stakeholders is required.
The Government developed since almost ten years a comprehensive sector wide plan, the Water
Sector Development Program (WSDP), which entered this year in its second phase. In this new
stage, the Government divided the water sector in five areas of intervention (Water resource
management, Rural water supply and sanitation, Urban water supply and sanitation, Sanitation
and hygiene, Programme delivery support), in order to increase the effectiveness of planned
actions and to promote a more efficient approach in the sector. Together with the WSDP, a
substantial increase of financial resources has been registered (thanks to international
institutions, Tanzanian and foreign governments/agencies), giving reason to hope for future
improvements.
At the basis of government’s policy for improving access to sustainable water service there are
three strategic actions:
15
- Increasing water supply coverage through new projects and rehabilitations of old ones;
- Improving water management systems;
- Strengthening supervision and monitoring of the sector.
Available data about actual water coverage in urban and rural areas are not coherent among
different sources. In the AMCOW's (African Minister's Council on Water) country status
review of 2011, water coverage estimations are presented for the year 2009: 58.7 percent for
rural areas, 53 percent in small towns, 84 percent in urban areas and 68 percent in Dar es Salaam.
This report demonstrates that the estimates were calculated by the Minister using routine
monitoring data (i.e. number of facilities built, multiplied by a fixed estimated population served
per facility). Then, based on population estimation for each area, the overall water supply
coverage of 64 percent was derived. (AMCOW 2011, p.8)
In the National Rural Water Sustainability Strategy (July 2015 - June 2020) – the last
document produced by Ministry of Water about rural water supply policy, there is a table
describing water coverage in rural areas of the country between 2005 and 2012. The percentage
of coverage for 2009 (58.7 percent) is the same as in the AMCOW country status review,
suggesting that these data are estimated similarly using routine monitoring data and population
estimations. The data show that the coverage trend is slightly decreasing in the recent years: first
it is presented an increase of almost 5 percentage points between 2005 and 2009 (from 54
percent to 59 percent), and then a decrease of almost two points, reaching 57 percent in 2012
(NRWSS 2015, p. 85).1
1 WSDP phase II report provides a description of government's definition of water coverage (although it is specified
that it applies to regional centres, district headquarters and small towns, therefore excluding villages and rural areas).
The criteria to be fulfilled is 2 households (10 people) in average benefit through one connection and 250 people
through a water point or a kiosk (WSDP II 2014, p. xiv-xv).Then, water coverage estimated by the government
16
The data published in 2015 by the World Health Organization and UNICEF in their Joint
Monitoring Programme – Progress on sanitation and drinking water, are considerably
different. The report, based on three different data sources (household surveys, censuses and
administrative reports), estimates the water supply coverage (in percentage) for more than 150
countries all over the world. Tanzania has a total coverage of 56 percent: in rural areas it is 46
percent, while in urban areas it is 77 percent. Furthermore, the report shows that the situation in
the country has hardly improved from 1990 levels (total coverage increased of two percentage
points, from 54 percent to 56 percent) (JMP 2015, p. 75).2
JMP data suggest that it is difficult to
find reliable and unequivocal data about the number of Tanzanian citizens who have access to
safe water services, and that still – to guarantee the right to water - high efforts are required.
1.2 The legislative and policy framework
National Water Policy (NAWAPO), published in 2002, establishes the most relevant principles
for water sector. In order to increase the effectiveness of policy actions, this document divides
the sector into three different areas. The first area is called Water Resources Management, and it
deals with water considered as a natural resource; therefore, NAWAPO describes Tanzanian
would be the result of multiplying the number of water supply systems and the estimated amount of citizen using
those systems. This definition has been confirmed by an officer of the Minister of Water. The government does not
publish data about real (and not estimated) access to water supply system. Yet, in the WSDP II report, there are
some data labelled “water access” rather than “water coverage”. They are lower than the usual coverage percentages
presented by the government. These data are: 51 percent of water access in rural areas (June 2014), 68 percent in
Dar es Salaam (December 2013), 80 percent in urban regional centres (December 2013) and 53 percent in District
headquarters, small towns and areas covered by national projects (December 2013) (WSDP II 2014, p. xiv-xv).
Despite the difference in the data between the NRWSS and WSDP II report, a government's officer explained that
“water access” and “water coverage” cannot be considered differently.
2 JMP data, depicting a more pessimistic picture of the water supply sector in the country, seem consistent with a
paragraph of the WSDP phase II report. Namely, the latter states that: “although the water supply water coverage
that were being reported before the Big Results Now initiative indicated coverage about 57% of people in rural
areas; the detailed lab data analysis of water point data, found that due to degrade infrastructure, the actual baseline
coverage was about 40% with 5.3 million rural residents having lost supply of water because of inadequate
maintenance or infrastructure” (WSDP II 2014, p. 22).
17
water resource potential and it states the basic management principles of natural water sources.
The country is divided into nine hydrological zones or river basins, and the objectives and the
criteria for water protection, quality management and pollution control are identified. The other
two areas deal with water supply: the first with rural areas and the second with urban ones. For
the purposes of present research, it is useful to present briefly the principles and the objectives
contained in NAWAPO about rural water supply. They are:
1. Community participation. In order to achieve sustainability of water projects in
rural areas, communities have to be involved in different ways. First, they should
legally own the facilities and participate in planning and management. Second,
communities should be able to choose the appropriate technology for water supply
projects and they should also be involved in designing and constructing the projects.
Third, communities should become fully responsible for operation & maintenance
of the schemes (NAWAPO 2002, p. 32-33).
2. Private sector participation. The water sector has been dominated by the public
sector. The contribution of the private sector in service delivery of water supply
services will enhance effectiveness and enhance development. Therefore, an
enabling environment for private sector participation should be fostered, the
government should assist local authorities on this issue and communities should be
educated about the importance of private sector in rural water supply (NAWAPO
2002, p. 34).
In 2009, the Government approved two Acts that constitute the basis of the legislative framework
for the water sector. The Water Resource Management Act, that deals with water as a natural
18
resource and The Water Supply and Sanitation Act (WSSA), which is concerned with water
supply and sanitation in urban and rural areas of the country. This law coherently adopts
NAWAPO's division of the country in urban and rural areas: Water Authorities become the
entities responsible for water supply in cities and towns (regulated under part IV of the act),
while in rural areas Community Owned Water Supply Organisations (COWSO) should be
established (part VII of the Act), becoming the organisations legally responsible for water
provision. WSSA is the normative source for understanding the framework of responsibilities
and functions of the involved administrative bodies:
 The Minister of Water should be responsible for providing technical and financial support
for the construction of water schemes, for ensuring provision of technical assistance to
Local Government Authorities and for monitoring and coordinating the strategies of
water schemes management entities.
 In the Prime Minister’s office, the Minister of State for Regional Administration and
Local Government should be responsible for the supervision of water supply service, for
creating conducive environment and enabling the participation of communities and
private sector in the water sector development process.
 The Regional Secretariats should be responsible for providing guidance to LGAs and for
monitoring them.
 The Local Government Authorities (Districts and Wards) should be responsible for
coordinating and monitoring the financial management of Water Authorities and
COWSOs. Furthermore, they should be responsible for facilitating COWSOs
establishment and registration. When needed, they should approve by-laws in water
supply sector (WSSA 2009, p. 433-434).
19
The Water Supply and Sanitation Act also states the principles that have to be followed in
managing water supply. They are:
 Decentralization. Management functions should be delegated to the lowest appropriate
level.
 Financial autonomy of Water Supply and Sanitation Authorities.
 Transferring ownership of water schemes to communities in rural areas (through
COWSO).
 Costs of operation & maintenance should be met by local communities.
 Promotion of Public & Private Partnerships for the provision of water and sanitation
services (WSSA 2009, p. 433).
The most important effort of the Government in order to implement a comprehensive plan about
the water sector consists of the Water Sector Development Programme. The first document
drafted is the WSDP 2005-2025 consolidated report (published in July 2006), which has a
twenty-year vision on the whole sector, on the challenges and the specific objectives and
indicators of Water Resource Management, Rural Water Supply and Urban Water Supply and
Sewerage Management. Following the publication of this document, the Minister of Water
provided stakeholders and administrative bodies with some relevant guidelines: these are the
annexes to the WSDP programme, which gave directives on many specific issues (e.g. training of
district officers, facilitation manuals for communities, field monitoring guides and financial
management formulas).
Recently, the Government published two other WSDP documents: the Water Sector Status
Report – Making the end of WSDP phase I (in October 2014) and the WSDP phase II 2014-
20
2019 (in July 2014). The firs report is a comprehensive assessment of phase I of WSDP. It
describes the performances in the three main areas (water resource management, urban and rural
water supply), the financial resources originally committed and the actual disbursements,
together with a critical review of challenges and future actions. The second document moves
from lessons learned in WSDP’s phase I in order to improve strategic interventions, institutional
setting and financial disbursement. It brings some changes to the general structure of WSDP
programme. Instead of four sectors (water resource management, urban water supply and
sanitation, rural water supply and sanitation and institutional strengthening/capacity building),
the new phase is organised around five areas. The Government provided a new structure for the
sanitation programme - which became an independent area – and constituted a new component,
labelled Programme Delivery and Support, which should facilitate effective enforcement of other
sections' plans. Despite some changes and improvements in the WSDP organisation, phase II
seem to establish too ambitious target objectives, compared with the achievements of past twenty
five years. For instance access to water in rural areas should increase from 51 percent in 2014 to
80 percent in 2019. In Dar es Saalam access should increase from 68 percent in 2013 to 95
percent in 2019 and in urban regional centres access should increase, in the same years, of 18
percentage points (from 80 percent to 98 percent) (WSDP II 2014, p. x-xvi).
The most recent document drafted by the government about the water sector is the National
Rural Water Sustainability Strategy (July 2015 - June 2020). This report (the latest version
was published in July 2015) is concerned only with water supply in rural areas, but it is a very
important tool to understand sector achievements and challenges. The strategy analyses first the
main problems faced in improving water supply service, and namely:
 Inadequate attention to operation and maintenance.
21
 Low community participation in project implementation.
 Limited capacity of communities to maintain operative the water schemes.
 Poor supply chain for spare parts (NRWSS 2015, p. v).
Then, it proposes some strategic actions to improve the situation and give effectiveness to
previous plans and reforms. Major initiatives include: recruiting and training more workers for
helping COWSO system, establishing centres of excellence to support operation and
maintenance activities, developing community awareness campaigns as also quality data
management system. Furthermore, for each specified action, the strategy specifies which are the
responsible administrative bodies (NRSS 2015, p. 12-28).
1.3 Aim of the research: why water schemes management in rural water projects is a key
element for sustainability
The present research is focused on water schemes management. On the one hand, a deep analysis
of the COWSO system will be presented. In fact, they represent the key actor chosen by the
government in order to achieve the objectives set in the rural water policy. Despite the COWSO
legislative framework is almost seven years old, the pace of formation and registration is still
low, as WSDP II underlines, the COWSOs that are registered are only 460 over 2,727 planned
(i.e. 17 percent) by Big Results Initiative until June 2014 (WSSR 2014, p. 17). Furthermore, in
order to fulfil the goal of transferring the legal ownership of water projects to local communities,
COWSO must be must be established and registered and must participate in “owning, planning,
maintaining and operating water supply projects and sanitation facilities” (NRSS 2015, p.6).
On the other hand, the research investigates the role of the private sector in rural water supply.
There are many public water schemes that are currently run by private citizens (called private
operators or private agents). How are these schemes performing? How can the private
22
management of water schemes be integrated with the law and the policy? These are the main
questions the research aims to answer. Furthermore, stakeholders shall start to look at private
participation in the water management not in antithesis with respect to the COWSO system.
Already since NAWAPO, the government suggests to foster the involvement of privates in water
service delivery, and the decision to transfer the legal property of water projects to communities
should not be interpreted as an obstacle to this aim. COWSO and privates can coexist. The
research wishes also to contribute to an assessment of future possible increases in private
involvement in water sector. Which services can the private sector provide in an efficient and
profitable manner? And which are the risks for communities in case of increasing private
involvement?
In general, in order to reach the principal objective of improving rural water coverage, the issue
of management should not be underestimated. It is a crucial aspect in the sector. Too many water
projects collapse because of poor management. Surveys found that only 54% of existing rural
water points is functional, and 25% of the schemes after only two years from installation are no
longer functioning (Water Aid 2009, p. i). As underlined by the government in the water policy,
operation and maintenance is a key element for schemes' sustainability. The sector needs
effective management models, which are able to provide services to communities, to guarantee
schemes sustainability thanks to a satisfactory financial management and to report the necessary
information to the local government authorities. As specified in the 2010 report “Myths of the
Rural Water Supply Sector”, drafted by the Rural Water Supply Network, building new water
supply systems is not more important than keeping the old one working. “Too little attention is
paid to how communities are likely to deal with the real-life complexities of a water supply
system” (Rural Water Supply Network 2010, p. 3). Designing realistic and effective management
23
models is surely a part of the solution to the problem of schemes sustainability.
Another crucial aspect for the long-term stability of rural water schemes is monitoring. Often the
management lacks of the necessary training or information; and if nobody is conducting a serious
monitoring of schemes and management performances, the probability of a scheme to collapse
increases substantially. Therefore, the research aims to investigate which are the main challenges
in current monitoring at a district level, developing at the same time an easy and efficient tool to
supervise water schemes performance at a village level.
1.4 Research methodology and study area
The general aim of the research, the methodology and the expected outcomes have been deeply
discussed with three crucial stakeholders: the National Water Network TAWASENET, the
Minister of Water and the University of Dodoma. At an early stage of research planning, a
meeting with TAWASENET helped in drafting a first outline of the project: the three core
elements of the project (COWSO establishment and registration, the role of private sector and
water schemes monitoring) had been deeply discussed and a first theoretical framework has been
developed. The research team considered the rural water supply policy as a flow of information
and responsibilities: starting from the normative and national framework of the Government,
moving to districts – which are the administrative and political bodies that have the specific duty
of implementing government's plans, and arriving at villages, where the water schemes have to
be concretely realized and managed. These three levels are sequential stages of a chain, in which
every step has the same importance in order to give concrete realization to the policy. The main
research’s objective shifted on the investigation of this flow of information and on the
institutional responsibilities on the three core topics. Yet, after having acknowledged the
24
considerable difficulties of such an extensive work, and thanks to the suggestions of the above-
mentioned institutions, the research team developed the project's field research in the following
way: first, the research focuses on the Dodoma region. This helped to reach the ambitious
objectives together within the limited time available. Furthermore, the research can be
considered as a pilot project, in which objectives and methodology are easily extendible to other
regions or to the national level.
Second, the empirical research focuses mainly at a district level. A deep analysis of both
Governmental policy and villages’ implementation problems is provided, with different aims. At
scheme level, the research team tried to test a monitoring tool for the water schemes, in order to
contribute to the discussion on the main challenges for long-run sustainability of rural water
schemes.
At Governmental level, the research team proposed an analysis of the normative and policy
framework, assessing which are the strong and weak points. This framework had been developed
thanks to the constant contribution and suggestions of TAWASENET and the University of
Dodoma (UDOM). The latter institution provided effective help to the research team by joining
the project through the participation of a UDOM’s student. At the same time, following the
positive dialogue with the government, the Ministry of Water officers provided the research team
with a presentation letter that contributed to a smoothen the planning of the field activities in the
districts.
The field research at District level consisted of seven semi-structured interviews with the District
Water Engineers. These officers are employed by the District and manage the Water Department.
They are responsible for the water supply and the sanitation services; furthermore, they
constitute the principal reference for water schemes management in the villages.
25
The second part of the field research was planned at village level. In each district, DWE
suggested to the research team three water schemes with various management models. In
Kongwa and Chamwino districts, thanks to previous L.V.I.A. knowledge of the areas, the
research team was able to visit five water schemes in each district. This helped to make a
preliminary testing of the monitoring tool (e.g. the time needed for each water scheme).
1.4.1 Seven districts of the Dodoma region
The selected area of investigation includes all seven Districts of the Dodoma region. These are:
Bahi, Chamwino, Chemba, Dodoma, Kondoa, Kongwa and Mpwapwa. The Dodoma region was
selected as consequence of the fact that L.V.I.A. works in Kongwa and Chamwino districts since
more than twenty five years, enabling the research team to have enough background knowledge
about the water supply situation in those areas. The Dodoma region located in the central plateau
of Tanzania, is one of the poorest region of the Country. The climate is semi-arid, with a unique
rainy season of 4-5 months. The annual rainfall is about 400 mm per year. The rainfall pattern is
very variable and every seven-six years a cyclic drought event can happen.
Based on the mentioned meetings and a careful review of existing laws, policy and the water
sector scientific literature, the research team prepared a questionnaire for conducting the semi-
structured interview with the DWEs. The questionnaire was divided into three sections:
 COWSO establishment and registration. This section, made of twenty three questions,
dealt both with quantitative and qualitative information on COWSO. First, the document
included quantitative questions on the number of COWSOs (registered and unregistered),
average time and funds needed for a registration, total amount of funds in the water
department. Second, the questionnaire included questions on district's strategy to improve
the registration procedure, the existence of government guidelines on COWSO, the
26
degree of district involvement in COWSO establishment, together with problems and
suggestions for COWSO formation and registration.
 Private sector involvement into water supply system. The second section, made of
fourteen questions, focused on the number of private operators managing water schemes
(with or without contract), the degree of district involvement in private operators
selection and in contracts drafting, a comparative assessment of private operators
performance in managing water schemes, problems, future strategies and suggestions for
increasing the involvement of privates in water supply sector.
 Monitoring & Supervision. The last section, made of eleven questions, investigated how
DWEs and their teams conduct monitoring and supervision on water scheme
performances. Questions about the type and frequency of monitoring were formulated,
together with the kind of support provided to water schemes. This section was developed
in order to enrich the research part at scheme level that primarily deals with monitoring.
For this purpose, the questionnaire included a question to DWEs about which indicators
they considered mostly relevant for water schemes performance.
The research team succeeded in conducting all interviews to DWEs during three weeks. Only in
one District (Mpwapwa) the team could not conduct the interview directly with the DWE
(because of pre-scheduled duties), but the team met the person responsible for COWSO
registration and another officer of the DWE’s team, who were able to provide complete answers
and all requested data. The questionnaires were drafted in English, although the composition of
the field research team (four people with two Kiswahili native speakers) allowed to switch from
English to Kiswahili in case of misunderstandings or linguistic problems. Generally, in order to
use time efficiently, a sub-team of two components conducted the semi-structured interviews
27
with DWEs. Moreover, because the questionnaire included both open and closed questions,
generally one researcher conducted the interview while the second one was taking notes. After
having concluded the field research, in some cases it was necessary to contact again the DWEs
for completing the dataset. The average time needed for the semi-structured interviews was 1
hour and 30 minutes.
1.4.2 Twenty-five water schemes in seven districts of Dodoma region
Based on the existing literature on the field and on the long lasting experience of L.V.I.A.
employees, the research team developed a monitoring questionnaire for the water schemes
management entities. It was established on the basis of two key principles: first, it should have
been able to measure effectively water scheme performance; second, it should have been an easy
and fast tool, requiring only a short visit to the village. The final monitoring tool is a
questionnaire with thirteen questions for water schemes management entities and two questions
for the users. It is constructed upon three indicators:
1. Functionality. This indicator assesses the quality of current service delivery performed
by water schemes management. It is based on the percentage of functioning water
distribution points and on the existence of a proper financial management.
2. Stability. First, it assesses the long-run sustainability of the water scheme by checking if
the management entity has savings and of which amount per distribution point. Second,
it examines the type of management entity. It attributes higher values to management
entities that are more likely to be stable (e.g. registered COWSO) and that are as by the
law enacted (e.g. private operators with contract, COWSO).
3. Satisfaction/communication. The last indicator assesses the degree of users’ satisfaction
28
about the service. Furthermore, it examines whether the management entity is providing
the necessary information on scheme performance to the community, to village
government and to district.
The field research at a village level has been conducted together with the DWEs interviews: in
three weeks the planned villages have been monitored. Often, the research team split in two in
order to conduct the monitoring: two team members interviewed the management entities and
two team members interviewed the water users. The interviewed users were at least five in each
village, following a gender balanced selection. The average time needed to conduct the
monitoring in two teams was 50 minutes.
This is the complete list of the villages in which the research was conducted:
Bahi district: Babayu, Mayamaya and Zanka.
Chamwino district: Huzi, Mgunga, Mlebe, Mnase, Muungano.
Chemba district: Magasa, Mhlongia and Waida.
Dodoma municipal area: Ihumwa, Mapinduzi and Nghong'ohna.
Kondoa district: Kwayondu, Madisa and Soera.
Kongwa district: Laikala, Leganga, Mageseni, Majawanga/Moleti and Nolini.
Mpwapwa district: Chunyu, Kimagai and Kisokwe.
29
2. Water schemes management: COWSO system and private sector
participation
2.1 Framework: laws and policy
2.1.1 COWSO
The Water Supply and Sanitation Act No. 12 of 2009 introduces Community Owner Water
Supply Organizations (COWSO) as the only legal management entities entitled to implement the
NAWAPO’s community participation (and ownership) principle in rural water supply system.
The Act illustrates how COWSOs are formed and registered and how communities can
effectively participate in owning, planning, maintaining and operating water supply projects and
sanitation facilities.
In accordance with the Act, COWSOs established under section 31 may take the following
prescribed forms: water consumer association, water trust, cooperative society, non-
governmental organization, company, any other body as may be approved by the Minister.
Managing, operating and maintaining the water scheme and the provision of safe water to the
consumer are the main powers and functions of COWSOs. Besides these, they should make rules
for the use of public taps, install meters to measure the amount of water supplied, charge the
consumers for the water supplied and consult and cooperate with the village or any other
institution responsible for land (WSSA, 2009, p. 450).
The proposed members of the entity should prepare a Constitution/Statute or a Memorandum of
Understanding (MoU) and submit it to the local government authority for approval. Upon request
of the community or of a group of people who intend to establish the association, the local
government authority shall provide assistance in formulating the constitution or the MoU. After
30
approval of the constitution and community organization’s establishment, COWSO has to be
registered and published in the official Gazette. The registration responsibility has to be shifted
from the Ministry of Water to the Local level where there will be a registrar responsible on
behalf of the Ministry. From the date of the registration the community organization shall be
responsible for the water supply system and all the water consumers shall be required to
contribute for the water provision and the sustainability of its system. (WSSA, 2009, p.451)
Water Status Report – Making the end of WSDP (October 2014) affirms that COWSO
registration needs to become a priority and underlines poor results achieved in the phase I of the
program. The very recent National Rural Water Sustainability Strategy (NRWSS 2015)
recognizes same challenges and addresses and defines key actors and their responsibilities.
Moreover, in order to ensure the sustainability of water supply system, it provides strategic
interventions that are divided into three implementation terms (short-term; medium-term; long -
term).
Shortening the process of registration and formation of COWSO is one of the short-term
priorities set out in the strategy. In fact, in order to shorten the process from 251 (current
average) to 42 days, the Government identifies key interventions such as: i) allocating and
disbursing funds, ii) developing COWSO database, iii) enforcing capacity building programmes
and iv) including clear COWSO registration guideline in the Program Implementation Manual.
The NRWSS identifies the role and responsibilities of LGAs in supporting the rural water supply
service, within the COWSO’s framework:
• Promote establishment of COWSOs and provide technical assistance to them;
• Co-ordinate COWSO budgets within Council Budgets;
31
• Resolve conflicts within and between communities;
• Formulate by-laws on water source protection, water supply and sanitation;
• Improve the enabling environment e.g. working with the local private sector to improve water
facilities supply chain.
Finally, NRWSS presents main gaps between policies and practice: LGAs are often unable to
meet their obligation in the facilitation of COWSO. “There are not efficient mechanisms to
assure transparency, integrity and accountability for income and expenditure at community level.
Capacities and skills are inadequate to manage rural water supply services” (NRWSS, 2015, p.
23). The consequence of these problems can be serious: as stated by the strategy, “Often
COWSO are not better than the earlier Village Water Committees as they have inherited the
same challenges of their former institution set up” (Ibid.).
2.1.2 Private sector
Since 2002, when the National Water Policy (NAWAPO) was launched, new collaborations and
partnerships with the private sector have been constantly promoted as a new approach for the
sustainable development of water supply service in rural areas.
Then, in 2006, the WSDP Programme (Annex V) defined and described private agents as
providers of goods and services: they can support communities in conceiving, planning,
designing, constructing, maintaining and managing their water supply and sanitation facilities
(WSDP Annex V, 2006, p.4). Hence, according to this definition, the following entities were
(potentially) considered as part of the private sector: NGOs, consultants, drillers, contractors,
suppliers of pipes/pumps/other materials, private operators, artisans etc. But, although the
Government is encouraging private participation at all project cycle’s levels, there are yet no
strong policies and programs to attract private sector investments.
32
WSDP II more generally suggested the promotion and strengthening of independent
management entities, such as “Water User Groups, Water User Association and Private operator”
(WSDP II, 2014, p.61). In fact, the document states that in some areas autonomous entities are
found to be more sustainable, although there is a higher risk of excessive profiteering for private
operators. However, this risk can be reduced or avoided by stipulating well-designed contracts
with specific duties, roles, responsibilities and penalties of the parties.
Act no. 12/2009 regulates private sector participation in water supply, establishing - under
section 35 - that a “service provider” may be hired by COWSOs for performing its functions and
exercising its powers. In order to accomplish this role, they shall sign an agreement with specific
terms and conditions that shall be approved by the local government authority. Furthermore, it
includes “Companies” as one of the corporate bodies prescribed in accordance with the section
31. In this way the Act seems to establish two different levels of private sector participation,
even though there is no large experience of the latter and confusion regarding role and legal
framework of “service providers” at local level.
Should the private sector be considered only as a service provider or can it also perform other
functions? As the research will show, the most common role of the private sector in the rural
water supply is the private operator (PO) that is often operating water schemes, and mostly with
no contract and no supervision of COWSOs. Therefore, are these POs working out of the legal
framework? Which roles can the private sector play and which one will be promoted by the
Government? What kind of partnership and collaboration is the Government looking for? These
are the questions which remain unanswered and must be clarified. The Government should reply,
providing clear policies, coordination, harmonization and practical mechanisms of support and
implementation.
33
2.2 Data analysis of the districts
2.2.1 Types of management
The first question to District Water Engineers assessed the total number of water schemes in
each district. According to their answers, in the region of Dodoma there are 397 water schemes,
divided in seven districts. The following graph shows the quantity of water schemes per district.
Graph 1: Total number of water schemes in each district of the Dodoma region
It is important to note that the quantity of water schemes differ from to the number of villages: in
fact, some water schemes serve more than one village. The district with the highest quantity of
schemes is Kondoa (77). Five districts have a number of schemes between 49 and 65, while
Dodoma Municipal Area is the smallest with 36 water schemes.
52
77
36
65
62
56
49
0
10
20
30
40
50
60
70
80
90
KONGWA KONDOA DODOMA CHAMWINO CHEMBA BAHI MPWAPWA
Total number of schemes
34
Graph 2: Types of management (in percentage) in the Dodoma region
Graph 2 presents the percentage of each management entity at regional level. First, it can be
noted that there are four types of managements:
 Village Water Committees are the majority with 56 percent.
 Private Operators are the second largest group with 28 percent.
 COWSOs amount to 15 percent.
 Water Authorities represent only 1 percent of the management entities.
More than half of the schemes are run by “Village Water Committees”. This kind of
management entity existed in Tanzania long before COWSOs and Private Operators, and that’s
why VWCs run the majority of water schemes. Generally, the committee is constituted of at least
5 members selected from village council (in some villages the financial and planning committees
of Village Government have the responsibility of management). Sub villages are often
represented in these committees, as well.
“Private Operators” are usually citizens of the village who become managers of the water
scheme. They use to sign contracts with the Village Government, agreeing on financial and
1%
15%
28%
56%
0%
10%
20%
30%
40%
50%
60%
Water Authorities COWSOs Private Operators VWC
Type of managment entity
35
technical issues concerning the scheme. Generally these contracts do not last more than two
years, and usually they specify the amount of money that the Operator has to pay every month to
the VG. In fact, the PO meets the running and maintenance costs by its own (up to a certain
amount), keeps all the revenues and pays an agreed monthly fee to the village.
COWSOs are the entities entitled to legally own the water schemes. Additionally, they can
manage directly the water systems or they can appoint “service providers”. The process of
establishing COWSOs in the rural areas of Tanzania has still to improve and the Dodoma region
can be considered an example of this challenge: only 15 percent of all management entities are
COWSOs.
Water Authorities shall be established in urban areas and small towns to manage water supply. In
the Dodoma region that is mainly constituted by rural areas WAs are few, while another legal
entity is in charge of the water supply service in the capital city: DUWASA – Dodoma Water
Supply & Sewerage Authority.
Graph 3: Percentage of each management entity in the seven districts of the Dodoma region
0%
10%
20%
30%
40%
50%
60%
70%
80%
90%
100%
Water Authorities
COWSOs
Private Operators
Village Water Committee
36
Graph 3 shows the distribution of different management models across Dodoma’s districts.
Almost in all cases the most common management is the Village Water Committee: the
percentage goes from 50 to more than 80 percent in five districts. Chamwino District is a
peculiar exception, having the highest quantity of Private Operators (almost 90 percent of
district’s schemes). Then, just three districts have a percentage of COWSO from 20 to more than
30 percent, while the other four districts have approximately from zero up to ten percent of
COWSOs.
2.2.1.1 Types of COWSO
Interestingly, DWEs reported that all the COWSOs in their district have the legal form of “Water
Consumer Associations”. As already mentioned, the COWSOs might be of various kinds (e.g.
companies, NGOs, cooperatives). Yet, in all districts the predominant models are the WCAs.
Why is this occurring? One explanation could be that, since NAWAPO (when government’s
policy was oriented to increase the independence of water management entities in rural areas) the
involvement of communities has always been achieved through fostering the participation of
water user bodies. The first National Water Sector Development Programme - published in July
2006 - calls these user bodies “Water User Groups” and “Water User Associations” (p. 4-14).
The first category usually refers to a group of people having a common water distribution point.
WUGs can also form groups at a larger scale, which might take the responsibility of managing
the entire water scheme. These bodies are called “Water User Associations” and are constituted
by village communities’ members that own and manage the water supply independently from the
political power of the village government. Basically, this is the main difference between a
Village Water Committee and a Water User Association: in the first one, members are selected
according to the political entity of the village, while in the second one the composition follows a
37
“bottom-up process”, from Water User Groups to WUAs.
At this point some terminological confusion arises: “Water User Associations” is a label which,
since NAWAPO, has been used also in a different context. Namely, this word has been used in
the Water Resource Management framework, not in Rural Water Supply. As already mentioned,
water resource management is concerned with water considered as a natural resource, and its
main objective is to properly manage natural water sources of the country (rivers, lakes,
wetlands, springs, groundwater aquifers) to reach a sustainable socio-economic development. In
this context, “Water User Associations” are the lowest appropriate management level (i.e. at
villages), being responsible for “mediation of disputes among users and between groups within
their areas of jurisdiction, [...] conservation and protecting water sources, and catchment areas,
efficient and effective water use, […]” (NAWAPO 2002, p. 28). Furthermore they provide
legitimate representatives in water resource management entities at higher levels. So, since 2002,
the label “Water User Association” has been used in the water resource framework, rather than
rural water supply. Therefore, the Water Supply and Sanitation Act of 2009 chooses another
word in order to refer to WUAs that are managing water supply facilities. It called them “Water
Consumer Associations”. Consequently, laws and policies started to use this other label in order
to distinguish the two concepts.
Looking at the evolution of community participation, it is now more understandable why, in the
Dodoma region, all COWSOs are WCAs. The idea of establishing and registering COWSOs
entered in a context in which, since some years, communities could manage water schemes
through entities called Water User Associations. Therefore, for all actors involved (districts,
village government and water users) it has been easier to think of COWSOs as associations of
water users, rather than private companies, NGOs, cooperatives, etc. Furthermore, there is no
38
document that explains in details how to establish all different types of COWSOs.
2.2.1.2 Role of Private Operators
As described previously, it is difficult to deduce unequivocally the role of private operators in the
management of rural water projects from the normative and policy framework. Since the
approval of WSSA in 2009, every scheme should be owned by a registered COWSO that, in a
subsequent moment, could decide to appoint a (private) service provider to engage management
functions. Government suggested in many documents to increase the participation of private
operators in rural water supply; yet, the only normative framework that can include private
operators seems to be the COWSO system. Concrete reality in the Dodoma region is very
different from this theoretical analysis. Almost all Private Operators have written or oral
agreements with the Village Governments rather than COWSOs (the only exception are three
schemes of Bahi District that have COWSO and PO together).
In all districts analysed, private operators are not companies, but citizens appointed by village
authorities - usually through open calls - to run the water schemes. As previously mentioned,
they manage water supply under all points of view. All District Water Engineers highlighted that
POs are collecting water fees, paying tap attendants and are responsible of ordinary technical
maintenance of the scheme (for extraordinary works it is normally the village covering costs).
They usually pay a monthly fee to the VG as a kind of rent for the water scheme, which - in the
large majority of the cases - remains property of the village. When describing the role of private
operators, only one DWE did not mention ordinary technical maintenance of the scheme as their
duties.
Although POs can be considered fully responsible for the management under a practical point of
view, in Chemba District the DWE had a slightly different view: “POs are within the control of
39
VG or water committees, so it is the VG that can be considered to manage the scheme”. This
observation highlights the fact that the communities shall always be considered the “real”
managers, which can freely decide to delegate their functions to other actors.
2.2.2 Resources for COWSO
After having assessed some general information for each district (e.g. the number of water
schemes and the management types), the interview with the DWEs focused on the issue of
Community Owned Water Supply Organisations. In order to be able to establish and register
them according to the normative framework, districts need basically three elements: adequate
financial resources, proper information/guidelines and trained officers. Therefore, in the section
of the interview about COWSOs establishment and registration, the questionnaire focused on
these three elements.
2.2.2.1 Funds
The following graph presents, for each district, the percentage of water department's budget
(2015) dedicated to COWSO establishment and registration.
Graph 4: Percentage of Water Departments’ budget (2015) for COWSOs establishment and
registration.
0%
9%
0% 2% 0%
26%
3%
0%
10%
20%
30%
KONGWA KONDOA DODOMA CHAMWINO CHEMBA BAHI MPWAPWA
Percentage of Water Departments' budget for COWSOs
establishement and registration
40
As it is possible to recognize by looking at the graph, the situation in the region is very
heterogeneous. In two cases – Kongwa and Dodoma – DWEs explained that they do not have
any specific budget line for COWSOs. When they need some funds for establishment or
registration of COWSOs they reallocate resources from the general budget of the water
department. This procedure requires some bureaucratic steps: the request for reallocation must be
officially formulated and approved by the responsible district offices. In Chemba district, the
Water Engineer said that he deleted from the 2015 budget the line of COWSOs because of
substantial reduction in the available funds: “This year I have enough resources to construct only
one new water project” said the engineer.
In two districts – Chamwino and Mpwapwa – the funds available for COWSOs are a small
percentage of the total water department's budget: respectively 2 and 3 percent. In Mpwapwa, the
officers underlined that in case more resources would be needed, the department will proceed
with the reallocation procedure. Kondoa District Water Engineer allocated 9 percent of the
budget to COWSOs; furthermore, he highlighted that there are some resources available for the
establishment and registration from the national Water Sector Development Programme and
from external donors. Finally, Bahi district allocated 26 percent of the budget to COWSOs.
Interestingly, two District Water Engineers affirm that, sometimes, it is possible to use a part of
water scheme savings in order to facilitate the development of the existent management into a
COWSO. All Districts - except one - reported that it is impossible to reallocate the resources
dedicated to COWSOs once the budget is approved. It was underlined that the procedure to
disburse funds for the activities has been computerized and it is consequently not possible to
change the destinations. In Mpwapwa, the officers reported, on the contrary, that they can
41
reallocate resources dedicated to specific activities during the budget review of mid-year. Yet,
the procedure is long: the department can make the proposal that has to be approved first by the
District Executive Director and the by the full district council. The definitive decision is taken at
regional level.
2.2.2.2 Documents & guidelines
In order to determine whether the District Water Engineers have all the necessary information on
the government policy about COWSOs, the research team asked if the relevant documents and
laws were available.
Graph 5: Percentages of availability of some relevant documents at DWEs’ offices..
The question focused on five paper documents and one website. Graph 5 shows the availability
of the documents at regional level:
 All seven DWEs have in their offices three documents: the National Water Policy of
2002 (NAWAPO), the Water Supply and Sanitation Act of 2009 (WSSA) and
government guidelines on COWSOs establishment and registration. These guidelines
100% 100%
57%
100%
57%
29%
0%
20%
40%
60%
80%
100%
120%
GUIDELINES WSSA WSDP II
REPORT
NAWAPO NRWSS PIM WEBSITE
Availability of water sector's relevant documents at District level
42
were written in the years following the adoption of the national Water Sector
Development Programme and were updated after the approval of WSSA in 2009.
 Four out of seven DWEs (57 percent) have the last report of the WSDP (called Water
Sector Development Programme – Phase II, published in July 2014) and the National
Rural Water Sustainability Strategy (available in the Minister of Water website since
August 2015).
 Only two DWEs (28 percent) checked the new website of the Programme
Implementation Manual for the WSDP II. This website is divided into the five
components of the new WSDP phase. Component II – Rural Water Supply and Sanitation
– contains updated information about the implementation procedures and strategies.
Furthermore, it is possible to download all relevant laws and documents on rural water
supply.
From DWEs answers it is possible to recognize that the flow of information from government to
Local Government Authorities face some challenges. Documents that are relatively old are
known and available in the districts. In case of more recent policies, i.e. WSDP II and NRWSS,
three engineers reported not to have them. This implies that the engineers are not properly
updated about the recent national strategies and new targets in rural water sector. Another
example of this “information challenge” is the fact that the majority of DWEs have not yet
visited the new useful website for the implementation of WSDP II.
2.2.2.3 The role of CWSTs and other district officers
The council/community water and sanitation team (CWST) is the key body in the management
of all water and sanitation issues at district level. In phase I of WSDP, MOW referred to it as
District Water and Sanitation Team (DWST) but in more recent documents like WSDP II and
43
NRWSS, the name changed to CWST. They have to be formed in each district to facilitate
coordination of the different departments that have responsibilities in water and sanitation.
Teams' responsibilities are to provide the day-to-day leadership, planning and coordination of
water and sanitation activities at district level (PIM annex 9, 2006, p.6).
In the Dodoma region all districts have CWSTs. They generally consist of 6 head of departments
or their representatives and the District Executive Director (DED) as chairperson. The teams
include representative from LGA Director Office (DED), District Planning Office (DPLO),
District Water Engineer (DWE), District Health Office (DHO), District Community development
Office (DCDO), District Education Office (DEO) and District Treasurer (DT). The total number
of members of the team varies across districts; it ranges from 7 to 10. In some districts, most
important departments like Community Development and Water send more representatives; thus,
they have a larger team.
In each district CWSTs have different responsibilities. Specifically for COWSOs strategy,
CWSTs are accountable for organizing and supervising the whole process of establishment and
formation. They should also monitor COWSOs performances. In one district, DWE highlighted
that CWST is responsible for preparing meetings, disbursing fund and designing the plans for
implementation of water projects.
For COWSOs establishment and registration process, some responsibilities are performed by the
whole team, while some others are implemented within the single departments with close
assistance of the team whenever necessary. In the establishment process, the CWST is
responsible for sensitizing and train the community on COWSOs strategy. Once the community
is motivated to create the new entity, the team provides representatives to facilitate the process of
selecting COWSO leaders. In some districts, the entire team participates to field activities while
44
in some others, because of financial problems, only few members can be involved.
In order to understand deeper the role of the districts for COWSOs establishment, it is useful to
look at their involvement for the facilitation of COWSO leaders' election. Graph 6 shows, at
regional level, the type of activities conducted by districts (expressed in percentage of district) to
facilitate the COWSO establishment.
Graph 6: Facilitating activities implemented by district (in percentage) in COWSOs
establishment process
In four districts (57 percent), water department provides villages with the selection criteria for
COWSO leaders. They include: a gender balanced selection, an appropriate level of education (at
least being able to read, write and count – in Kiswahili KKK, Kusoma, Kuandika and
Kuhesabu), independence from the Village Government and a feeling of responsibility toward
the COWSO.
The same number of districts sends officers to facilitate the election process. In three cases the
district employees only check if the guidelines for leader selection are followed. In Mpwapwa
the degree of involvement is higher: first, the district provides cars for promoting COWSO
election; second, the officers help the village in preparing the electoral forms (generally the
57%
14%
57%
0%
10%
20%
30%
40%
50%
60%
70%
Providing officers to facilitate
the process
Providing assistance for
selection/templates
Providing criteria for leaders
selction
Districts' facilitating activities in COWSO establishment process
45
community itself decides whether to elect the leaders by raising hands or through a ballot box).
Again, Mpwapwa is the only district in which officers participate actively in the leader selection:
one CWST member helps the village in assessing the quality of the candidates.
2.2.3 COWSO’s processes
2.2.3.1 COWSO formation and registration achievements
The status of registration of COWSOs at national level is low. The water sector report for
marking the end of WSDP phase-I 2014 underlined that, out of 2,728 COWSOs planned by June
2014, only 460 (17%) were established and registered. The main problem highlighted by the
MOW is the lack of funds allocated by LGAs for undertaking the process. Often, even when the
funds are set, they are reallocated for other purposes (WSDP II p.17).
In the Dodoma region there are 72 COWSOs: 41 already registered (57%) and 31 (43%) in
process. The unregistered COWSOs are composed by: i) COWSOs that are already managing the
water schemes although the registration process is not completed (36% of all 72 COWSOs), ii)
COWSOs that are not operative during the registration process (7% of all 72 COWSOs). In the
last case, VWCs usually keep on running the water projects.
46
Graph 7: Percentage of registered and unregistered COWSOs in the Dodoma Region
In 2014, districts have registered the 49% of the total registered COWSOs (41) existing in the
whole region. Three districts did not register any COWSOs until 2014. The COWSOs planned to
be registered last year in all districts were 79 while only 25% were registered. The total number
of registrations planned in 2015 dropped with respect to last year by 9%.
In the Dodoma region the districts have different budgets for establishment and registration of
COWSOs; this affects the homogeneity of their plans. In fact, the number of COWSOs to be
registered yearly depends on the available resources. Some districts planned to register many
COWSOs last year but they reduced the number this year. Others increased the number this year;
one district plans to register the same amount as last year. The total amount planned this year
includes the COWSOs whose registration process started last year. For example in Mpwapwa
district, the 10 COWSOs planned for this year include 7 that are in the registration process since
last year. Only 3 new COWSOs are foreseen to be promoted and registered.
7%
36%
53%
4%
57%
COWSO established but not registered
and not operative
COWSO established but not registered
and managing the water service
COWSO registered and managing the
water service
COWSO registered but no directly
managing: supervising and
subcontracting PO
47
Graph 8: Percentage of planned and registered COWSOs
Interestingly, the two districts that did not register any COWSO in 2014 are the ones not having
a specific budget line for establishment and registration (Kongwa and Chemba). The third district
without separate budget is Dodoma that last year planned a very high number of registrations. It
is fair to say that districts with no dedicate budget for COWSO registration face more challenges
in planning the annual objectives as well as estimating the needed funds. Moreover, a detailed
plan with exact expenditures could speed the implementation phase and increase the
performances of the districts. Also the amount of budget dedicated to COWSOs seems to play an
important role for the registration rate: the two districts that achieved to register 100 percent of
last year plans (Bahi and Kondoa), are the ones which dedicated the highest percentages of water
budget to COWSOs (Bahi 26 percent and Kondoa 9 percent).
0
5
10
15
20
25
30
35
40
COWSOs planned to be registered
in 2014/2015
COWSOs registered in 2014/2015
COWSOs planned to be registered
in 2015/2016
48
2.2.3.2 Steps of establishment and registration
In order to guarantee a smooth establishment and registration process of COWSOs, the
government prepared guidelines that describe in details all the necessary steps and the actors
involved. The guidelines divided the procedure for creating a new COWSO in three distinct
activities:
 Establishment
 Registration
 Election of permanent committee
The establishment phase consists of ten steps. Among others, they include the presentation of the
general idea to the village assembly, the choice of which is the most suitable type of COWSO,
the drafting of constitution guided by an interim committee and final approval by the district.
The registration process consists of nine steps, starting from the village application (which shall
include, also the draft of the constitution and the minutes of meetings), to the examination of the
application by the district registrar, the payment of registration fee and the final approval with
the issue of the registration certificate.
According to the guidelines, the election of the permanent committee shall be done after the
conclusion of the establishment procedure. The permanent committee must be formed following
a gender-balanced approach and it shall have also an executive committee, according to the type
of COWSO established. On the contrary, the registration process should start before the end of
procedure for establishment; in fact, after completing constitution drafting, the interim
committee shall prepare an application letter to the district attaching also the registration form
and the fees paid.
During the interviews with the District Water Engineers, the research team asked about the
49
necessary steps for establishing and registering COWSOs. The question was open-ended, in
order to have exhaustive answers. From DWEs’ replies it is possible to highlight two main
differences from the official procedure. First, the election of the permanent committee is often
done before completing all the establishment steps. Only three districts underlined that the
interim committee has to be formed for drafting the constitution and that, only after this step,
COWSO leaders can be elected. In two cases there was no distinction between temporary and
permanent committees; while other two districts did not mention the committees at all.
Second, in DWE's answers, it is not possible to identify the last step of the establishment
procedure as it is prescribed by the guideline. In fact, a COWSO is considered established when
the District Executive Director sends a letter of approval. After this step it is possible to proceed
to the election of permanent committee. In all districts, the DWEs reported as the last step the
issue of the registration certificate, without mentioning a formal step for the conclusion of the
establishment. Therefore, the three activities (establishment, registration and election of
permanent committee) seem to be conducted without properly following the guidelines.
Graph 9 illustrates the ten official steps of the establishment procedure. They are described on
the x-axis. The bars represent the percentage of districts that implement each activity. The bars
coloured in red highlight the fact that those steps are conducted differently with respect to the
official procedure.
50
Graph 9: The ten steps of the establishment procedure and the percentages, for each step, of districts
that implement them.
The entire process is as follows:
1. The district, mainly through CWSTs, introduces the idea of COWSO to village
government (or to village water and sanitation committee). All DWEs reported this step.
2. The results of this introductory meeting will be shared with the community through a
village assembly. Six DWEs (86 percent) reported this activity.
3. The district, through the CWSTs, should illustrate to the village community different
types of COWSO and the various steps of their establishment. Thereafter, the community
should decide which type of COWSO they prefer. This step has been reported only by
one DWE (14 percent). Although it is very important to take an informed decision about
which type of COWSO should be established, the absence of this step is probably a
100%
86%
14% 14%
71%
100%
29%
43%
100%
43%
100%
0%
20%
40%
60%
80%
100%
120%
Process steps for COWSO establishment and registration
51
consequence of the fact that the majority of actors in the rural water supply think of
COWSO as associations of water users (i.e. WCA) not taking into account all other types.
4. In the official guideline step four includes the duty for the VG to call an assembly for the
formal decision on the type of COWSO. Thereafter, the assembly elects the interim
committee responsible for drafting the constitution. In the graph, the two activities are
divided in point 4.1 and 4.2. Only one DWE reported that the VG organizes the assembly
for deciding the COWSO type. At the same time, five DWEs (71 percent) told that an
interim committee is elected. The bar in the graph is red because, actually, two districts
did not distinguish between the interim committee and the permanent one: they simply
told that COWSO leaders are elected.
5. Step five is the constitution drafting. All the interviewed DWEs mentioned this activity.
6. In the official guidelines, at this stage the interim committee should present the draft of
the constitution to the village assembly for approval. During the interviews, only in one
case it was highlighted that the interim committee presents the draft. Another DWE
reported that the committee discusses it preliminarily with the VG, which, thereafter calls
an assembly. This procedure can affect the whole process: in fact, the decision about the
COWSO constitution should be made independently from the political authorities in the
village. In the graph, the bar (29 percent) represents the answers of these two engineers.
7. This step involves the Ward. The interim committee should send the constitution to the
Ward Development Committee for approval. Only three DWEs (43 percent) mentioned
this activity.
8. After Ward approval, the drafted constitution has to be sent to the district. There, the
DED should check the application and the minutes of meetings before giving his/her
52
approval. The bar is red because all the DWEs reported to conduct this activity in
different ways with respect to the official guideline. Some of them said that the CWST is
responsible for checking the constitution; some others attributed this role to themselves or
to the Community Development Officer.
9. All the documents shall be also ratified by the district's full council. Three DWEs (43
percent) reported this step.
10. At this point the DED shall send an approval letter to the village, formally recognizing
COWSO establishment. The bar in the graph is red because all the DWEs concluded their
lists by saying that a registration certificate will be issued by the district. This confusion
is consequence of the fact that there is no clear distinction between the establishment and
the registration procedures.
Districts simplify the procedure suggested by the guidelines. Indeed, the division into three
activities (establishment, registration and election of permanent committee) for a total of twenty
steps seems too complicated. The consequence of this complex procedure is the heterogeneity
across districts. Probably, districts are just adapting to a procedure which is too complicated.
2.2.3.3 Average time and funds needed
One key issue for improving the implementation of COWSOs in rural areas is the time needed
for establishment and registration. During the interviews with DWEs, the research team asked
how long, on average, the district needs to constitute a COWSO, from the first to the last step
(i.e. registration included). The answers vary from a minimum of 48 days (Mpwapwa) to a
maximum of 90 (Bahi, Chemba and Dodoma). Time suggested by DWEs is theoretical, it is
calculated considering all necessary resources available (funds, officers, etc.); otherwise it would
be hard to consider these averages realistic: in some districts there are still no registered
53
COWSOs at all. In graph 10, DWEs answers are represented together with the amount of days
suggested by NRWSS. In fact, according to government calculations, the current process last on
average 252 days, while the proposed procedure will last 42 days. The main difference between
the two procedures is the absence of Ward level approval: policy suggests to eliminate this step
because it requires time; indeed, Ward Development Committee is supposed to meet every three
months. On the procedure suggested by the policy, the first step is called “development of draft
of constitution by founder members”. This implies that, in the proposal of 42 days, the
introductory meetings between the district and the village authority/community are not included.
Summing this additional time (which can be estimated in two weeks) to government's proposal,
the resulting days are not distant from DWEs answers.
Graph 10: Average time for COWSO establishment and registration in each district.
60 57
90
60
90 90
48
0
20
40
60
80
100
Number of Days for
registering one
COWSO
Number of days from
MoW guideline
54
Box 1. The difference between average days and effective days of activity: the case of Kondoa.
Some districts provided two different data about the necessary time for COWSO establishment
and registration. The first is already presented in graph 10: it is the average time necessary to
constitute a COWSO from the first to the last step. The second information provided by districts
is the required effective days of activities. In order to understand clearly the difference between
these two information, let us consider the example of Kondoa district. The District Water
Engineer considered 33 days of effective activities in order to establish and register a COWSO:
 Introduction of COWSO to Village Council – 1 day
 Village General Meeting – 1 day
 Formation of constitution members – 1 day
 Constitution writing – 14 days
 Election of COWSO leaders – 1 day
 Training of COWSO leaders – 5 days
 Training of pump attendant – 7 days
 Contracts elaboration and signing – 2 days
 Issue the certificate of registration – 1 day
All previous days of activity sum up to 33. Yet, this cannot be considered the period in which a
COWSO is successfully established and registered. Effective days of activities do not consider
delays, problems and unforeseen events that might prolong the period. Yet, a detailed program
of the activities and the necessary days for implementing them will help in preparing budgets
and working plans. In fact, Kondoa is one of the districts that registered 100 percent of the
planned COWSO last year.
55
The following graph shows, for each district, the amount of money necessary to establish and
register one COWSO. These data were collected through a direct question to DWEs. Some of
them could not confirm an exact amount to establish one COWSO, so they provided a total
amount spent for COWSO establishment and registration in the district that was then divided by
the number of entities indicated by the engineers. Some others had a complete budget of all
necessary costs and the final total amount. As it is possible to recognize by looking at the graph,
DWEs answers are very heterogeneous.
Graph 11: Total cost, reported by DWEs, for establishing and registering one COWSO
The reported costs vary from a minimum of 600.000 TSH (Kongwa) to a maximum of 14 million
TSH (Kondoa and Mpwapwa). It is beyond the scopes of present research to investigate in
details the reasons of these discrepancies, yet it is necessary to underline that it is highly possible
that DWEs calculated these total amounts referring to different data. Yet, a brief analysis at
district level can be useful to better understand the relative magnitude of funds dedicated to
COWSOs. It is noteworthy, that in three out of seven districts, there are no dedicated budget
lines for COWSOs. DWEs referred that when they need funds they reallocate resources from the
general budget.
In the four districts that have a dedicated budget line, the funds available are not enough in three
600,000
14,005,000
2,000,000 1,715,000
5,000,000
3,000,000
14,000,000
0
5000000
10000000
15000000
KONGWA KONDOA DODOMA CHAMWINO CHEMBA BAHI MPWAPWA
Total estimated cost for establishment and registration of one COWSO
56
cases. Considering the unit cost per COWSO and the total number of registrations planned for
the year 2015, it is possible to calculate the total cost prevision. Then, the comparison of this
prevision with the funds dedicated in the budgets shows that three districts do not have enough
funds to register the planned COWSOs. Yet, it has to be underlined that this estimation can be
too severe because the districts might have considered COWSOs that are already established and
do not need the entire cost prevision. Only one district calculated the amount of budget dedicated
to COWSOs by multiplying the unit costs and the number of entities planned.
For the three districts that do not have a dedicated budget line for COWSOs it is more difficult to
do keen evaluation. Yet, after having calculated the cost prevision for each district (unitary cost
times number of COWSOs planned), it is possible to estimate the percentage of budget that they
will have to reallocate in order to establish the entities. For Kongwa, that reported a very low
unit cost, it is 4 percent of the water budget; yet, using as unit cost the regional average, this
percentage increases up to 40. In Dodoma and Chemba the funds needed are also high
percentages of the total water budgets, implying that there could be a lack of funds. It is
necessary to highlight that the government never drafted a guideline suggesting how expensive
could be to establish and register a COWSO.
2.2.3.4 Problems hindering the establishment and registration of COWSOs
The major problem highlighted by DWEs is the lack of funds for facilitating registration
activities. The districts need on average 71 days for establishing and registering one COWSO.
The whole process needs time, human and financial resources. Some districts are blaming the
central government for underprivileged allocation of budgets for COWSOs registration. One
DWE advocated that, lack of fund is the reason why the districts fail to register the COWSOs
planned yearly. Also lack of human resources is a problem for the proper implementation of the
57
strategy, as 29% of districts highlighted. In Bahi district this problem is severe. Directives from
the government insist that the water department should have 25 members, but in the district there
are only 9 officers, and 6 of them are close to the retirement.
57% of DWEs highlighted lack of awareness of villages as one of main problems. COWSOs
strategy is a new idea in rural communities and even though it was legally established in 2009,
many districts started the implementation only 2 years ago. Villagers do not understand why they
should establish COWSOs. In some cases districts go and train villagers several times but the
community does not agree with the idea. Hence, districts need extra time and funds to train and
raise awareness.
Conflicts between stakeholders are affecting 57% of the districts. Water schemes have been the
main source of revenue of village authorities for many years and, now, the introduction of new
management entities is raising a conflict of interest. Village Government can hardly accept to
change management system, mainly because they fear to lose power and control over the
revenues. In other cases, conflicts can be manifested between COWSOs and villagers: when the
entity fails to provide adequate services the villagers can influence the VG to chase out the
COWSO and to replace it with a PO. Some political leaders also reject the COWSO system only
because of different political ideologies.
58
Graph 12: In percentage, the problems reported by DWEs that hinder COWSOs establishment
and registration
Future strategies for improving COWSOs registration and performances
Since COWSOs strategy is new for many water stakeholders, 57% of districts proposed to
develop training and facilitation programs addressed to districts’ staff, as an important aspect for
future improvement of establishment and registration process. 43% of districts highlighted that,
training and frequent monitoring is a good strategy for improving COWSOs performance. Other
districts referred that government’s funds are not enough to achieve the increase of COWSOs
registrations planned. Furthermore, some districts seek assistance from international and local
organizations: for instance, TASAF – the Tanzania Social Action Fund - implements community
awareness programs in Dodoma municipal. Also MAMADO, a non-governmental organization,
supported the formation of 7 COWSOs in Bahi district last year.
100%
57%
29%
57%
0%
25%
50%
75%
100%
Lack of fund Lack of community
awareness
Inadequate human
resources
Conflicts between
stakeholders
Poblems of COWSOs registration and establishement processes
59
Graph 13: Proposed DWEs’ strategies (in percentage) to improve COWSOs registration and
performances
2.2.4 Private Sector
2.2.4.1 Involvement of the district in the selection of Private Operators
The second part of the interviews with DWEs focused on the role of private sector in rural water
management. As we have previously shown, in the Dodoma region private operators are the
second largest group (28 percent) running water schemes. Generally, they are responsible for the
operation of the scheme and for the ordinary maintenance. According to the normative
framework, privates can act as service providers, while the property of the projects should
remain to the communities through COWSOs. Actually, private operators usually conclude
agreements with village authorities, instead of COWSOs as it should be in accordance with the
law.
The research team asked to the District Water Engineers if they received some directives from
the government on how to regulate the involvement of private operators. All of them reported
that they never received any guideline or advices; the only normative source that they mentioned
is the National Water Policy of 2002, in which it is stated that the involvement of privates (for
service delivery) should be improved and facilitated (NAWAPO 2002, p. 34). As it is shown by
57%
29% 29%
57%
-20%
0%
20%
40%
60%
Training and facilitation
programs for staffs
Raising awareness of
stakeholders
Propose assistance from
Donors
Training and monitoring
COWSOs
Proposed strategies for improving COWSOs registration and
performances
60
graph 14, the majority of DWEs (57 percent) told that the district is not involved in the private
operators’ selection conducted by villages. On the contrary, three DWEs (43 percent) reported
that they are involved. After a deep discussion about the ways in which the districts intervene in
the first steps of the selection process, it came out that all districts (also the ones that reported not
being involved) play a supervising role. The final decision about the candidate as private
manager is left to the communities; yet, districts give advice and control the procedure. In
Mpwapwa, district officers reported that they provide clarification about the private operators’
functions. For example, they suggest that contract people shall run the system with appropriate
technical skills.
Graph 14: Percentages of districts involved in the selection of POs.
Finally, the DWE of Bahi reported that they would like to increase their involvement also at
early stages of the selection in order to avoid the risk of corruption between privates and village
authorities.
43%
57%
Districts are involved in PO selection
Yes
No
4effdefa-1f24-417b-b1d8-b1e7986ab574-160812013320 (1)

Mais conteúdo relacionado

Semelhante a 4effdefa-1f24-417b-b1d8-b1e7986ab574-160812013320 (1)

Hakan Tropp (SIWI) - 6th WGI Meeting (2-3 November 2015, Paris)
Hakan Tropp (SIWI) - 6th WGI Meeting (2-3 November 2015, Paris)Hakan Tropp (SIWI) - 6th WGI Meeting (2-3 November 2015, Paris)
Hakan Tropp (SIWI) - 6th WGI Meeting (2-3 November 2015, Paris)OECD Governance
 
marginalised communities water sanitation equity report
marginalised communities water sanitation equity reportmarginalised communities water sanitation equity report
marginalised communities water sanitation equity reportMeab Mdimi
 
Governments: Faraj El-Awar,UN Habitat, WCCE, 16th January UN Water Zaragoza C...
Governments: Faraj El-Awar,UN Habitat, WCCE, 16th January UN Water Zaragoza C...Governments: Faraj El-Awar,UN Habitat, WCCE, 16th January UN Water Zaragoza C...
Governments: Faraj El-Awar,UN Habitat, WCCE, 16th January UN Water Zaragoza C...water-decade
 
Emerging experiences with sanitation financing models & approaches, in lao pdr
Emerging experiences with sanitation financing models & approaches, in lao pdrEmerging experiences with sanitation financing models & approaches, in lao pdr
Emerging experiences with sanitation financing models & approaches, in lao pdrDeclan O'Leary
 
10 page Summary of TrackFin's results in Morocco
10 page Summary of TrackFin's results in Morocco10 page Summary of TrackFin's results in Morocco
10 page Summary of TrackFin's results in MoroccoTrackFin
 
Public private partnership_(sanitation)[1]
Public private partnership_(sanitation)[1]Public private partnership_(sanitation)[1]
Public private partnership_(sanitation)[1]Shraddha Kulkarni
 
Update: Water Governance in Asia, OECD/ADB, 2020, OECD
Update: Water Governance in Asia, OECD/ADB, 2020, OECDUpdate: Water Governance in Asia, OECD/ADB, 2020, OECD
Update: Water Governance in Asia, OECD/ADB, 2020, OECDOECDregions
 
The Water Dialogue II Report
The Water Dialogue II ReportThe Water Dialogue II Report
The Water Dialogue II ReportWaterCap
 
10 page Summary of TrackFin's results in Brazil
10 page Summary of TrackFin's results in Brazil10 page Summary of TrackFin's results in Brazil
10 page Summary of TrackFin's results in BrazilTrackFin
 
IRSP Annual Review 2013
IRSP Annual Review 2013IRSP Annual Review 2013
IRSP Annual Review 2013IRSP Pakistan
 
IRSP Annual Review 2013
IRSP Annual Review 2013IRSP Annual Review 2013
IRSP Annual Review 2013Shazia Sardar
 
JAR review presentation
JAR review presentationJAR review presentation
JAR review presentationict4devwg
 
Session Harmonization 2c - Jane Nimpamya part 2
Session Harmonization 2c - Jane Nimpamya part 2Session Harmonization 2c - Jane Nimpamya part 2
Session Harmonization 2c - Jane Nimpamya part 2IRC
 
Key Messages and Outcomes from the Good Governance discussions at the 6th Wor...
Key Messages and Outcomes from the Good Governance discussions at the 6th Wor...Key Messages and Outcomes from the Good Governance discussions at the 6th Wor...
Key Messages and Outcomes from the Good Governance discussions at the 6th Wor...OECD Governance
 
20161216 angolan national plan for rural water & sanitation (nrwssp) af...
20161216 angolan national plan for rural water & sanitation (nrwssp)   af...20161216 angolan national plan for rural water & sanitation (nrwssp)   af...
20161216 angolan national plan for rural water & sanitation (nrwssp) af...Development Workshop Angola
 

Semelhante a 4effdefa-1f24-417b-b1d8-b1e7986ab574-160812013320 (1) (20)

Hakan Tropp (SIWI) - 6th WGI Meeting (2-3 November 2015, Paris)
Hakan Tropp (SIWI) - 6th WGI Meeting (2-3 November 2015, Paris)Hakan Tropp (SIWI) - 6th WGI Meeting (2-3 November 2015, Paris)
Hakan Tropp (SIWI) - 6th WGI Meeting (2-3 November 2015, Paris)
 
marginalised communities water sanitation equity report
marginalised communities water sanitation equity reportmarginalised communities water sanitation equity report
marginalised communities water sanitation equity report
 
Water aid in mali plan 2010 2015
Water aid in mali plan 2010 2015Water aid in mali plan 2010 2015
Water aid in mali plan 2010 2015
 
Governments: Faraj El-Awar,UN Habitat, WCCE, 16th January UN Water Zaragoza C...
Governments: Faraj El-Awar,UN Habitat, WCCE, 16th January UN Water Zaragoza C...Governments: Faraj El-Awar,UN Habitat, WCCE, 16th January UN Water Zaragoza C...
Governments: Faraj El-Awar,UN Habitat, WCCE, 16th January UN Water Zaragoza C...
 
Emerging experiences with sanitation financing models & approaches, in lao pdr
Emerging experiences with sanitation financing models & approaches, in lao pdrEmerging experiences with sanitation financing models & approaches, in lao pdr
Emerging experiences with sanitation financing models & approaches, in lao pdr
 
M.Sc Summary
M.Sc SummaryM.Sc Summary
M.Sc Summary
 
10 page Summary of TrackFin's results in Morocco
10 page Summary of TrackFin's results in Morocco10 page Summary of TrackFin's results in Morocco
10 page Summary of TrackFin's results in Morocco
 
Public private partnership_(sanitation)[1]
Public private partnership_(sanitation)[1]Public private partnership_(sanitation)[1]
Public private partnership_(sanitation)[1]
 
Community-Based Water Projects Sustainability: Lessons and Challenges-A Case ...
Community-Based Water Projects Sustainability: Lessons and Challenges-A Case ...Community-Based Water Projects Sustainability: Lessons and Challenges-A Case ...
Community-Based Water Projects Sustainability: Lessons and Challenges-A Case ...
 
Update: Water Governance in Asia, OECD/ADB, 2020, OECD
Update: Water Governance in Asia, OECD/ADB, 2020, OECDUpdate: Water Governance in Asia, OECD/ADB, 2020, OECD
Update: Water Governance in Asia, OECD/ADB, 2020, OECD
 
The Water Dialogue II Report
The Water Dialogue II ReportThe Water Dialogue II Report
The Water Dialogue II Report
 
10 page Summary of TrackFin's results in Brazil
10 page Summary of TrackFin's results in Brazil10 page Summary of TrackFin's results in Brazil
10 page Summary of TrackFin's results in Brazil
 
IRSP Annual Review 2013
IRSP Annual Review 2013IRSP Annual Review 2013
IRSP Annual Review 2013
 
IRSP Annual Review 2013
IRSP Annual Review 2013IRSP Annual Review 2013
IRSP Annual Review 2013
 
JAR review presentation
JAR review presentationJAR review presentation
JAR review presentation
 
Session Harmonization 2c - Jane Nimpamya part 2
Session Harmonization 2c - Jane Nimpamya part 2Session Harmonization 2c - Jane Nimpamya part 2
Session Harmonization 2c - Jane Nimpamya part 2
 
MSc thesis
MSc thesisMSc thesis
MSc thesis
 
MSc thesis
MSc thesisMSc thesis
MSc thesis
 
Key Messages and Outcomes from the Good Governance discussions at the 6th Wor...
Key Messages and Outcomes from the Good Governance discussions at the 6th Wor...Key Messages and Outcomes from the Good Governance discussions at the 6th Wor...
Key Messages and Outcomes from the Good Governance discussions at the 6th Wor...
 
20161216 angolan national plan for rural water & sanitation (nrwssp) af...
20161216 angolan national plan for rural water & sanitation (nrwssp)   af...20161216 angolan national plan for rural water & sanitation (nrwssp)   af...
20161216 angolan national plan for rural water & sanitation (nrwssp) af...
 

Mais de Ephraim Mwendamseke

A Dissertation Submitted in Partial Fulfillment of the Requirements For the M...
A Dissertation Submitted in Partial Fulfillment of the Requirements For the M...A Dissertation Submitted in Partial Fulfillment of the Requirements For the M...
A Dissertation Submitted in Partial Fulfillment of the Requirements For the M...Ephraim Mwendamseke
 
COMMUNITY-OWNED_WATER_SUPPLY_ORGANIZATIO (1)
COMMUNITY-OWNED_WATER_SUPPLY_ORGANIZATIO (1)COMMUNITY-OWNED_WATER_SUPPLY_ORGANIZATIO (1)
COMMUNITY-OWNED_WATER_SUPPLY_ORGANIZATIO (1)Ephraim Mwendamseke
 
Community owned water supply organisations (COWSOs) Strategy of Rural Water...
Community   owned water supply organisations (COWSOs) Strategy of Rural Water...Community   owned water supply organisations (COWSOs) Strategy of Rural Water...
Community owned water supply organisations (COWSOs) Strategy of Rural Water...Ephraim Mwendamseke
 
CONTRIBUTION OF PUBLIC PRIVATE PARTNERSHIP
CONTRIBUTION OF PUBLIC PRIVATE PARTNERSHIPCONTRIBUTION OF PUBLIC PRIVATE PARTNERSHIP
CONTRIBUTION OF PUBLIC PRIVATE PARTNERSHIPEphraim Mwendamseke
 

Mais de Ephraim Mwendamseke (6)

Recommendation letter
Recommendation letterRecommendation letter
Recommendation letter
 
A Dissertation Submitted in Partial Fulfillment of the Requirements For the M...
A Dissertation Submitted in Partial Fulfillment of the Requirements For the M...A Dissertation Submitted in Partial Fulfillment of the Requirements For the M...
A Dissertation Submitted in Partial Fulfillment of the Requirements For the M...
 
COMMUNITY-OWNED_WATER_SUPPLY_ORGANIZATIO (1)
COMMUNITY-OWNED_WATER_SUPPLY_ORGANIZATIO (1)COMMUNITY-OWNED_WATER_SUPPLY_ORGANIZATIO (1)
COMMUNITY-OWNED_WATER_SUPPLY_ORGANIZATIO (1)
 
Community owned water supply organisations (COWSOs) Strategy of Rural Water...
Community   owned water supply organisations (COWSOs) Strategy of Rural Water...Community   owned water supply organisations (COWSOs) Strategy of Rural Water...
Community owned water supply organisations (COWSOs) Strategy of Rural Water...
 
Community owned water supply organisations (COWSOs) Strategy of Rural Water...
Community   owned water supply organisations (COWSOs) Strategy of Rural Water...Community   owned water supply organisations (COWSOs) Strategy of Rural Water...
Community owned water supply organisations (COWSOs) Strategy of Rural Water...
 
CONTRIBUTION OF PUBLIC PRIVATE PARTNERSHIP
CONTRIBUTION OF PUBLIC PRIVATE PARTNERSHIPCONTRIBUTION OF PUBLIC PRIVATE PARTNERSHIP
CONTRIBUTION OF PUBLIC PRIVATE PARTNERSHIP
 

4effdefa-1f24-417b-b1d8-b1e7986ab574-160812013320 (1)

  • 1. RURAL WATER SUPPLY MANAGEMENT: An empirical study on COWSO strategy implementation, Private sector participation and monitoring systems in Dodoma Region – Tanzania. The research presented at the Second International Conference on “ Advancement of geography for the people, natural resources and development” DODOMA, TANZANIA Luca traini and Japhet Chamgeni: Lay Volunteers International Association. Alberto Fierro and Elina Nelaj: University of Turin. Ephraim Mwendamseke: University of Dodoma (UDOM). November 2015 Lay Volunteers International Association L.V.I.A. Office – Cuneo (ITALY) TANZANIA Office – P.O. BOX 160, Kongwa Tel/fax: +255 (0)26 2323131 E-mail: lvia.tanzania@gmail.com University of Turin Via Verdi, 8 - 10124 Turin (ITALY) Tel: +39 011 6706111 P.I. 02099550010 C.F. 80088230018
  • 2. 1 ABSTRACT Background In 2015, World Health Organization and UNICEF reported that water coverage in Tanzania is still low: about 46 percent in rural areas and 56 percent at national level, with a small level of improvement compared to the total coverage of 54 percent stated in 1990 (JMP 2015, p. 75). In order to face the current state, the Government of Tanzania structured a sector program in three main pillars: i) implementations of new water projects or rehabilitations of old ones, ii) improving water projects management and iii) conducting adequate monitoring. Aim of the research The present research contributes to the efforts of improving water supply access and water management system in rural areas of Tanzania. It is developed as a pilot in the Dodoma Region and can be extended in other regions as well as country-wide. The report develops an analysis of the Tanzanian legislative and policy framework on rural water supply. Then, starting from the recognition of the two main Government's policy principles (community participation and private sector involvement), the research investigates the development of the COWSOs (Community Owned Water Supply Organizations) system and assesses the private sector participation in the management of rural water projects. The second part of the research focuses on the improvement of water schemes monitoring systems, analyzing monitoring resources, plans, results, methods and tools of the seven districts of the Dodoma Region. Furthermore it designs, develops and tests a low-cost, efficient and easy tool to monitor the performances of water schemes management.
  • 3. 2 Methodology In order to investigate COWSO strategy implementation, private sector participation and monitoring system the research team developed a quantitative-qualitative integrated approach. In the first part, a semi-structured questionnaire was submitted to the District Water Engineers of the seven Districts of the Dodoma Region. The questionnaire was constituted by 48 questions: 36 closed-ended questions and 12 open-ended questions, in order to integrate DWEs’ suggestions and opinions. In the second part, the team visited 25 water schemes of the 7 Dodoma’s Districts (three for each district, with the exception of Kongwa and Chamwino, where the team visited 5 water schemes each). The team research submitted to a responsible person of each scheme a questionnaire consisting of 13 closed-ended questions with the necessary elements (number of DPs, of spare parts, savings, etc) to calculate the three indicators of the monitoring tool: i) functionality, ii) stability, iii) communication/satisfaction. The research designed and tested a monitoring tool that is able to measure the performance of water service management in a scale from 0 to 10. The “Indicator of Performance” is composed by three sub-indicators with the same scale from 0 to 10: 1) “Functionality”, 2) “Stability” and 3) “Satisfaction/Communication”. Each scale is divided in 5 groups as follow: “very bad” (from 0 to 2), “bad” (from 2 to 4), “normal” (from 4 to 6), good (from 6 to 8) and “very good” (from 8 to 10). Results In rural area of Dodoma Region, water management systems are distributed as follow: Village Water Committees 56 percent, Private Operators 28 percent and COWSOs 15 percent. The research shows that the COWSOs establishment and registration process lack of dedicated financial resources, clear guidelines and adequate directives from the Central Government to the
  • 4. 3 Local Government Authorities. Only 25 percent of all COWSO planned in 2014 were officially registered. Districts that have a dedicated budget line for COWSO establishment and registration, and proper activity plans showed better results in terms of COWSO registered than other districts. Concerning, the role of privates, despite the fact that 57 percent of DWEs suggested that POs are more efficient than other management entities, the institutional environment it is not fully supportive to the involvement of the private sector. Moreover, contracts between Private Operators and Village Governments/COWSOs are not drafted using a standard and complete format. Monitoring of water scheme in the Dodoma Region is not adequate: districts provide assistance to water schemes almost only in case of emergencies, denying in this way the prevention role of monitoring. Furthermore, DWEs do not receive periodical reports from the management entities. The monitoring activity highlights that the sustainability of the schemes is at serious risk: 80 percent of management was classified by the “Indicator of Stability” as “bad or “very bad”. Then, the final “Indicator of Performance” shows better general results: 48 percent of managements are classified as “normal”, 12 percent as “bad” or “very bad”, 36 percent “good” and 4 percent as “very good”. In Dodoma Region both COWSO and PO perform as well in terms of Stability and Functionality but COWSO allows better “Saving”. WVC system rates are lower in all aspects of the performance. Conclusions and Recommendations In order to improve the water management system, the principle of community participation should go together with a continuous and stronger support of LGAs. COWSOs and the private sector (Private Operators) can coexist in a management formula that holds together the
  • 5. 4 independence and the community participation, guaranteed by COWSOs, as well as the efficiency in daily management of Private Operators. Central and local government should increase funds for monitoring and COWSO establishment and registration process. Monitoring program must be planned in advance, both in short and long term perspective. Districts should increase/plan community incentives to produce detailed monthly reports (e.g. communities that regularly submit monthly report and show good performances can apply for special water loan or other facilities). Concerning contracts between Private Operators and Village Governments/COWSOs a standard format to be provided by Central Government could highlight some key elements: expected average revenues, costs of water projects and the profit margin for the PO. Finally, it is essential to keep on working on low-cost monitoring tools - like the one designed in the present research - and effective programs (with high benefit-cost ratio), and to concentrate resources and efforts on feasible and crucial targets.
  • 6. 5 INDEX 1.1 Improving rural water supply in Tanzania: background information................................... 14 1.2 The legislative and policy framework .................................................................................. 16 1.3 Aim of the research: why water schemes management in rural water projects is a key element for sustainability .................................................................................................... 21 1.4 Research methodology and study area ................................................................................. 23 1.4.1 Seven districts of the Dodoma region........................................................................... 25 1.4.2 Twenty-five water schemes in seven districts of Dodoma region................................ 27 2. Water schemes management: COWSO system and private sector participation.......................29 2.1 Framework: laws and policy ................................................................................................ 29 2.1.1 COWSO........................................................................................................................ 29 2.1.2 Private sector ................................................................................................................ 31 2.2 Data analysis of the districts................................................................................................. 33 2.2.1 Types of management................................................................................................... 33 2.2.1.1 Types of COWSO.................................................................................................. 36 2.2.2 Resources for COWSO................................................................................................. 39 2.2.2.1 Funds...................................................................................................................... 39 2.2.2.2 Documents & guidelines........................................................................................ 41 2.2.2.3 The role of CWSTs and other district officers....................................................... 42 2.2.3 COWSO’s processes..................................................................................................... 45 2.2.3.1 COWSO formation and registration achievements................................................ 45 2.2.3.2 Steps of establishment and registration.................................................................. 48 2.2.3.3 Average time and funds needed............................................................................. 52
  • 7. 6 2.2.3.4 Problems hindering the establishment and registration of COWSOs.................... 56 2.2.4 Private Sector................................................................................................................ 59 2.2.4.1 Involvement of the district in the selection of Private Operators .......................... 59 2.2.4.2 Contracts ................................................................................................................ 61 2.2.4.3 Suggestions of DWE on the signed contracts........................................................ 61 2.2.4.4 Comparative assessment of Private Operator’s performances............................... 64 2.2.4.5 Possible future impact of private sector................................................................. 66 2.3 Main problems and areas of interventions............................................................................ 68 3. Monitoring and supervision of water schemes: Data analysis and a proposal ..........................71 3.1 Introduction .......................................................................................................................... 71 3.1.1 Background................................................................................................................... 71 3.1.2 Framework: laws and policy ........................................................................................ 71 3.1.3 The concept of monitoring and Tanzania’s strategy .................................................... 73 3.2 Data presentation and analysis ............................................................................................. 74 3.2.1 Status of monitoring and supervision of water schemes at regional level.................... 74 3.2.2Types of monitoring and supervision............................................................................ 75 3.2.3 LGAs support to water schemes................................................................................... 76 3.2.4 Report and information sharing between community and the LGAs........................... 77 3.2.5 Indicators and strategies for good management of water schemes. ............................. 78 3.2.6 Challenges of schemes’ monitoring and supervision ................................................... 83 3.3 A monitoring proposal.......................................................................................................... 84 3.3.1 Three indicators: functionality, stability and satisfaction/communication................... 84 3.3.2 The sample: 25 water schemes in the Dodoma region ................................................. 90
  • 8. 7 3.3.3 The results .................................................................................................................... 94 3.4 Main problems and areas of intervention ........................................................................... 110 4. Conclusion ...............................................................................................................................115 Bibliography ................................................................................................................................120
  • 9. 8 LIST OF GRAPHS Graph 1: Total number of water schemes in each district of the Dodoma region ........................ 33 Graph 2: Types of management (in percentage) in the Dodoma region....................................... 34 Graph 3: Percentage of each management entity in the seven districts of the Dodoma region.... 35 Graph 4: Percentage of Water Departments’ budget (2015) for COWSOs establishment and registration. ................................................................................................................ 39 Graph 5: Percentages of availability of some relevant documents at DWEs’ offices.. ................ 41 Graph 6: Facilitating activities implemented by district (in percentage) in COWSOs establishment process................................................................................................. 44 Graph 7: Percentage of registered and unregistered COWSOs in the Dodoma Region............... 46 Graph 8: Percentage of planned and registered COWSOs ........................................................... 47 Graph 9: The ten steps of the establishment procedure and the percentages, for each step, of districts that implement them..................................................................................... 50 Graph 10: Average time for COWSO establishment and registration in each district. ................ 53 Graph 11: Total cost, reported by DWEs, for establishing and registering one COWSO............ 55 Graph 12: In percentage, the problems reported by DWEs that hinder COWSOs establishment and registration........................................................................................................... 58 Graph 13: Proposed DWEs’ strategies (in percentage) to improve COWSOs registration and performances.............................................................................................................. 59 Graph 14: Percentages of districts involved in the selection of POs. ........................................... 60 Graph 15: Responsible figures for contract drafting, modification and approval ........................ 61 Graph 16: Opinion of DWEs on PO’s performances compared to other management systems. . 64 Graph 17: Advantages and disadvantages of POs according to DWEs........................................ 66
  • 10. 9 Graph 18: Profitable areas in rural water supply sector according to DWEs. .............................. 67 Graph 19: Illustrates the percentage of availability of monitoring plan and monitoring budget at regional level.............................................................................................................. 75 Graph 20: Illustrates the percentages of supports provided by the LGAs to water scheme. ........ 77 Graph 21: Indicators of a good management suggested by more than one DWE. ...................... 79 Graph 22: strategies of the districts to improve the performance................................................. 82 Graph 23: Classification of water schemes according to the number of people served ............... 92 Graph 24: Classification of water schemes according to the price per water bucket. .................. 93 Graph 25: Bar chart of the villages according to performance indicator...................................... 96 Graph 26: Average performances in the seven districts. .............................................................. 98 Graph 27: Bar chart of all the indicators classified in the five groups. ...................................... 103 Graph 28: Bar chart of the schemes classified according to the type of management and average scores........................................................................................................................................... 106
  • 11. 10 LIST OF TABLES Table 1: Results of the indicators for the complete sample.......................................................... 94 Table 2: Descriptive statistics of the performance indicator ........................................................ 95 Table 3: Classification of performance indicator in five groups .................................................. 96 Table 4: Averages scores for each district. All indicators. ........................................................... 97 Table 5: Descriptive statistics of the functionality indicator ........................................................ 99 Table 6: Classification of functionality indicator in five groups .................................................. 99 Table 7: Descriptive statistics of the functionality indicator ...................................................... 100 Table 8: Classification of stability indicator in five groups........................................................ 101 Table 9: Descriptive statistics of the communication/satisfaction indicator .............................. 102 Table 10: Classification of communication/satisfaction indicator in five groups ...................... 102 Table 11: Classification of schemes according to the type of management and average scores 105 Table 12: Classification of schemes according to the number of DPs and average scores ........ 107 Table 13: The results for each indicator in the Nghong'ohna village ......................................... 109 Table 14: The results for each indicator in Kimagai village....................................................... 110
  • 12. 11 LIST OF ACRONYMS AMCOW African Minister's Council on Water COWSO Community Owned Water Supply Organisation CWST Council/Community Water and Sanitation Team DCDO District Community development Office DED District Executive Director DEO District Education Office DHO District Health Office DLO District Legal Officer DP Distribution Point DPLO District Planning Office DT District Treasurer DUWASA Dodoma Water Supply & Sewerage Authority. DWE District Water Engineer DWST District Water and Sanitation Team JMP Joint Monitoring Programme KKK Kusoma, Kuandika and Kuhesabu L.V.I.A. Lay volunteers International Association LGAs Local Government Authorities MAMADO Maji na Maendeleo Dodoma MDG Millennium Development Goal MoW Memorandum of understanding MOW Ministry of Water
  • 13. 12 NAWAPO National Water Policy 2002 NGO Non-Governmental Organization NRWSS National Rural Water Sustainability Strategy O&M Operation and Maintenance PIM Program Implementation Manual PMO-RALG Prime Minister’s Office for Regional Administration and Local Government PO Private Operator TASAF Tanzania Social Action Fund TAWASENET Tanzania Water and Sanitation Network TSH Tanzanian Shillings UDOM The University of Dodoma VEO Village Executive Officer VG Village Government VWC Village Water Committees WA Water Authorities WCA Water Consumer Associations WP Water Point WPM Water Point Mapping WSDP Water Sector Development Program WSSA Water Supply and Sanitation Act WSSR Water and Sanitation Sector Review WUA Water User Associations
  • 15. 14 1 Introduction 1.1 Improving rural water supply in Tanzania: background information The aim of this research is to contribute to the general objective of improving access to sustainable water service in the rural areas of the country. The priority of this goal is strongly recognized both by the Government and by international organizations: availability of clean and safe water is a human right and also a key element of United Nations Millennium Development Goals. In this regard, Target 7.C states that: the objective is to “halve, by 2015, the proportion of the population without sustainable access to safe drinking water and basic sanitation” (MDG 2015). Despite general acknowledgement of this priority, the actual situation in Tanzania presents many challenges: for instance, the percentage of people with sustainable access to improved water supply has not increased considerably in the past twenty years. Therefore, a joint effort of all the relevant stakeholders is required. The Government developed since almost ten years a comprehensive sector wide plan, the Water Sector Development Program (WSDP), which entered this year in its second phase. In this new stage, the Government divided the water sector in five areas of intervention (Water resource management, Rural water supply and sanitation, Urban water supply and sanitation, Sanitation and hygiene, Programme delivery support), in order to increase the effectiveness of planned actions and to promote a more efficient approach in the sector. Together with the WSDP, a substantial increase of financial resources has been registered (thanks to international institutions, Tanzanian and foreign governments/agencies), giving reason to hope for future improvements. At the basis of government’s policy for improving access to sustainable water service there are three strategic actions:
  • 16. 15 - Increasing water supply coverage through new projects and rehabilitations of old ones; - Improving water management systems; - Strengthening supervision and monitoring of the sector. Available data about actual water coverage in urban and rural areas are not coherent among different sources. In the AMCOW's (African Minister's Council on Water) country status review of 2011, water coverage estimations are presented for the year 2009: 58.7 percent for rural areas, 53 percent in small towns, 84 percent in urban areas and 68 percent in Dar es Salaam. This report demonstrates that the estimates were calculated by the Minister using routine monitoring data (i.e. number of facilities built, multiplied by a fixed estimated population served per facility). Then, based on population estimation for each area, the overall water supply coverage of 64 percent was derived. (AMCOW 2011, p.8) In the National Rural Water Sustainability Strategy (July 2015 - June 2020) – the last document produced by Ministry of Water about rural water supply policy, there is a table describing water coverage in rural areas of the country between 2005 and 2012. The percentage of coverage for 2009 (58.7 percent) is the same as in the AMCOW country status review, suggesting that these data are estimated similarly using routine monitoring data and population estimations. The data show that the coverage trend is slightly decreasing in the recent years: first it is presented an increase of almost 5 percentage points between 2005 and 2009 (from 54 percent to 59 percent), and then a decrease of almost two points, reaching 57 percent in 2012 (NRWSS 2015, p. 85).1 1 WSDP phase II report provides a description of government's definition of water coverage (although it is specified that it applies to regional centres, district headquarters and small towns, therefore excluding villages and rural areas). The criteria to be fulfilled is 2 households (10 people) in average benefit through one connection and 250 people through a water point or a kiosk (WSDP II 2014, p. xiv-xv).Then, water coverage estimated by the government
  • 17. 16 The data published in 2015 by the World Health Organization and UNICEF in their Joint Monitoring Programme – Progress on sanitation and drinking water, are considerably different. The report, based on three different data sources (household surveys, censuses and administrative reports), estimates the water supply coverage (in percentage) for more than 150 countries all over the world. Tanzania has a total coverage of 56 percent: in rural areas it is 46 percent, while in urban areas it is 77 percent. Furthermore, the report shows that the situation in the country has hardly improved from 1990 levels (total coverage increased of two percentage points, from 54 percent to 56 percent) (JMP 2015, p. 75).2 JMP data suggest that it is difficult to find reliable and unequivocal data about the number of Tanzanian citizens who have access to safe water services, and that still – to guarantee the right to water - high efforts are required. 1.2 The legislative and policy framework National Water Policy (NAWAPO), published in 2002, establishes the most relevant principles for water sector. In order to increase the effectiveness of policy actions, this document divides the sector into three different areas. The first area is called Water Resources Management, and it deals with water considered as a natural resource; therefore, NAWAPO describes Tanzanian would be the result of multiplying the number of water supply systems and the estimated amount of citizen using those systems. This definition has been confirmed by an officer of the Minister of Water. The government does not publish data about real (and not estimated) access to water supply system. Yet, in the WSDP II report, there are some data labelled “water access” rather than “water coverage”. They are lower than the usual coverage percentages presented by the government. These data are: 51 percent of water access in rural areas (June 2014), 68 percent in Dar es Salaam (December 2013), 80 percent in urban regional centres (December 2013) and 53 percent in District headquarters, small towns and areas covered by national projects (December 2013) (WSDP II 2014, p. xiv-xv). Despite the difference in the data between the NRWSS and WSDP II report, a government's officer explained that “water access” and “water coverage” cannot be considered differently. 2 JMP data, depicting a more pessimistic picture of the water supply sector in the country, seem consistent with a paragraph of the WSDP phase II report. Namely, the latter states that: “although the water supply water coverage that were being reported before the Big Results Now initiative indicated coverage about 57% of people in rural areas; the detailed lab data analysis of water point data, found that due to degrade infrastructure, the actual baseline coverage was about 40% with 5.3 million rural residents having lost supply of water because of inadequate maintenance or infrastructure” (WSDP II 2014, p. 22).
  • 18. 17 water resource potential and it states the basic management principles of natural water sources. The country is divided into nine hydrological zones or river basins, and the objectives and the criteria for water protection, quality management and pollution control are identified. The other two areas deal with water supply: the first with rural areas and the second with urban ones. For the purposes of present research, it is useful to present briefly the principles and the objectives contained in NAWAPO about rural water supply. They are: 1. Community participation. In order to achieve sustainability of water projects in rural areas, communities have to be involved in different ways. First, they should legally own the facilities and participate in planning and management. Second, communities should be able to choose the appropriate technology for water supply projects and they should also be involved in designing and constructing the projects. Third, communities should become fully responsible for operation & maintenance of the schemes (NAWAPO 2002, p. 32-33). 2. Private sector participation. The water sector has been dominated by the public sector. The contribution of the private sector in service delivery of water supply services will enhance effectiveness and enhance development. Therefore, an enabling environment for private sector participation should be fostered, the government should assist local authorities on this issue and communities should be educated about the importance of private sector in rural water supply (NAWAPO 2002, p. 34). In 2009, the Government approved two Acts that constitute the basis of the legislative framework for the water sector. The Water Resource Management Act, that deals with water as a natural
  • 19. 18 resource and The Water Supply and Sanitation Act (WSSA), which is concerned with water supply and sanitation in urban and rural areas of the country. This law coherently adopts NAWAPO's division of the country in urban and rural areas: Water Authorities become the entities responsible for water supply in cities and towns (regulated under part IV of the act), while in rural areas Community Owned Water Supply Organisations (COWSO) should be established (part VII of the Act), becoming the organisations legally responsible for water provision. WSSA is the normative source for understanding the framework of responsibilities and functions of the involved administrative bodies:  The Minister of Water should be responsible for providing technical and financial support for the construction of water schemes, for ensuring provision of technical assistance to Local Government Authorities and for monitoring and coordinating the strategies of water schemes management entities.  In the Prime Minister’s office, the Minister of State for Regional Administration and Local Government should be responsible for the supervision of water supply service, for creating conducive environment and enabling the participation of communities and private sector in the water sector development process.  The Regional Secretariats should be responsible for providing guidance to LGAs and for monitoring them.  The Local Government Authorities (Districts and Wards) should be responsible for coordinating and monitoring the financial management of Water Authorities and COWSOs. Furthermore, they should be responsible for facilitating COWSOs establishment and registration. When needed, they should approve by-laws in water supply sector (WSSA 2009, p. 433-434).
  • 20. 19 The Water Supply and Sanitation Act also states the principles that have to be followed in managing water supply. They are:  Decentralization. Management functions should be delegated to the lowest appropriate level.  Financial autonomy of Water Supply and Sanitation Authorities.  Transferring ownership of water schemes to communities in rural areas (through COWSO).  Costs of operation & maintenance should be met by local communities.  Promotion of Public & Private Partnerships for the provision of water and sanitation services (WSSA 2009, p. 433). The most important effort of the Government in order to implement a comprehensive plan about the water sector consists of the Water Sector Development Programme. The first document drafted is the WSDP 2005-2025 consolidated report (published in July 2006), which has a twenty-year vision on the whole sector, on the challenges and the specific objectives and indicators of Water Resource Management, Rural Water Supply and Urban Water Supply and Sewerage Management. Following the publication of this document, the Minister of Water provided stakeholders and administrative bodies with some relevant guidelines: these are the annexes to the WSDP programme, which gave directives on many specific issues (e.g. training of district officers, facilitation manuals for communities, field monitoring guides and financial management formulas). Recently, the Government published two other WSDP documents: the Water Sector Status Report – Making the end of WSDP phase I (in October 2014) and the WSDP phase II 2014-
  • 21. 20 2019 (in July 2014). The firs report is a comprehensive assessment of phase I of WSDP. It describes the performances in the three main areas (water resource management, urban and rural water supply), the financial resources originally committed and the actual disbursements, together with a critical review of challenges and future actions. The second document moves from lessons learned in WSDP’s phase I in order to improve strategic interventions, institutional setting and financial disbursement. It brings some changes to the general structure of WSDP programme. Instead of four sectors (water resource management, urban water supply and sanitation, rural water supply and sanitation and institutional strengthening/capacity building), the new phase is organised around five areas. The Government provided a new structure for the sanitation programme - which became an independent area – and constituted a new component, labelled Programme Delivery and Support, which should facilitate effective enforcement of other sections' plans. Despite some changes and improvements in the WSDP organisation, phase II seem to establish too ambitious target objectives, compared with the achievements of past twenty five years. For instance access to water in rural areas should increase from 51 percent in 2014 to 80 percent in 2019. In Dar es Saalam access should increase from 68 percent in 2013 to 95 percent in 2019 and in urban regional centres access should increase, in the same years, of 18 percentage points (from 80 percent to 98 percent) (WSDP II 2014, p. x-xvi). The most recent document drafted by the government about the water sector is the National Rural Water Sustainability Strategy (July 2015 - June 2020). This report (the latest version was published in July 2015) is concerned only with water supply in rural areas, but it is a very important tool to understand sector achievements and challenges. The strategy analyses first the main problems faced in improving water supply service, and namely:  Inadequate attention to operation and maintenance.
  • 22. 21  Low community participation in project implementation.  Limited capacity of communities to maintain operative the water schemes.  Poor supply chain for spare parts (NRWSS 2015, p. v). Then, it proposes some strategic actions to improve the situation and give effectiveness to previous plans and reforms. Major initiatives include: recruiting and training more workers for helping COWSO system, establishing centres of excellence to support operation and maintenance activities, developing community awareness campaigns as also quality data management system. Furthermore, for each specified action, the strategy specifies which are the responsible administrative bodies (NRSS 2015, p. 12-28). 1.3 Aim of the research: why water schemes management in rural water projects is a key element for sustainability The present research is focused on water schemes management. On the one hand, a deep analysis of the COWSO system will be presented. In fact, they represent the key actor chosen by the government in order to achieve the objectives set in the rural water policy. Despite the COWSO legislative framework is almost seven years old, the pace of formation and registration is still low, as WSDP II underlines, the COWSOs that are registered are only 460 over 2,727 planned (i.e. 17 percent) by Big Results Initiative until June 2014 (WSSR 2014, p. 17). Furthermore, in order to fulfil the goal of transferring the legal ownership of water projects to local communities, COWSO must be must be established and registered and must participate in “owning, planning, maintaining and operating water supply projects and sanitation facilities” (NRSS 2015, p.6). On the other hand, the research investigates the role of the private sector in rural water supply. There are many public water schemes that are currently run by private citizens (called private operators or private agents). How are these schemes performing? How can the private
  • 23. 22 management of water schemes be integrated with the law and the policy? These are the main questions the research aims to answer. Furthermore, stakeholders shall start to look at private participation in the water management not in antithesis with respect to the COWSO system. Already since NAWAPO, the government suggests to foster the involvement of privates in water service delivery, and the decision to transfer the legal property of water projects to communities should not be interpreted as an obstacle to this aim. COWSO and privates can coexist. The research wishes also to contribute to an assessment of future possible increases in private involvement in water sector. Which services can the private sector provide in an efficient and profitable manner? And which are the risks for communities in case of increasing private involvement? In general, in order to reach the principal objective of improving rural water coverage, the issue of management should not be underestimated. It is a crucial aspect in the sector. Too many water projects collapse because of poor management. Surveys found that only 54% of existing rural water points is functional, and 25% of the schemes after only two years from installation are no longer functioning (Water Aid 2009, p. i). As underlined by the government in the water policy, operation and maintenance is a key element for schemes' sustainability. The sector needs effective management models, which are able to provide services to communities, to guarantee schemes sustainability thanks to a satisfactory financial management and to report the necessary information to the local government authorities. As specified in the 2010 report “Myths of the Rural Water Supply Sector”, drafted by the Rural Water Supply Network, building new water supply systems is not more important than keeping the old one working. “Too little attention is paid to how communities are likely to deal with the real-life complexities of a water supply system” (Rural Water Supply Network 2010, p. 3). Designing realistic and effective management
  • 24. 23 models is surely a part of the solution to the problem of schemes sustainability. Another crucial aspect for the long-term stability of rural water schemes is monitoring. Often the management lacks of the necessary training or information; and if nobody is conducting a serious monitoring of schemes and management performances, the probability of a scheme to collapse increases substantially. Therefore, the research aims to investigate which are the main challenges in current monitoring at a district level, developing at the same time an easy and efficient tool to supervise water schemes performance at a village level. 1.4 Research methodology and study area The general aim of the research, the methodology and the expected outcomes have been deeply discussed with three crucial stakeholders: the National Water Network TAWASENET, the Minister of Water and the University of Dodoma. At an early stage of research planning, a meeting with TAWASENET helped in drafting a first outline of the project: the three core elements of the project (COWSO establishment and registration, the role of private sector and water schemes monitoring) had been deeply discussed and a first theoretical framework has been developed. The research team considered the rural water supply policy as a flow of information and responsibilities: starting from the normative and national framework of the Government, moving to districts – which are the administrative and political bodies that have the specific duty of implementing government's plans, and arriving at villages, where the water schemes have to be concretely realized and managed. These three levels are sequential stages of a chain, in which every step has the same importance in order to give concrete realization to the policy. The main research’s objective shifted on the investigation of this flow of information and on the institutional responsibilities on the three core topics. Yet, after having acknowledged the
  • 25. 24 considerable difficulties of such an extensive work, and thanks to the suggestions of the above- mentioned institutions, the research team developed the project's field research in the following way: first, the research focuses on the Dodoma region. This helped to reach the ambitious objectives together within the limited time available. Furthermore, the research can be considered as a pilot project, in which objectives and methodology are easily extendible to other regions or to the national level. Second, the empirical research focuses mainly at a district level. A deep analysis of both Governmental policy and villages’ implementation problems is provided, with different aims. At scheme level, the research team tried to test a monitoring tool for the water schemes, in order to contribute to the discussion on the main challenges for long-run sustainability of rural water schemes. At Governmental level, the research team proposed an analysis of the normative and policy framework, assessing which are the strong and weak points. This framework had been developed thanks to the constant contribution and suggestions of TAWASENET and the University of Dodoma (UDOM). The latter institution provided effective help to the research team by joining the project through the participation of a UDOM’s student. At the same time, following the positive dialogue with the government, the Ministry of Water officers provided the research team with a presentation letter that contributed to a smoothen the planning of the field activities in the districts. The field research at District level consisted of seven semi-structured interviews with the District Water Engineers. These officers are employed by the District and manage the Water Department. They are responsible for the water supply and the sanitation services; furthermore, they constitute the principal reference for water schemes management in the villages.
  • 26. 25 The second part of the field research was planned at village level. In each district, DWE suggested to the research team three water schemes with various management models. In Kongwa and Chamwino districts, thanks to previous L.V.I.A. knowledge of the areas, the research team was able to visit five water schemes in each district. This helped to make a preliminary testing of the monitoring tool (e.g. the time needed for each water scheme). 1.4.1 Seven districts of the Dodoma region The selected area of investigation includes all seven Districts of the Dodoma region. These are: Bahi, Chamwino, Chemba, Dodoma, Kondoa, Kongwa and Mpwapwa. The Dodoma region was selected as consequence of the fact that L.V.I.A. works in Kongwa and Chamwino districts since more than twenty five years, enabling the research team to have enough background knowledge about the water supply situation in those areas. The Dodoma region located in the central plateau of Tanzania, is one of the poorest region of the Country. The climate is semi-arid, with a unique rainy season of 4-5 months. The annual rainfall is about 400 mm per year. The rainfall pattern is very variable and every seven-six years a cyclic drought event can happen. Based on the mentioned meetings and a careful review of existing laws, policy and the water sector scientific literature, the research team prepared a questionnaire for conducting the semi- structured interview with the DWEs. The questionnaire was divided into three sections:  COWSO establishment and registration. This section, made of twenty three questions, dealt both with quantitative and qualitative information on COWSO. First, the document included quantitative questions on the number of COWSOs (registered and unregistered), average time and funds needed for a registration, total amount of funds in the water department. Second, the questionnaire included questions on district's strategy to improve the registration procedure, the existence of government guidelines on COWSO, the
  • 27. 26 degree of district involvement in COWSO establishment, together with problems and suggestions for COWSO formation and registration.  Private sector involvement into water supply system. The second section, made of fourteen questions, focused on the number of private operators managing water schemes (with or without contract), the degree of district involvement in private operators selection and in contracts drafting, a comparative assessment of private operators performance in managing water schemes, problems, future strategies and suggestions for increasing the involvement of privates in water supply sector.  Monitoring & Supervision. The last section, made of eleven questions, investigated how DWEs and their teams conduct monitoring and supervision on water scheme performances. Questions about the type and frequency of monitoring were formulated, together with the kind of support provided to water schemes. This section was developed in order to enrich the research part at scheme level that primarily deals with monitoring. For this purpose, the questionnaire included a question to DWEs about which indicators they considered mostly relevant for water schemes performance. The research team succeeded in conducting all interviews to DWEs during three weeks. Only in one District (Mpwapwa) the team could not conduct the interview directly with the DWE (because of pre-scheduled duties), but the team met the person responsible for COWSO registration and another officer of the DWE’s team, who were able to provide complete answers and all requested data. The questionnaires were drafted in English, although the composition of the field research team (four people with two Kiswahili native speakers) allowed to switch from English to Kiswahili in case of misunderstandings or linguistic problems. Generally, in order to use time efficiently, a sub-team of two components conducted the semi-structured interviews
  • 28. 27 with DWEs. Moreover, because the questionnaire included both open and closed questions, generally one researcher conducted the interview while the second one was taking notes. After having concluded the field research, in some cases it was necessary to contact again the DWEs for completing the dataset. The average time needed for the semi-structured interviews was 1 hour and 30 minutes. 1.4.2 Twenty-five water schemes in seven districts of Dodoma region Based on the existing literature on the field and on the long lasting experience of L.V.I.A. employees, the research team developed a monitoring questionnaire for the water schemes management entities. It was established on the basis of two key principles: first, it should have been able to measure effectively water scheme performance; second, it should have been an easy and fast tool, requiring only a short visit to the village. The final monitoring tool is a questionnaire with thirteen questions for water schemes management entities and two questions for the users. It is constructed upon three indicators: 1. Functionality. This indicator assesses the quality of current service delivery performed by water schemes management. It is based on the percentage of functioning water distribution points and on the existence of a proper financial management. 2. Stability. First, it assesses the long-run sustainability of the water scheme by checking if the management entity has savings and of which amount per distribution point. Second, it examines the type of management entity. It attributes higher values to management entities that are more likely to be stable (e.g. registered COWSO) and that are as by the law enacted (e.g. private operators with contract, COWSO). 3. Satisfaction/communication. The last indicator assesses the degree of users’ satisfaction
  • 29. 28 about the service. Furthermore, it examines whether the management entity is providing the necessary information on scheme performance to the community, to village government and to district. The field research at a village level has been conducted together with the DWEs interviews: in three weeks the planned villages have been monitored. Often, the research team split in two in order to conduct the monitoring: two team members interviewed the management entities and two team members interviewed the water users. The interviewed users were at least five in each village, following a gender balanced selection. The average time needed to conduct the monitoring in two teams was 50 minutes. This is the complete list of the villages in which the research was conducted: Bahi district: Babayu, Mayamaya and Zanka. Chamwino district: Huzi, Mgunga, Mlebe, Mnase, Muungano. Chemba district: Magasa, Mhlongia and Waida. Dodoma municipal area: Ihumwa, Mapinduzi and Nghong'ohna. Kondoa district: Kwayondu, Madisa and Soera. Kongwa district: Laikala, Leganga, Mageseni, Majawanga/Moleti and Nolini. Mpwapwa district: Chunyu, Kimagai and Kisokwe.
  • 30. 29 2. Water schemes management: COWSO system and private sector participation 2.1 Framework: laws and policy 2.1.1 COWSO The Water Supply and Sanitation Act No. 12 of 2009 introduces Community Owner Water Supply Organizations (COWSO) as the only legal management entities entitled to implement the NAWAPO’s community participation (and ownership) principle in rural water supply system. The Act illustrates how COWSOs are formed and registered and how communities can effectively participate in owning, planning, maintaining and operating water supply projects and sanitation facilities. In accordance with the Act, COWSOs established under section 31 may take the following prescribed forms: water consumer association, water trust, cooperative society, non- governmental organization, company, any other body as may be approved by the Minister. Managing, operating and maintaining the water scheme and the provision of safe water to the consumer are the main powers and functions of COWSOs. Besides these, they should make rules for the use of public taps, install meters to measure the amount of water supplied, charge the consumers for the water supplied and consult and cooperate with the village or any other institution responsible for land (WSSA, 2009, p. 450). The proposed members of the entity should prepare a Constitution/Statute or a Memorandum of Understanding (MoU) and submit it to the local government authority for approval. Upon request of the community or of a group of people who intend to establish the association, the local government authority shall provide assistance in formulating the constitution or the MoU. After
  • 31. 30 approval of the constitution and community organization’s establishment, COWSO has to be registered and published in the official Gazette. The registration responsibility has to be shifted from the Ministry of Water to the Local level where there will be a registrar responsible on behalf of the Ministry. From the date of the registration the community organization shall be responsible for the water supply system and all the water consumers shall be required to contribute for the water provision and the sustainability of its system. (WSSA, 2009, p.451) Water Status Report – Making the end of WSDP (October 2014) affirms that COWSO registration needs to become a priority and underlines poor results achieved in the phase I of the program. The very recent National Rural Water Sustainability Strategy (NRWSS 2015) recognizes same challenges and addresses and defines key actors and their responsibilities. Moreover, in order to ensure the sustainability of water supply system, it provides strategic interventions that are divided into three implementation terms (short-term; medium-term; long - term). Shortening the process of registration and formation of COWSO is one of the short-term priorities set out in the strategy. In fact, in order to shorten the process from 251 (current average) to 42 days, the Government identifies key interventions such as: i) allocating and disbursing funds, ii) developing COWSO database, iii) enforcing capacity building programmes and iv) including clear COWSO registration guideline in the Program Implementation Manual. The NRWSS identifies the role and responsibilities of LGAs in supporting the rural water supply service, within the COWSO’s framework: • Promote establishment of COWSOs and provide technical assistance to them; • Co-ordinate COWSO budgets within Council Budgets;
  • 32. 31 • Resolve conflicts within and between communities; • Formulate by-laws on water source protection, water supply and sanitation; • Improve the enabling environment e.g. working with the local private sector to improve water facilities supply chain. Finally, NRWSS presents main gaps between policies and practice: LGAs are often unable to meet their obligation in the facilitation of COWSO. “There are not efficient mechanisms to assure transparency, integrity and accountability for income and expenditure at community level. Capacities and skills are inadequate to manage rural water supply services” (NRWSS, 2015, p. 23). The consequence of these problems can be serious: as stated by the strategy, “Often COWSO are not better than the earlier Village Water Committees as they have inherited the same challenges of their former institution set up” (Ibid.). 2.1.2 Private sector Since 2002, when the National Water Policy (NAWAPO) was launched, new collaborations and partnerships with the private sector have been constantly promoted as a new approach for the sustainable development of water supply service in rural areas. Then, in 2006, the WSDP Programme (Annex V) defined and described private agents as providers of goods and services: they can support communities in conceiving, planning, designing, constructing, maintaining and managing their water supply and sanitation facilities (WSDP Annex V, 2006, p.4). Hence, according to this definition, the following entities were (potentially) considered as part of the private sector: NGOs, consultants, drillers, contractors, suppliers of pipes/pumps/other materials, private operators, artisans etc. But, although the Government is encouraging private participation at all project cycle’s levels, there are yet no strong policies and programs to attract private sector investments.
  • 33. 32 WSDP II more generally suggested the promotion and strengthening of independent management entities, such as “Water User Groups, Water User Association and Private operator” (WSDP II, 2014, p.61). In fact, the document states that in some areas autonomous entities are found to be more sustainable, although there is a higher risk of excessive profiteering for private operators. However, this risk can be reduced or avoided by stipulating well-designed contracts with specific duties, roles, responsibilities and penalties of the parties. Act no. 12/2009 regulates private sector participation in water supply, establishing - under section 35 - that a “service provider” may be hired by COWSOs for performing its functions and exercising its powers. In order to accomplish this role, they shall sign an agreement with specific terms and conditions that shall be approved by the local government authority. Furthermore, it includes “Companies” as one of the corporate bodies prescribed in accordance with the section 31. In this way the Act seems to establish two different levels of private sector participation, even though there is no large experience of the latter and confusion regarding role and legal framework of “service providers” at local level. Should the private sector be considered only as a service provider or can it also perform other functions? As the research will show, the most common role of the private sector in the rural water supply is the private operator (PO) that is often operating water schemes, and mostly with no contract and no supervision of COWSOs. Therefore, are these POs working out of the legal framework? Which roles can the private sector play and which one will be promoted by the Government? What kind of partnership and collaboration is the Government looking for? These are the questions which remain unanswered and must be clarified. The Government should reply, providing clear policies, coordination, harmonization and practical mechanisms of support and implementation.
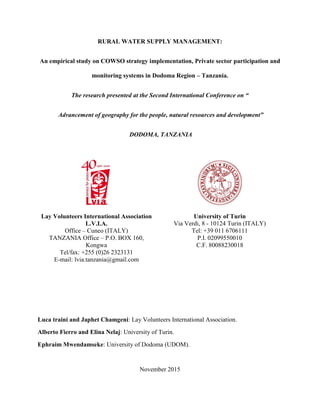
  • 34. 33 2.2 Data analysis of the districts 2.2.1 Types of management The first question to District Water Engineers assessed the total number of water schemes in each district. According to their answers, in the region of Dodoma there are 397 water schemes, divided in seven districts. The following graph shows the quantity of water schemes per district. Graph 1: Total number of water schemes in each district of the Dodoma region It is important to note that the quantity of water schemes differ from to the number of villages: in fact, some water schemes serve more than one village. The district with the highest quantity of schemes is Kondoa (77). Five districts have a number of schemes between 49 and 65, while Dodoma Municipal Area is the smallest with 36 water schemes. 52 77 36 65 62 56 49 0 10 20 30 40 50 60 70 80 90 KONGWA KONDOA DODOMA CHAMWINO CHEMBA BAHI MPWAPWA Total number of schemes
  • 35. 34 Graph 2: Types of management (in percentage) in the Dodoma region Graph 2 presents the percentage of each management entity at regional level. First, it can be noted that there are four types of managements:  Village Water Committees are the majority with 56 percent.  Private Operators are the second largest group with 28 percent.  COWSOs amount to 15 percent.  Water Authorities represent only 1 percent of the management entities. More than half of the schemes are run by “Village Water Committees”. This kind of management entity existed in Tanzania long before COWSOs and Private Operators, and that’s why VWCs run the majority of water schemes. Generally, the committee is constituted of at least 5 members selected from village council (in some villages the financial and planning committees of Village Government have the responsibility of management). Sub villages are often represented in these committees, as well. “Private Operators” are usually citizens of the village who become managers of the water scheme. They use to sign contracts with the Village Government, agreeing on financial and 1% 15% 28% 56% 0% 10% 20% 30% 40% 50% 60% Water Authorities COWSOs Private Operators VWC Type of managment entity
  • 36. 35 technical issues concerning the scheme. Generally these contracts do not last more than two years, and usually they specify the amount of money that the Operator has to pay every month to the VG. In fact, the PO meets the running and maintenance costs by its own (up to a certain amount), keeps all the revenues and pays an agreed monthly fee to the village. COWSOs are the entities entitled to legally own the water schemes. Additionally, they can manage directly the water systems or they can appoint “service providers”. The process of establishing COWSOs in the rural areas of Tanzania has still to improve and the Dodoma region can be considered an example of this challenge: only 15 percent of all management entities are COWSOs. Water Authorities shall be established in urban areas and small towns to manage water supply. In the Dodoma region that is mainly constituted by rural areas WAs are few, while another legal entity is in charge of the water supply service in the capital city: DUWASA – Dodoma Water Supply & Sewerage Authority. Graph 3: Percentage of each management entity in the seven districts of the Dodoma region 0% 10% 20% 30% 40% 50% 60% 70% 80% 90% 100% Water Authorities COWSOs Private Operators Village Water Committee
  • 37. 36 Graph 3 shows the distribution of different management models across Dodoma’s districts. Almost in all cases the most common management is the Village Water Committee: the percentage goes from 50 to more than 80 percent in five districts. Chamwino District is a peculiar exception, having the highest quantity of Private Operators (almost 90 percent of district’s schemes). Then, just three districts have a percentage of COWSO from 20 to more than 30 percent, while the other four districts have approximately from zero up to ten percent of COWSOs. 2.2.1.1 Types of COWSO Interestingly, DWEs reported that all the COWSOs in their district have the legal form of “Water Consumer Associations”. As already mentioned, the COWSOs might be of various kinds (e.g. companies, NGOs, cooperatives). Yet, in all districts the predominant models are the WCAs. Why is this occurring? One explanation could be that, since NAWAPO (when government’s policy was oriented to increase the independence of water management entities in rural areas) the involvement of communities has always been achieved through fostering the participation of water user bodies. The first National Water Sector Development Programme - published in July 2006 - calls these user bodies “Water User Groups” and “Water User Associations” (p. 4-14). The first category usually refers to a group of people having a common water distribution point. WUGs can also form groups at a larger scale, which might take the responsibility of managing the entire water scheme. These bodies are called “Water User Associations” and are constituted by village communities’ members that own and manage the water supply independently from the political power of the village government. Basically, this is the main difference between a Village Water Committee and a Water User Association: in the first one, members are selected according to the political entity of the village, while in the second one the composition follows a
  • 38. 37 “bottom-up process”, from Water User Groups to WUAs. At this point some terminological confusion arises: “Water User Associations” is a label which, since NAWAPO, has been used also in a different context. Namely, this word has been used in the Water Resource Management framework, not in Rural Water Supply. As already mentioned, water resource management is concerned with water considered as a natural resource, and its main objective is to properly manage natural water sources of the country (rivers, lakes, wetlands, springs, groundwater aquifers) to reach a sustainable socio-economic development. In this context, “Water User Associations” are the lowest appropriate management level (i.e. at villages), being responsible for “mediation of disputes among users and between groups within their areas of jurisdiction, [...] conservation and protecting water sources, and catchment areas, efficient and effective water use, […]” (NAWAPO 2002, p. 28). Furthermore they provide legitimate representatives in water resource management entities at higher levels. So, since 2002, the label “Water User Association” has been used in the water resource framework, rather than rural water supply. Therefore, the Water Supply and Sanitation Act of 2009 chooses another word in order to refer to WUAs that are managing water supply facilities. It called them “Water Consumer Associations”. Consequently, laws and policies started to use this other label in order to distinguish the two concepts. Looking at the evolution of community participation, it is now more understandable why, in the Dodoma region, all COWSOs are WCAs. The idea of establishing and registering COWSOs entered in a context in which, since some years, communities could manage water schemes through entities called Water User Associations. Therefore, for all actors involved (districts, village government and water users) it has been easier to think of COWSOs as associations of water users, rather than private companies, NGOs, cooperatives, etc. Furthermore, there is no
  • 39. 38 document that explains in details how to establish all different types of COWSOs. 2.2.1.2 Role of Private Operators As described previously, it is difficult to deduce unequivocally the role of private operators in the management of rural water projects from the normative and policy framework. Since the approval of WSSA in 2009, every scheme should be owned by a registered COWSO that, in a subsequent moment, could decide to appoint a (private) service provider to engage management functions. Government suggested in many documents to increase the participation of private operators in rural water supply; yet, the only normative framework that can include private operators seems to be the COWSO system. Concrete reality in the Dodoma region is very different from this theoretical analysis. Almost all Private Operators have written or oral agreements with the Village Governments rather than COWSOs (the only exception are three schemes of Bahi District that have COWSO and PO together). In all districts analysed, private operators are not companies, but citizens appointed by village authorities - usually through open calls - to run the water schemes. As previously mentioned, they manage water supply under all points of view. All District Water Engineers highlighted that POs are collecting water fees, paying tap attendants and are responsible of ordinary technical maintenance of the scheme (for extraordinary works it is normally the village covering costs). They usually pay a monthly fee to the VG as a kind of rent for the water scheme, which - in the large majority of the cases - remains property of the village. When describing the role of private operators, only one DWE did not mention ordinary technical maintenance of the scheme as their duties. Although POs can be considered fully responsible for the management under a practical point of view, in Chemba District the DWE had a slightly different view: “POs are within the control of
  • 40. 39 VG or water committees, so it is the VG that can be considered to manage the scheme”. This observation highlights the fact that the communities shall always be considered the “real” managers, which can freely decide to delegate their functions to other actors. 2.2.2 Resources for COWSO After having assessed some general information for each district (e.g. the number of water schemes and the management types), the interview with the DWEs focused on the issue of Community Owned Water Supply Organisations. In order to be able to establish and register them according to the normative framework, districts need basically three elements: adequate financial resources, proper information/guidelines and trained officers. Therefore, in the section of the interview about COWSOs establishment and registration, the questionnaire focused on these three elements. 2.2.2.1 Funds The following graph presents, for each district, the percentage of water department's budget (2015) dedicated to COWSO establishment and registration. Graph 4: Percentage of Water Departments’ budget (2015) for COWSOs establishment and registration. 0% 9% 0% 2% 0% 26% 3% 0% 10% 20% 30% KONGWA KONDOA DODOMA CHAMWINO CHEMBA BAHI MPWAPWA Percentage of Water Departments' budget for COWSOs establishement and registration
  • 41. 40 As it is possible to recognize by looking at the graph, the situation in the region is very heterogeneous. In two cases – Kongwa and Dodoma – DWEs explained that they do not have any specific budget line for COWSOs. When they need some funds for establishment or registration of COWSOs they reallocate resources from the general budget of the water department. This procedure requires some bureaucratic steps: the request for reallocation must be officially formulated and approved by the responsible district offices. In Chemba district, the Water Engineer said that he deleted from the 2015 budget the line of COWSOs because of substantial reduction in the available funds: “This year I have enough resources to construct only one new water project” said the engineer. In two districts – Chamwino and Mpwapwa – the funds available for COWSOs are a small percentage of the total water department's budget: respectively 2 and 3 percent. In Mpwapwa, the officers underlined that in case more resources would be needed, the department will proceed with the reallocation procedure. Kondoa District Water Engineer allocated 9 percent of the budget to COWSOs; furthermore, he highlighted that there are some resources available for the establishment and registration from the national Water Sector Development Programme and from external donors. Finally, Bahi district allocated 26 percent of the budget to COWSOs. Interestingly, two District Water Engineers affirm that, sometimes, it is possible to use a part of water scheme savings in order to facilitate the development of the existent management into a COWSO. All Districts - except one - reported that it is impossible to reallocate the resources dedicated to COWSOs once the budget is approved. It was underlined that the procedure to disburse funds for the activities has been computerized and it is consequently not possible to change the destinations. In Mpwapwa, the officers reported, on the contrary, that they can
  • 42. 41 reallocate resources dedicated to specific activities during the budget review of mid-year. Yet, the procedure is long: the department can make the proposal that has to be approved first by the District Executive Director and the by the full district council. The definitive decision is taken at regional level. 2.2.2.2 Documents & guidelines In order to determine whether the District Water Engineers have all the necessary information on the government policy about COWSOs, the research team asked if the relevant documents and laws were available. Graph 5: Percentages of availability of some relevant documents at DWEs’ offices.. The question focused on five paper documents and one website. Graph 5 shows the availability of the documents at regional level:  All seven DWEs have in their offices three documents: the National Water Policy of 2002 (NAWAPO), the Water Supply and Sanitation Act of 2009 (WSSA) and government guidelines on COWSOs establishment and registration. These guidelines 100% 100% 57% 100% 57% 29% 0% 20% 40% 60% 80% 100% 120% GUIDELINES WSSA WSDP II REPORT NAWAPO NRWSS PIM WEBSITE Availability of water sector's relevant documents at District level
  • 43. 42 were written in the years following the adoption of the national Water Sector Development Programme and were updated after the approval of WSSA in 2009.  Four out of seven DWEs (57 percent) have the last report of the WSDP (called Water Sector Development Programme – Phase II, published in July 2014) and the National Rural Water Sustainability Strategy (available in the Minister of Water website since August 2015).  Only two DWEs (28 percent) checked the new website of the Programme Implementation Manual for the WSDP II. This website is divided into the five components of the new WSDP phase. Component II – Rural Water Supply and Sanitation – contains updated information about the implementation procedures and strategies. Furthermore, it is possible to download all relevant laws and documents on rural water supply. From DWEs answers it is possible to recognize that the flow of information from government to Local Government Authorities face some challenges. Documents that are relatively old are known and available in the districts. In case of more recent policies, i.e. WSDP II and NRWSS, three engineers reported not to have them. This implies that the engineers are not properly updated about the recent national strategies and new targets in rural water sector. Another example of this “information challenge” is the fact that the majority of DWEs have not yet visited the new useful website for the implementation of WSDP II. 2.2.2.3 The role of CWSTs and other district officers The council/community water and sanitation team (CWST) is the key body in the management of all water and sanitation issues at district level. In phase I of WSDP, MOW referred to it as District Water and Sanitation Team (DWST) but in more recent documents like WSDP II and
  • 44. 43 NRWSS, the name changed to CWST. They have to be formed in each district to facilitate coordination of the different departments that have responsibilities in water and sanitation. Teams' responsibilities are to provide the day-to-day leadership, planning and coordination of water and sanitation activities at district level (PIM annex 9, 2006, p.6). In the Dodoma region all districts have CWSTs. They generally consist of 6 head of departments or their representatives and the District Executive Director (DED) as chairperson. The teams include representative from LGA Director Office (DED), District Planning Office (DPLO), District Water Engineer (DWE), District Health Office (DHO), District Community development Office (DCDO), District Education Office (DEO) and District Treasurer (DT). The total number of members of the team varies across districts; it ranges from 7 to 10. In some districts, most important departments like Community Development and Water send more representatives; thus, they have a larger team. In each district CWSTs have different responsibilities. Specifically for COWSOs strategy, CWSTs are accountable for organizing and supervising the whole process of establishment and formation. They should also monitor COWSOs performances. In one district, DWE highlighted that CWST is responsible for preparing meetings, disbursing fund and designing the plans for implementation of water projects. For COWSOs establishment and registration process, some responsibilities are performed by the whole team, while some others are implemented within the single departments with close assistance of the team whenever necessary. In the establishment process, the CWST is responsible for sensitizing and train the community on COWSOs strategy. Once the community is motivated to create the new entity, the team provides representatives to facilitate the process of selecting COWSO leaders. In some districts, the entire team participates to field activities while
  • 45. 44 in some others, because of financial problems, only few members can be involved. In order to understand deeper the role of the districts for COWSOs establishment, it is useful to look at their involvement for the facilitation of COWSO leaders' election. Graph 6 shows, at regional level, the type of activities conducted by districts (expressed in percentage of district) to facilitate the COWSO establishment. Graph 6: Facilitating activities implemented by district (in percentage) in COWSOs establishment process In four districts (57 percent), water department provides villages with the selection criteria for COWSO leaders. They include: a gender balanced selection, an appropriate level of education (at least being able to read, write and count – in Kiswahili KKK, Kusoma, Kuandika and Kuhesabu), independence from the Village Government and a feeling of responsibility toward the COWSO. The same number of districts sends officers to facilitate the election process. In three cases the district employees only check if the guidelines for leader selection are followed. In Mpwapwa the degree of involvement is higher: first, the district provides cars for promoting COWSO election; second, the officers help the village in preparing the electoral forms (generally the 57% 14% 57% 0% 10% 20% 30% 40% 50% 60% 70% Providing officers to facilitate the process Providing assistance for selection/templates Providing criteria for leaders selction Districts' facilitating activities in COWSO establishment process
  • 46. 45 community itself decides whether to elect the leaders by raising hands or through a ballot box). Again, Mpwapwa is the only district in which officers participate actively in the leader selection: one CWST member helps the village in assessing the quality of the candidates. 2.2.3 COWSO’s processes 2.2.3.1 COWSO formation and registration achievements The status of registration of COWSOs at national level is low. The water sector report for marking the end of WSDP phase-I 2014 underlined that, out of 2,728 COWSOs planned by June 2014, only 460 (17%) were established and registered. The main problem highlighted by the MOW is the lack of funds allocated by LGAs for undertaking the process. Often, even when the funds are set, they are reallocated for other purposes (WSDP II p.17). In the Dodoma region there are 72 COWSOs: 41 already registered (57%) and 31 (43%) in process. The unregistered COWSOs are composed by: i) COWSOs that are already managing the water schemes although the registration process is not completed (36% of all 72 COWSOs), ii) COWSOs that are not operative during the registration process (7% of all 72 COWSOs). In the last case, VWCs usually keep on running the water projects.
  • 47. 46 Graph 7: Percentage of registered and unregistered COWSOs in the Dodoma Region In 2014, districts have registered the 49% of the total registered COWSOs (41) existing in the whole region. Three districts did not register any COWSOs until 2014. The COWSOs planned to be registered last year in all districts were 79 while only 25% were registered. The total number of registrations planned in 2015 dropped with respect to last year by 9%. In the Dodoma region the districts have different budgets for establishment and registration of COWSOs; this affects the homogeneity of their plans. In fact, the number of COWSOs to be registered yearly depends on the available resources. Some districts planned to register many COWSOs last year but they reduced the number this year. Others increased the number this year; one district plans to register the same amount as last year. The total amount planned this year includes the COWSOs whose registration process started last year. For example in Mpwapwa district, the 10 COWSOs planned for this year include 7 that are in the registration process since last year. Only 3 new COWSOs are foreseen to be promoted and registered. 7% 36% 53% 4% 57% COWSO established but not registered and not operative COWSO established but not registered and managing the water service COWSO registered and managing the water service COWSO registered but no directly managing: supervising and subcontracting PO
  • 48. 47 Graph 8: Percentage of planned and registered COWSOs Interestingly, the two districts that did not register any COWSO in 2014 are the ones not having a specific budget line for establishment and registration (Kongwa and Chemba). The third district without separate budget is Dodoma that last year planned a very high number of registrations. It is fair to say that districts with no dedicate budget for COWSO registration face more challenges in planning the annual objectives as well as estimating the needed funds. Moreover, a detailed plan with exact expenditures could speed the implementation phase and increase the performances of the districts. Also the amount of budget dedicated to COWSOs seems to play an important role for the registration rate: the two districts that achieved to register 100 percent of last year plans (Bahi and Kondoa), are the ones which dedicated the highest percentages of water budget to COWSOs (Bahi 26 percent and Kondoa 9 percent). 0 5 10 15 20 25 30 35 40 COWSOs planned to be registered in 2014/2015 COWSOs registered in 2014/2015 COWSOs planned to be registered in 2015/2016
  • 49. 48 2.2.3.2 Steps of establishment and registration In order to guarantee a smooth establishment and registration process of COWSOs, the government prepared guidelines that describe in details all the necessary steps and the actors involved. The guidelines divided the procedure for creating a new COWSO in three distinct activities:  Establishment  Registration  Election of permanent committee The establishment phase consists of ten steps. Among others, they include the presentation of the general idea to the village assembly, the choice of which is the most suitable type of COWSO, the drafting of constitution guided by an interim committee and final approval by the district. The registration process consists of nine steps, starting from the village application (which shall include, also the draft of the constitution and the minutes of meetings), to the examination of the application by the district registrar, the payment of registration fee and the final approval with the issue of the registration certificate. According to the guidelines, the election of the permanent committee shall be done after the conclusion of the establishment procedure. The permanent committee must be formed following a gender-balanced approach and it shall have also an executive committee, according to the type of COWSO established. On the contrary, the registration process should start before the end of procedure for establishment; in fact, after completing constitution drafting, the interim committee shall prepare an application letter to the district attaching also the registration form and the fees paid. During the interviews with the District Water Engineers, the research team asked about the
  • 50. 49 necessary steps for establishing and registering COWSOs. The question was open-ended, in order to have exhaustive answers. From DWEs’ replies it is possible to highlight two main differences from the official procedure. First, the election of the permanent committee is often done before completing all the establishment steps. Only three districts underlined that the interim committee has to be formed for drafting the constitution and that, only after this step, COWSO leaders can be elected. In two cases there was no distinction between temporary and permanent committees; while other two districts did not mention the committees at all. Second, in DWE's answers, it is not possible to identify the last step of the establishment procedure as it is prescribed by the guideline. In fact, a COWSO is considered established when the District Executive Director sends a letter of approval. After this step it is possible to proceed to the election of permanent committee. In all districts, the DWEs reported as the last step the issue of the registration certificate, without mentioning a formal step for the conclusion of the establishment. Therefore, the three activities (establishment, registration and election of permanent committee) seem to be conducted without properly following the guidelines. Graph 9 illustrates the ten official steps of the establishment procedure. They are described on the x-axis. The bars represent the percentage of districts that implement each activity. The bars coloured in red highlight the fact that those steps are conducted differently with respect to the official procedure.
  • 51. 50 Graph 9: The ten steps of the establishment procedure and the percentages, for each step, of districts that implement them. The entire process is as follows: 1. The district, mainly through CWSTs, introduces the idea of COWSO to village government (or to village water and sanitation committee). All DWEs reported this step. 2. The results of this introductory meeting will be shared with the community through a village assembly. Six DWEs (86 percent) reported this activity. 3. The district, through the CWSTs, should illustrate to the village community different types of COWSO and the various steps of their establishment. Thereafter, the community should decide which type of COWSO they prefer. This step has been reported only by one DWE (14 percent). Although it is very important to take an informed decision about which type of COWSO should be established, the absence of this step is probably a 100% 86% 14% 14% 71% 100% 29% 43% 100% 43% 100% 0% 20% 40% 60% 80% 100% 120% Process steps for COWSO establishment and registration
  • 52. 51 consequence of the fact that the majority of actors in the rural water supply think of COWSO as associations of water users (i.e. WCA) not taking into account all other types. 4. In the official guideline step four includes the duty for the VG to call an assembly for the formal decision on the type of COWSO. Thereafter, the assembly elects the interim committee responsible for drafting the constitution. In the graph, the two activities are divided in point 4.1 and 4.2. Only one DWE reported that the VG organizes the assembly for deciding the COWSO type. At the same time, five DWEs (71 percent) told that an interim committee is elected. The bar in the graph is red because, actually, two districts did not distinguish between the interim committee and the permanent one: they simply told that COWSO leaders are elected. 5. Step five is the constitution drafting. All the interviewed DWEs mentioned this activity. 6. In the official guidelines, at this stage the interim committee should present the draft of the constitution to the village assembly for approval. During the interviews, only in one case it was highlighted that the interim committee presents the draft. Another DWE reported that the committee discusses it preliminarily with the VG, which, thereafter calls an assembly. This procedure can affect the whole process: in fact, the decision about the COWSO constitution should be made independently from the political authorities in the village. In the graph, the bar (29 percent) represents the answers of these two engineers. 7. This step involves the Ward. The interim committee should send the constitution to the Ward Development Committee for approval. Only three DWEs (43 percent) mentioned this activity. 8. After Ward approval, the drafted constitution has to be sent to the district. There, the DED should check the application and the minutes of meetings before giving his/her
  • 53. 52 approval. The bar is red because all the DWEs reported to conduct this activity in different ways with respect to the official guideline. Some of them said that the CWST is responsible for checking the constitution; some others attributed this role to themselves or to the Community Development Officer. 9. All the documents shall be also ratified by the district's full council. Three DWEs (43 percent) reported this step. 10. At this point the DED shall send an approval letter to the village, formally recognizing COWSO establishment. The bar in the graph is red because all the DWEs concluded their lists by saying that a registration certificate will be issued by the district. This confusion is consequence of the fact that there is no clear distinction between the establishment and the registration procedures. Districts simplify the procedure suggested by the guidelines. Indeed, the division into three activities (establishment, registration and election of permanent committee) for a total of twenty steps seems too complicated. The consequence of this complex procedure is the heterogeneity across districts. Probably, districts are just adapting to a procedure which is too complicated. 2.2.3.3 Average time and funds needed One key issue for improving the implementation of COWSOs in rural areas is the time needed for establishment and registration. During the interviews with DWEs, the research team asked how long, on average, the district needs to constitute a COWSO, from the first to the last step (i.e. registration included). The answers vary from a minimum of 48 days (Mpwapwa) to a maximum of 90 (Bahi, Chemba and Dodoma). Time suggested by DWEs is theoretical, it is calculated considering all necessary resources available (funds, officers, etc.); otherwise it would be hard to consider these averages realistic: in some districts there are still no registered
  • 54. 53 COWSOs at all. In graph 10, DWEs answers are represented together with the amount of days suggested by NRWSS. In fact, according to government calculations, the current process last on average 252 days, while the proposed procedure will last 42 days. The main difference between the two procedures is the absence of Ward level approval: policy suggests to eliminate this step because it requires time; indeed, Ward Development Committee is supposed to meet every three months. On the procedure suggested by the policy, the first step is called “development of draft of constitution by founder members”. This implies that, in the proposal of 42 days, the introductory meetings between the district and the village authority/community are not included. Summing this additional time (which can be estimated in two weeks) to government's proposal, the resulting days are not distant from DWEs answers. Graph 10: Average time for COWSO establishment and registration in each district. 60 57 90 60 90 90 48 0 20 40 60 80 100 Number of Days for registering one COWSO Number of days from MoW guideline
  • 55. 54 Box 1. The difference between average days and effective days of activity: the case of Kondoa. Some districts provided two different data about the necessary time for COWSO establishment and registration. The first is already presented in graph 10: it is the average time necessary to constitute a COWSO from the first to the last step. The second information provided by districts is the required effective days of activities. In order to understand clearly the difference between these two information, let us consider the example of Kondoa district. The District Water Engineer considered 33 days of effective activities in order to establish and register a COWSO:  Introduction of COWSO to Village Council – 1 day  Village General Meeting – 1 day  Formation of constitution members – 1 day  Constitution writing – 14 days  Election of COWSO leaders – 1 day  Training of COWSO leaders – 5 days  Training of pump attendant – 7 days  Contracts elaboration and signing – 2 days  Issue the certificate of registration – 1 day All previous days of activity sum up to 33. Yet, this cannot be considered the period in which a COWSO is successfully established and registered. Effective days of activities do not consider delays, problems and unforeseen events that might prolong the period. Yet, a detailed program of the activities and the necessary days for implementing them will help in preparing budgets and working plans. In fact, Kondoa is one of the districts that registered 100 percent of the planned COWSO last year.
  • 56. 55 The following graph shows, for each district, the amount of money necessary to establish and register one COWSO. These data were collected through a direct question to DWEs. Some of them could not confirm an exact amount to establish one COWSO, so they provided a total amount spent for COWSO establishment and registration in the district that was then divided by the number of entities indicated by the engineers. Some others had a complete budget of all necessary costs and the final total amount. As it is possible to recognize by looking at the graph, DWEs answers are very heterogeneous. Graph 11: Total cost, reported by DWEs, for establishing and registering one COWSO The reported costs vary from a minimum of 600.000 TSH (Kongwa) to a maximum of 14 million TSH (Kondoa and Mpwapwa). It is beyond the scopes of present research to investigate in details the reasons of these discrepancies, yet it is necessary to underline that it is highly possible that DWEs calculated these total amounts referring to different data. Yet, a brief analysis at district level can be useful to better understand the relative magnitude of funds dedicated to COWSOs. It is noteworthy, that in three out of seven districts, there are no dedicated budget lines for COWSOs. DWEs referred that when they need funds they reallocate resources from the general budget. In the four districts that have a dedicated budget line, the funds available are not enough in three 600,000 14,005,000 2,000,000 1,715,000 5,000,000 3,000,000 14,000,000 0 5000000 10000000 15000000 KONGWA KONDOA DODOMA CHAMWINO CHEMBA BAHI MPWAPWA Total estimated cost for establishment and registration of one COWSO
  • 57. 56 cases. Considering the unit cost per COWSO and the total number of registrations planned for the year 2015, it is possible to calculate the total cost prevision. Then, the comparison of this prevision with the funds dedicated in the budgets shows that three districts do not have enough funds to register the planned COWSOs. Yet, it has to be underlined that this estimation can be too severe because the districts might have considered COWSOs that are already established and do not need the entire cost prevision. Only one district calculated the amount of budget dedicated to COWSOs by multiplying the unit costs and the number of entities planned. For the three districts that do not have a dedicated budget line for COWSOs it is more difficult to do keen evaluation. Yet, after having calculated the cost prevision for each district (unitary cost times number of COWSOs planned), it is possible to estimate the percentage of budget that they will have to reallocate in order to establish the entities. For Kongwa, that reported a very low unit cost, it is 4 percent of the water budget; yet, using as unit cost the regional average, this percentage increases up to 40. In Dodoma and Chemba the funds needed are also high percentages of the total water budgets, implying that there could be a lack of funds. It is necessary to highlight that the government never drafted a guideline suggesting how expensive could be to establish and register a COWSO. 2.2.3.4 Problems hindering the establishment and registration of COWSOs The major problem highlighted by DWEs is the lack of funds for facilitating registration activities. The districts need on average 71 days for establishing and registering one COWSO. The whole process needs time, human and financial resources. Some districts are blaming the central government for underprivileged allocation of budgets for COWSOs registration. One DWE advocated that, lack of fund is the reason why the districts fail to register the COWSOs planned yearly. Also lack of human resources is a problem for the proper implementation of the
  • 58. 57 strategy, as 29% of districts highlighted. In Bahi district this problem is severe. Directives from the government insist that the water department should have 25 members, but in the district there are only 9 officers, and 6 of them are close to the retirement. 57% of DWEs highlighted lack of awareness of villages as one of main problems. COWSOs strategy is a new idea in rural communities and even though it was legally established in 2009, many districts started the implementation only 2 years ago. Villagers do not understand why they should establish COWSOs. In some cases districts go and train villagers several times but the community does not agree with the idea. Hence, districts need extra time and funds to train and raise awareness. Conflicts between stakeholders are affecting 57% of the districts. Water schemes have been the main source of revenue of village authorities for many years and, now, the introduction of new management entities is raising a conflict of interest. Village Government can hardly accept to change management system, mainly because they fear to lose power and control over the revenues. In other cases, conflicts can be manifested between COWSOs and villagers: when the entity fails to provide adequate services the villagers can influence the VG to chase out the COWSO and to replace it with a PO. Some political leaders also reject the COWSO system only because of different political ideologies.
  • 59. 58 Graph 12: In percentage, the problems reported by DWEs that hinder COWSOs establishment and registration Future strategies for improving COWSOs registration and performances Since COWSOs strategy is new for many water stakeholders, 57% of districts proposed to develop training and facilitation programs addressed to districts’ staff, as an important aspect for future improvement of establishment and registration process. 43% of districts highlighted that, training and frequent monitoring is a good strategy for improving COWSOs performance. Other districts referred that government’s funds are not enough to achieve the increase of COWSOs registrations planned. Furthermore, some districts seek assistance from international and local organizations: for instance, TASAF – the Tanzania Social Action Fund - implements community awareness programs in Dodoma municipal. Also MAMADO, a non-governmental organization, supported the formation of 7 COWSOs in Bahi district last year. 100% 57% 29% 57% 0% 25% 50% 75% 100% Lack of fund Lack of community awareness Inadequate human resources Conflicts between stakeholders Poblems of COWSOs registration and establishement processes
  • 60. 59 Graph 13: Proposed DWEs’ strategies (in percentage) to improve COWSOs registration and performances 2.2.4 Private Sector 2.2.4.1 Involvement of the district in the selection of Private Operators The second part of the interviews with DWEs focused on the role of private sector in rural water management. As we have previously shown, in the Dodoma region private operators are the second largest group (28 percent) running water schemes. Generally, they are responsible for the operation of the scheme and for the ordinary maintenance. According to the normative framework, privates can act as service providers, while the property of the projects should remain to the communities through COWSOs. Actually, private operators usually conclude agreements with village authorities, instead of COWSOs as it should be in accordance with the law. The research team asked to the District Water Engineers if they received some directives from the government on how to regulate the involvement of private operators. All of them reported that they never received any guideline or advices; the only normative source that they mentioned is the National Water Policy of 2002, in which it is stated that the involvement of privates (for service delivery) should be improved and facilitated (NAWAPO 2002, p. 34). As it is shown by 57% 29% 29% 57% -20% 0% 20% 40% 60% Training and facilitation programs for staffs Raising awareness of stakeholders Propose assistance from Donors Training and monitoring COWSOs Proposed strategies for improving COWSOs registration and performances
  • 61. 60 graph 14, the majority of DWEs (57 percent) told that the district is not involved in the private operators’ selection conducted by villages. On the contrary, three DWEs (43 percent) reported that they are involved. After a deep discussion about the ways in which the districts intervene in the first steps of the selection process, it came out that all districts (also the ones that reported not being involved) play a supervising role. The final decision about the candidate as private manager is left to the communities; yet, districts give advice and control the procedure. In Mpwapwa, district officers reported that they provide clarification about the private operators’ functions. For example, they suggest that contract people shall run the system with appropriate technical skills. Graph 14: Percentages of districts involved in the selection of POs. Finally, the DWE of Bahi reported that they would like to increase their involvement also at early stages of the selection in order to avoid the risk of corruption between privates and village authorities. 43% 57% Districts are involved in PO selection Yes No