SlideShare a Scribd company logo
1 of 8
NORMAL CURVE
0
0.01
0.02
0.03
0.04
0.05
0.06
0.07
0.08
0.09
0.1
µ
+σ−σ +1 9 6. σ−1 9 6. σ
Area = .6823
2/3 of the population lies
between +- 1 st. deviation
Area = .95
2.5% of population2.5% of population
95% of the population lies
between +- 1.96 st. deviations
NORMAL CURVE
0
0.01
0.02
0.03
0.04
0.05
0.06
0.07
0.08
0.09
0.1
0 50 100 150 200 250 300
µ σ= =1 7 0 4 5,
Area = .4406
Z
x i
=
−
=
−
= −
( ) ( )
.
µ
σ
1 0 0 1 7 0
4 5
1 5 6
Area = .5 - .4406 = .0594
Area under the curve = 1
Three Distinct DistributionsThree Distinct Distributions
Mean St. Dev. Mean St. Dev.
1) Population
2) Sample
3) Sampling
Proportions Means
Distributions
N
Central Limit TheoremCentral Limit Theorem
If Repeated Random Samples of sizeIf Repeated Random Samples of size nn
are drawn from any population (ofare drawn from any population (of
whatever form) having a Meanwhatever form) having a Mean µµ andand
Standard DeviationStandard Deviation , then as, then as nn becomesbecomes
very largevery large, the Sampling Distribution of, the Sampling Distribution of
sample means approachessample means approaches NormalityNormality withwith
MeanMean µµ and Standard Deviationand Standard Deviation σ / .n
% of Population that pays $250 = .17%
0
0.01
0.02
0.03
0.04
0.05
0.06
0.07
0.08
0.09
0.1
0 50 100 150 200 250 300
Z
a r e a
=
−
= =
=
2 4 9 5 1 7 0
4 5
7 9 5
4 5
1 7 7
4 6 1 6
. .
.
.
Z
a r e a
=
−
= =
=
2 5 0 5 1 7 0
4 5
8 0 5
4 5
1 7 9
4 6 3 3
. .
.
.
. . . .4 6 3 3 4 6 1 6 0 0 1 7 1 7 %− = o r
µ σ= =1 7 0 4 5,
20% of the population pays less than $132.20.
0
0.01
0.02
0.03
0.04
0.05
0.06
0.07
0.08
0.09
0.1
0 50 100 150 200 250 300
area = .2 area = .3
Z-score of area of .2995 (~.3) = -0.84
− =
−
− = − ⋅ = −
= − + =
0 8 4
1 7 0
4 5
1 7 0 8 4 4 5 3 7 8
3 7 8 1 7 0 1 3 2 2
.
. .
. .
x
x
x
µ σ= =1 7 0 4 5,
Z
x
=
− µ
σ
$132.20
Sampling Distribution for MeansSampling Distribution for Means
““If repeatedIf repeated Random Samples of SizeRandom Samples of Size nn areare
drawn from a normal population withdrawn from a normal population with MeanMean
µµ andand Standard DeviationStandard Deviation , the Sampling, the Sampling
Distribution of sample means will be normalDistribution of sample means will be normal
with Meanwith Mean µµ and Standard Deviationand Standard Deviation
--known as the Standard Error.”--known as the Standard Error.”σ / n
Sampling Distribution for Sample Means for a
Population with
0
0.05
0.1
0.15
0.2
0.25
0.3
7000 7050 7100 7150 7200 7250 7300 7350 7400 7450 7500 7550 7600 7650 7700 7750 7800 7850 7900 7950 8000

More Related Content

Similar to Normal_Curves_z-scores

Statistik 1 6 distribusi probabilitas normal
Statistik 1 6 distribusi probabilitas normalStatistik 1 6 distribusi probabilitas normal
Statistik 1 6 distribusi probabilitas normalSelvin Hadi
 
4 2 continuous probability distributionn
4 2 continuous probability    distributionn4 2 continuous probability    distributionn
4 2 continuous probability distributionnLama K Banna
 
02 PSBE3_PPT.Ch01_2_Examining Distribution.ppt
02 PSBE3_PPT.Ch01_2_Examining Distribution.ppt02 PSBE3_PPT.Ch01_2_Examining Distribution.ppt
02 PSBE3_PPT.Ch01_2_Examining Distribution.pptBishoyRomani
 
8. normal distribution qt pgdm 1st semester
8. normal distribution qt pgdm 1st  semester8. normal distribution qt pgdm 1st  semester
8. normal distribution qt pgdm 1st semesterKaran Kukreja
 
Discrete and continuous probability distributions ppt @ bec doms
Discrete and continuous probability distributions ppt @ bec domsDiscrete and continuous probability distributions ppt @ bec doms
Discrete and continuous probability distributions ppt @ bec domsBabasab Patil
 
The standard normal curve & its application in biomedical sciences
The standard normal curve & its application in biomedical sciencesThe standard normal curve & its application in biomedical sciences
The standard normal curve & its application in biomedical sciencesAbhi Manu
 
Normal Probability Distribution
Normal Probability DistributionNormal Probability Distribution
Normal Probability Distributionmandalina landy
 
Estimating a Population Standard Deviation or Variance
Estimating a Population Standard Deviation or VarianceEstimating a Population Standard Deviation or Variance
Estimating a Population Standard Deviation or VarianceLong Beach City College
 
Estimating a Population Standard Deviation or Variance
Estimating a Population Standard Deviation or Variance Estimating a Population Standard Deviation or Variance
Estimating a Population Standard Deviation or Variance Long Beach City College
 
Normal probability distribution
Normal probability distributionNormal probability distribution
Normal probability distributionNadeem Uddin
 
Solution to the Practice Test 3A, Normal Probability Distribution
Solution to the Practice Test 3A, Normal Probability DistributionSolution to the Practice Test 3A, Normal Probability Distribution
Solution to the Practice Test 3A, Normal Probability DistributionLong Beach City College
 
Mean, median, and mode ug
Mean, median, and mode ugMean, median, and mode ug
Mean, median, and mode ugAbhishekDas15
 
continuous probability distributions.ppt
continuous probability distributions.pptcontinuous probability distributions.ppt
continuous probability distributions.pptLLOYDARENAS1
 
Normal Distribution including some examples
Normal Distribution including some examplesNormal Distribution including some examples
Normal Distribution including some exampleshearviesalibio1
 
Solution to the Practice Test 3A, Chapter 6 Normal Probability Distribution
Solution to the Practice Test 3A, Chapter 6 Normal Probability DistributionSolution to the Practice Test 3A, Chapter 6 Normal Probability Distribution
Solution to the Practice Test 3A, Chapter 6 Normal Probability DistributionLong Beach City College
 

Similar to Normal_Curves_z-scores (20)

Statistik 1 6 distribusi probabilitas normal
Statistik 1 6 distribusi probabilitas normalStatistik 1 6 distribusi probabilitas normal
Statistik 1 6 distribusi probabilitas normal
 
4 2 continuous probability distributionn
4 2 continuous probability    distributionn4 2 continuous probability    distributionn
4 2 continuous probability distributionn
 
Ch05
Ch05Ch05
Ch05
 
02 PSBE3_PPT.Ch01_2_Examining Distribution.ppt
02 PSBE3_PPT.Ch01_2_Examining Distribution.ppt02 PSBE3_PPT.Ch01_2_Examining Distribution.ppt
02 PSBE3_PPT.Ch01_2_Examining Distribution.ppt
 
Inferiential statistics .pptx
Inferiential statistics .pptxInferiential statistics .pptx
Inferiential statistics .pptx
 
8. normal distribution qt pgdm 1st semester
8. normal distribution qt pgdm 1st  semester8. normal distribution qt pgdm 1st  semester
8. normal distribution qt pgdm 1st semester
 
Discrete and continuous probability distributions ppt @ bec doms
Discrete and continuous probability distributions ppt @ bec domsDiscrete and continuous probability distributions ppt @ bec doms
Discrete and continuous probability distributions ppt @ bec doms
 
The standard normal curve & its application in biomedical sciences
The standard normal curve & its application in biomedical sciencesThe standard normal curve & its application in biomedical sciences
The standard normal curve & its application in biomedical sciences
 
Normal Probability Distribution
Normal Probability DistributionNormal Probability Distribution
Normal Probability Distribution
 
Estimating a Population Standard Deviation or Variance
Estimating a Population Standard Deviation or VarianceEstimating a Population Standard Deviation or Variance
Estimating a Population Standard Deviation or Variance
 
Estimating a Population Standard Deviation or Variance
Estimating a Population Standard Deviation or Variance Estimating a Population Standard Deviation or Variance
Estimating a Population Standard Deviation or Variance
 
Normal probability distribution
Normal probability distributionNormal probability distribution
Normal probability distribution
 
Solution to the Practice Test 3A, Normal Probability Distribution
Solution to the Practice Test 3A, Normal Probability DistributionSolution to the Practice Test 3A, Normal Probability Distribution
Solution to the Practice Test 3A, Normal Probability Distribution
 
Mean, median, and mode ug
Mean, median, and mode ugMean, median, and mode ug
Mean, median, and mode ug
 
lecture6.ppt
lecture6.pptlecture6.ppt
lecture6.ppt
 
continuous probability distributions.ppt
continuous probability distributions.pptcontinuous probability distributions.ppt
continuous probability distributions.ppt
 
Normal Distribution
Normal DistributionNormal Distribution
Normal Distribution
 
Input analysis
Input analysisInput analysis
Input analysis
 
Normal Distribution including some examples
Normal Distribution including some examplesNormal Distribution including some examples
Normal Distribution including some examples
 
Solution to the Practice Test 3A, Chapter 6 Normal Probability Distribution
Solution to the Practice Test 3A, Chapter 6 Normal Probability DistributionSolution to the Practice Test 3A, Chapter 6 Normal Probability Distribution
Solution to the Practice Test 3A, Chapter 6 Normal Probability Distribution
 

More from Omar (TUBBS 128) Ventura VII (9)

Sampling and Inference_Political_Science
Sampling and Inference_Political_ScienceSampling and Inference_Political_Science
Sampling and Inference_Political_Science
 
The New Fair Property Assessment Plan
The New Fair Property Assessment PlanThe New Fair Property Assessment Plan
The New Fair Property Assessment Plan
 
The fair assessmetn_plan_spring_2006_cory_cook_ca_pol
The fair assessmetn_plan_spring_2006_cory_cook_ca_polThe fair assessmetn_plan_spring_2006_cory_cook_ca_pol
The fair assessmetn_plan_spring_2006_cory_cook_ca_pol
 
Explanations and hypotheses ch 2
Explanations and hypotheses ch 2Explanations and hypotheses ch 2
Explanations and hypotheses ch 2
 
Hypothesis testng
Hypothesis testngHypothesis testng
Hypothesis testng
 
Examining relationships m2
Examining relationships m2Examining relationships m2
Examining relationships m2
 
Ch 7 regression_lab_outpu1
Ch 7 regression_lab_outpu1Ch 7 regression_lab_outpu1
Ch 7 regression_lab_outpu1
 
Ch 7 correlation_and_linear_regression
Ch 7 correlation_and_linear_regressionCh 7 correlation_and_linear_regression
Ch 7 correlation_and_linear_regression
 
Correlation & Regression_
Correlation & Regression_Correlation & Regression_
Correlation & Regression_
 

Recently uploaded

Beyond the EU: DORA and NIS 2 Directive's Global Impact
Beyond the EU: DORA and NIS 2 Directive's Global ImpactBeyond the EU: DORA and NIS 2 Directive's Global Impact
Beyond the EU: DORA and NIS 2 Directive's Global ImpactPECB
 
Separation of Lanthanides/ Lanthanides and Actinides
Separation of Lanthanides/ Lanthanides and ActinidesSeparation of Lanthanides/ Lanthanides and Actinides
Separation of Lanthanides/ Lanthanides and ActinidesFatimaKhan178732
 
Employee wellbeing at the workplace.pptx
Employee wellbeing at the workplace.pptxEmployee wellbeing at the workplace.pptx
Employee wellbeing at the workplace.pptxNirmalaLoungPoorunde1
 
Activity 01 - Artificial Culture (1).pdf
Activity 01 - Artificial Culture (1).pdfActivity 01 - Artificial Culture (1).pdf
Activity 01 - Artificial Culture (1).pdfciinovamais
 
18-04-UA_REPORT_MEDIALITERAСY_INDEX-DM_23-1-final-eng.pdf
18-04-UA_REPORT_MEDIALITERAСY_INDEX-DM_23-1-final-eng.pdf18-04-UA_REPORT_MEDIALITERAСY_INDEX-DM_23-1-final-eng.pdf
18-04-UA_REPORT_MEDIALITERAСY_INDEX-DM_23-1-final-eng.pdfssuser54595a
 
1029 - Danh muc Sach Giao Khoa 10 . pdf
1029 -  Danh muc Sach Giao Khoa 10 . pdf1029 -  Danh muc Sach Giao Khoa 10 . pdf
1029 - Danh muc Sach Giao Khoa 10 . pdfQucHHunhnh
 
Call Girls in Dwarka Mor Delhi Contact Us 9654467111
Call Girls in Dwarka Mor Delhi Contact Us 9654467111Call Girls in Dwarka Mor Delhi Contact Us 9654467111
Call Girls in Dwarka Mor Delhi Contact Us 9654467111Sapana Sha
 
URLs and Routing in the Odoo 17 Website App
URLs and Routing in the Odoo 17 Website AppURLs and Routing in the Odoo 17 Website App
URLs and Routing in the Odoo 17 Website AppCeline George
 
The Most Excellent Way | 1 Corinthians 13
The Most Excellent Way | 1 Corinthians 13The Most Excellent Way | 1 Corinthians 13
The Most Excellent Way | 1 Corinthians 13Steve Thomason
 
Student login on Anyboli platform.helpin
Student login on Anyboli platform.helpinStudent login on Anyboli platform.helpin
Student login on Anyboli platform.helpinRaunakKeshri1
 
Accessible design: Minimum effort, maximum impact
Accessible design: Minimum effort, maximum impactAccessible design: Minimum effort, maximum impact
Accessible design: Minimum effort, maximum impactdawncurless
 
Advanced Views - Calendar View in Odoo 17
Advanced Views - Calendar View in Odoo 17Advanced Views - Calendar View in Odoo 17
Advanced Views - Calendar View in Odoo 17Celine George
 
Measures of Central Tendency: Mean, Median and Mode
Measures of Central Tendency: Mean, Median and ModeMeasures of Central Tendency: Mean, Median and Mode
Measures of Central Tendency: Mean, Median and ModeThiyagu K
 
Contemporary philippine arts from the regions_PPT_Module_12 [Autosaved] (1).pptx
Contemporary philippine arts from the regions_PPT_Module_12 [Autosaved] (1).pptxContemporary philippine arts from the regions_PPT_Module_12 [Autosaved] (1).pptx
Contemporary philippine arts from the regions_PPT_Module_12 [Autosaved] (1).pptxRoyAbrique
 
Q4-W6-Restating Informational Text Grade 3
Q4-W6-Restating Informational Text Grade 3Q4-W6-Restating Informational Text Grade 3
Q4-W6-Restating Informational Text Grade 3JemimahLaneBuaron
 
Z Score,T Score, Percential Rank and Box Plot Graph
Z Score,T Score, Percential Rank and Box Plot GraphZ Score,T Score, Percential Rank and Box Plot Graph
Z Score,T Score, Percential Rank and Box Plot GraphThiyagu K
 

Recently uploaded (20)

Beyond the EU: DORA and NIS 2 Directive's Global Impact
Beyond the EU: DORA and NIS 2 Directive's Global ImpactBeyond the EU: DORA and NIS 2 Directive's Global Impact
Beyond the EU: DORA and NIS 2 Directive's Global Impact
 
Separation of Lanthanides/ Lanthanides and Actinides
Separation of Lanthanides/ Lanthanides and ActinidesSeparation of Lanthanides/ Lanthanides and Actinides
Separation of Lanthanides/ Lanthanides and Actinides
 
Employee wellbeing at the workplace.pptx
Employee wellbeing at the workplace.pptxEmployee wellbeing at the workplace.pptx
Employee wellbeing at the workplace.pptx
 
Activity 01 - Artificial Culture (1).pdf
Activity 01 - Artificial Culture (1).pdfActivity 01 - Artificial Culture (1).pdf
Activity 01 - Artificial Culture (1).pdf
 
18-04-UA_REPORT_MEDIALITERAСY_INDEX-DM_23-1-final-eng.pdf
18-04-UA_REPORT_MEDIALITERAСY_INDEX-DM_23-1-final-eng.pdf18-04-UA_REPORT_MEDIALITERAСY_INDEX-DM_23-1-final-eng.pdf
18-04-UA_REPORT_MEDIALITERAСY_INDEX-DM_23-1-final-eng.pdf
 
1029 - Danh muc Sach Giao Khoa 10 . pdf
1029 -  Danh muc Sach Giao Khoa 10 . pdf1029 -  Danh muc Sach Giao Khoa 10 . pdf
1029 - Danh muc Sach Giao Khoa 10 . pdf
 
Call Girls in Dwarka Mor Delhi Contact Us 9654467111
Call Girls in Dwarka Mor Delhi Contact Us 9654467111Call Girls in Dwarka Mor Delhi Contact Us 9654467111
Call Girls in Dwarka Mor Delhi Contact Us 9654467111
 
URLs and Routing in the Odoo 17 Website App
URLs and Routing in the Odoo 17 Website AppURLs and Routing in the Odoo 17 Website App
URLs and Routing in the Odoo 17 Website App
 
Staff of Color (SOC) Retention Efforts DDSD
Staff of Color (SOC) Retention Efforts DDSDStaff of Color (SOC) Retention Efforts DDSD
Staff of Color (SOC) Retention Efforts DDSD
 
Mattingly "AI & Prompt Design: The Basics of Prompt Design"
Mattingly "AI & Prompt Design: The Basics of Prompt Design"Mattingly "AI & Prompt Design: The Basics of Prompt Design"
Mattingly "AI & Prompt Design: The Basics of Prompt Design"
 
The Most Excellent Way | 1 Corinthians 13
The Most Excellent Way | 1 Corinthians 13The Most Excellent Way | 1 Corinthians 13
The Most Excellent Way | 1 Corinthians 13
 
Student login on Anyboli platform.helpin
Student login on Anyboli platform.helpinStudent login on Anyboli platform.helpin
Student login on Anyboli platform.helpin
 
Accessible design: Minimum effort, maximum impact
Accessible design: Minimum effort, maximum impactAccessible design: Minimum effort, maximum impact
Accessible design: Minimum effort, maximum impact
 
INDIA QUIZ 2024 RLAC DELHI UNIVERSITY.pptx
INDIA QUIZ 2024 RLAC DELHI UNIVERSITY.pptxINDIA QUIZ 2024 RLAC DELHI UNIVERSITY.pptx
INDIA QUIZ 2024 RLAC DELHI UNIVERSITY.pptx
 
Advanced Views - Calendar View in Odoo 17
Advanced Views - Calendar View in Odoo 17Advanced Views - Calendar View in Odoo 17
Advanced Views - Calendar View in Odoo 17
 
Measures of Central Tendency: Mean, Median and Mode
Measures of Central Tendency: Mean, Median and ModeMeasures of Central Tendency: Mean, Median and Mode
Measures of Central Tendency: Mean, Median and Mode
 
Código Creativo y Arte de Software | Unidad 1
Código Creativo y Arte de Software | Unidad 1Código Creativo y Arte de Software | Unidad 1
Código Creativo y Arte de Software | Unidad 1
 
Contemporary philippine arts from the regions_PPT_Module_12 [Autosaved] (1).pptx
Contemporary philippine arts from the regions_PPT_Module_12 [Autosaved] (1).pptxContemporary philippine arts from the regions_PPT_Module_12 [Autosaved] (1).pptx
Contemporary philippine arts from the regions_PPT_Module_12 [Autosaved] (1).pptx
 
Q4-W6-Restating Informational Text Grade 3
Q4-W6-Restating Informational Text Grade 3Q4-W6-Restating Informational Text Grade 3
Q4-W6-Restating Informational Text Grade 3
 
Z Score,T Score, Percential Rank and Box Plot Graph
Z Score,T Score, Percential Rank and Box Plot GraphZ Score,T Score, Percential Rank and Box Plot Graph
Z Score,T Score, Percential Rank and Box Plot Graph
 

Normal_Curves_z-scores

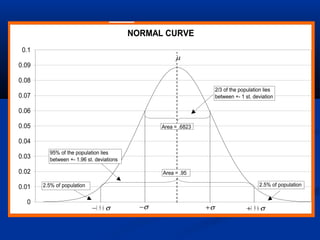
  • 1. NORMAL CURVE 0 0.01 0.02 0.03 0.04 0.05 0.06 0.07 0.08 0.09 0.1 µ +σ−σ +1 9 6. σ−1 9 6. σ Area = .6823 2/3 of the population lies between +- 1 st. deviation Area = .95 2.5% of population2.5% of population 95% of the population lies between +- 1.96 st. deviations
  • 2. NORMAL CURVE 0 0.01 0.02 0.03 0.04 0.05 0.06 0.07 0.08 0.09 0.1 0 50 100 150 200 250 300 µ σ= =1 7 0 4 5, Area = .4406 Z x i = − = − = − ( ) ( ) . µ σ 1 0 0 1 7 0 4 5 1 5 6 Area = .5 - .4406 = .0594 Area under the curve = 1
  • 3. Three Distinct DistributionsThree Distinct Distributions Mean St. Dev. Mean St. Dev. 1) Population 2) Sample 3) Sampling Proportions Means Distributions N
  • 4. Central Limit TheoremCentral Limit Theorem If Repeated Random Samples of sizeIf Repeated Random Samples of size nn are drawn from any population (ofare drawn from any population (of whatever form) having a Meanwhatever form) having a Mean µµ andand Standard DeviationStandard Deviation , then as, then as nn becomesbecomes very largevery large, the Sampling Distribution of, the Sampling Distribution of sample means approachessample means approaches NormalityNormality withwith MeanMean µµ and Standard Deviationand Standard Deviation σ / .n
  • 5. % of Population that pays $250 = .17% 0 0.01 0.02 0.03 0.04 0.05 0.06 0.07 0.08 0.09 0.1 0 50 100 150 200 250 300 Z a r e a = − = = = 2 4 9 5 1 7 0 4 5 7 9 5 4 5 1 7 7 4 6 1 6 . . . . Z a r e a = − = = = 2 5 0 5 1 7 0 4 5 8 0 5 4 5 1 7 9 4 6 3 3 . . . . . . . .4 6 3 3 4 6 1 6 0 0 1 7 1 7 %− = o r µ σ= =1 7 0 4 5,
  • 6. 20% of the population pays less than $132.20. 0 0.01 0.02 0.03 0.04 0.05 0.06 0.07 0.08 0.09 0.1 0 50 100 150 200 250 300 area = .2 area = .3 Z-score of area of .2995 (~.3) = -0.84 − = − − = − ⋅ = − = − + = 0 8 4 1 7 0 4 5 1 7 0 8 4 4 5 3 7 8 3 7 8 1 7 0 1 3 2 2 . . . . . x x x µ σ= =1 7 0 4 5, Z x = − µ σ $132.20
  • 7. Sampling Distribution for MeansSampling Distribution for Means ““If repeatedIf repeated Random Samples of SizeRandom Samples of Size nn areare drawn from a normal population withdrawn from a normal population with MeanMean µµ andand Standard DeviationStandard Deviation , the Sampling, the Sampling Distribution of sample means will be normalDistribution of sample means will be normal with Meanwith Mean µµ and Standard Deviationand Standard Deviation --known as the Standard Error.”--known as the Standard Error.”σ / n
  • 8. Sampling Distribution for Sample Means for a Population with 0 0.05 0.1 0.15 0.2 0.25 0.3 7000 7050 7100 7150 7200 7250 7300 7350 7400 7450 7500 7550 7600 7650 7700 7750 7800 7850 7900 7950 8000