SlideShare uma empresa Scribd logo
1 de 49
Understanding natural
populations with dynamic models


        Edmund M. Hart
      University of Vermont
The beginning


                Charles Elton
                 1900-1991


                A. J. Nicholson
                  1895-1969
The beginning


                                                             H. G. Andrewartha
                                                                 1907-1992


                                                             L. Charles Birch
The logarithm of the average population size per month for      1918-2009
several years in the study of Thrips imaginis
The unanswered question


                                        A. J. Nicholson     Charles Elton
                                          1895-1969          1900-1991


How can we fit experimental and
observational data to population
dynamic models in order to understand
what regulates populations?             H. G. Andrewartha
                                            1907-1992
                                                            L. Charles Birch
                                                               1918-2009
First principles

     N        B D


      N        B D
rt
     Nt   1     Nt 1
First principles

      N     B D             Nt
rt                       ln
     Nt 1    Nt 1           Nt 1


      Nt    Nt   1   rt N t   1
First principles

          Nt     Nt   1   rt N t   1


rt   f ( N , environment , competitors, etc...)
Mathematical Framework
Three basic types of population growth


    Random Walk                              rt     0 N (0,       2
                                                                      )

    Exponential Growth                        rt     r0   N (0,       2
                                                                          )

    Logistic Growth (Ricker form   rt   r0         N t 1 exp(c)           Ν( 0 ,σ 2 )
    shown)
Mathematical Framework
Random walk                 Density dependent


              Exponential
Mathematical Framework
Random walk                 Density dependent


              Exponential
Mathematical Framework
       Vertical shift


        rt   f ( N t 1 ) g ( zt )
Mathematical Framework
       Lateral shift


         rt   f ( Nt   1   zt )
Testing hypotheses

Two methods:
  Carry out experiments and test how
   populations change over parameter
   space


  Fit models to observational data
Experimental approach


How can expected changes in the mean
and variance of an environmental factor
caused by climate change alter
population processes in aquatic
communities?
Experimental approach


Climate change in New England
Experimental approach


Surface response
7 Levels of Water Variation
7 Levels of Water mean depth
Fully crossed for 49 tubs

Means (cm): 6.6,9.9,13.2,
16.5,19.8, 23.1, 26.4

Coeffecients of Variation
(C.V.): 0,.1,.2,.3,.4,.5,.6
Experimental approach
                     Mean Water Level

                 Low water level, high CV   High water level, high CV
Water C.V.


                                            High water level, low CV
                Low water level, low CV
Experimental approach

                  Mosquitoes


Midges
Experimental approach
ymn   0   1   MWL   WCV
                    2     3   MWL *WCV   mn


                                 β1 (p<0.05) R2=0.27


                                 β2 (p<0.05)
                                 β3 (p<0.05) R2=0.49
Experimental approach

                                        2           jk           Growth rate, same as r0
rtjk ~ N (   jk   jk X [t     1] jk ,   r   )
                                                  jk             Strength of density dependence
                                                X [t     1] jk   Log abundance


  jk                                                             Grand mean
                                                                 Effect of mean water level
  jk
                                                                 Effect of water level CV


                                                U                A vector of 0’s of length 2
B j ~ MVN (U ,        B   )                      B               A 2x2 variance covariance matrix
Experimental approach
Growth rate   Density dependence

                                   Estimates of the Gompertz logistic
                                   (GL) parameters for each treatment
                                   combination for growth rate and
                                   density dependence in Culicidae
                                   and Chironomidae. Darker squares
                                   indicate either higher population
                                   growth rate or stronger density
                                   dependence.
Experimental approach
                Growth rate   Density dependence
Experimental approach

• The mean and variance of pond hydrological
  process impacts larval abundance in opposing
  directions

• Abundances change due to alterations in
  population dynamic parameters

      Changes in intrinsic rate of increase in mosquitoes probably due to
       female oviposition choice
      Density dependent effects in midges most likely caused by
       competition for space
Observational approach

      Using monitoring data, how
      can we understand what
      controls toxic algal bloom
      population dynamics in
      Missisquoi Bay?
Observational approach
   Microcystis   Anabaena
Observational approach
     The nutrients                         The competitors


                          Chlorophyceae (green algae)   Bacillariophyceae (diatoms)


TP   SRP             TN


           TN

           TP                                   Cryptophyceae
Observational approach
Toxic algal blooms in Missisquoi Bay
             2003 - 2006
                                       •   Data is from the Rubenstein
                                           Ecosystems Science Laboratory’s toxic
                                           algal bloom monitoring program

                                       •   Data from dominant taxa (Microcystis
                                           2003-2005, Anabaena 2006)

                                       •   Averaged across all sites within
                                           Missisquoi bay for each year

                                       •   Included only sites that had ancillary
                                           nutrient data
Observational approach
                Nt          Nt      1     rt N t    1


rt   f ( Nt 1 , Nt 2 ...Nt d ) g ( Et , Et 1...Et d ) h(C1t 1 C1t 2...C1t d )
Observational approach
                        Exogenous drivers
           rt   f ( Nt 1 , Nt 2 ...Nt d ) g ( Et , Et 1...Et d ) h(C1t 1 C1t 2...C1t d )


f ( N t d ) r0 N t 1 exp( c)         g ( Et d )     E
                                                   1 t d           h(C1t d )       C1t
                                                                                  1        d

Ricker logistic growth                     Linear                         Linear
Observational approach


           rt   f ( Nt 1 , Nt 2 ...Nt d ) g ( Et , Et 1...Et d ) h(C1t 1 C1t 2...C1t d )


f ( N t d ) r0 N t 1 exp( c)          g ( Et d )    E
                                                   1 t d                    h(C1t d )   C1t
                                                                                        1     d


                                rt   r0 N t 1 exp( c)          1   Et   d

                               rt    r0 N t 1 exp( c       1   Et d )
                               rt    r0 N t 1 exp( c       C1t d )
                                                           1
Observational approach
          We fit 29 different models from the following:
Random walk /        Density dependent             Environmental factors                       Competitors
exponential growth   (endogenous factors)

     rt   r0          rt   r0 N t 1 exp( c)    rt    r0 N t 1 exp( c)        1   Et       rt    r0 N t 1 exp( c   C1t 1 )
                                                                                                                  1


                                               rt     r0 N t 1 exp( c)       1   Et   1

                                               rt    r0 N t 1 exp( c     1   Et )

                                               rt    r0 N t 1 exp( c     1   Et 1 )
                                               rt    r0    1   Et

                                              rt     r0    E
                                                          1 t 1


           Assessed model fit with AICc (AIC + 2K(K+1)/n-K-1)
Observational approach

   Growth rates of toxic algal blooms in Missisquoi Bay 2003 - 2006
Observational approach

   Growth rates of toxic algal blooms in Missisquoi Bay 2003 - 2006
Observational approach

        2004 Microcystis
Observational approach
   2003 Microcystis   2005 Microcystis


                       2006 Anabaena
 2004 Microcystis


                                         Julian Day
Observational approach
                           Julian   Growth Microcystis
             Microcystis
                            Day      Rate   (cells/ml)
  Julian Day (cells/ml)
                            182      2.54    3667.88
     182      3667.883      188      0.65  46381.51
     188     46381.514      195      0.23  89095.14
     195     89095.144      203      -1.28 111960.54
     203     111960.543     210      -0.45 31070.73
     210     31070.727      217      -0.19 19824.80
     217     19824.800      224      0.52  16395.25
     224     16395.252      231      -0.05 27626.31
     231     27626.305      238      0.52  26363.80
     238     26363.801      247      -0.48 44301.53
     247     44301.534      252      0.47  27541.29
     252     27541.291      259      -0.99 43930.60
     259     43930.596      267      -0.01 16324.47
     267     16324.465
                            273      -0.93 16104.06
     273     16104.062
                            280      0.35    6366.31
     280      6366.310
     287      9052.005
Observational approach

                                                                        AICc   ∆AICc   AIC      R2
                       Model                                                           weight

                                                         TN t           33.1   0       0.63     0.8
                        rt    r0    N t 1 exp( c)    1
                                                         TPt
                                                                        38.3   5.2     0.04     0.71
                         rt    r0   N t 1 exp( c)        TPt
                                                         1


                                                                        38.4   5.3     0.04     0.64
                         rt    r0    N t 1 exp( c)

                                                                        38.9   5.8     0.03     0.7
                        rt    r0    N t 1 exp( c)    1TN t      1


                                                                        38.9   5.8     0.03     0.7
                        rt    r0    N t 1 exp( c)    1   SRPt       1


                                               TN t
   rt   0.28   N t 1 exp( 10 .8) 0.08
                                               TPt
Decline phase dynamics

                                                                     AICc    ∆AICc     AIC         R2
                   Model                                                               weight


                       rt         r0   N t 1 exp( c        TN t )    78.8    0         0.21        0.18
                                                       1


                                                                     81.2    2.4       0.06        -
                  rt             r0

                                                                     81.4    2.6       0.06        0.13
                   rt            r0    N t 1 exp( c    TPt )
                                                       1


                                                                     81.6    2.8       0.05        0.12
                   rt             r0   N t 1 exp( c    1   Crt 1 )

                            rt    r0   N t 1 exp( c)                 81.7    2.9       0.05        0.04


                                                                            * Cr = Cryptophyceae


    rt   0.12   N t 1 exp( 7.05 33 .1* TN t )
Two phase growth

Growth rates of toxic algal blooms in Missisquoi Bay 2003 - 2006


                                                                                              TNt
                                                                        r0    Nt 1 exp(c)   1     ,t    5
                                                                   rt                         TPt
                                                                         r0    Nt 1 exp(c   1TNt ), t   5
Observational approach

                                              Partial residual plot of bloom
Population size and N:P on bloom phase data   phase growth rate model
Observational approach

• Toxic algal blooms have two distinct dynamic
  phases, a pattern observed across years and
  genera.

• N:P important in the bloom phase, but not the
  decline, i.e. nutrients don’t always matter.

• Capturing the dynamics of a bloom are important.
  i.e. if correlating N:P with populations, depending
  when samples are taken you may get different
  results
Conclusions
• Populations can be understood from both
  experimental and observational data

• Population dynamic models provide a deeper
  understanding of changes in abundance and
  correlation with environmental variables.
     • Dynamic models showed how climate change alters different aspects
       of population processes depending on the taxa and its life history,
       which in turn drive abundance.

     • Dynamic models of observational data elucidated relationships
       between environmental covariates and population growth rates that
       otherwise are missed by simple regression on abundances.
Acknowledgements
Committee Members              Funding
Nick Gotelli                   Vermont EPSCoR
Alison Brody                   NSF
Sara Cahan
Brian Beckage

Jericho forest
David Brynn
Don Tobi

Undergraduate field assistants
Chris Graves
Cyrus Mallon (University of Groningen)          My faithful field companion,
                                                Tuesday. General helper and
Co-Authors on the plankton manuscript           protector from squirrels and the
Nick Gotelli                                    occasional bear
Rebecca Gorney
Mary Watzin
Understanding natural populations with dynamic models

Mais conteúdo relacionado

Semelhante a Understanding natural populations with dynamic models

IJCER (www.ijceronline.com) International Journal of computational Engineeri...
 IJCER (www.ijceronline.com) International Journal of computational Engineeri... IJCER (www.ijceronline.com) International Journal of computational Engineeri...
IJCER (www.ijceronline.com) International Journal of computational Engineeri...ijceronline
 
Color Img at Prisma Network meeting 2009
Color Img at Prisma Network meeting 2009Color Img at Prisma Network meeting 2009
Color Img at Prisma Network meeting 2009Juan Luis Nieves
 
Dissertation Slides
Dissertation SlidesDissertation Slides
Dissertation SlidesSanghui Ahn
 
Homogenized trigonal models for biomechanical applications description copia
Homogenized trigonal models for biomechanical applications description copiaHomogenized trigonal models for biomechanical applications description copia
Homogenized trigonal models for biomechanical applications description copiaMarco Ciervo
 
Neutral Electronic Excitations: a Many-body approach to the optical absorptio...
Neutral Electronic Excitations: a Many-body approach to the optical absorptio...Neutral Electronic Excitations: a Many-body approach to the optical absorptio...
Neutral Electronic Excitations: a Many-body approach to the optical absorptio...Claudio Attaccalite
 
Meteocast: a real time nowcasting system
Meteocast: a real time nowcasting systemMeteocast: a real time nowcasting system
Meteocast: a real time nowcasting systemAlessandro Staniscia
 
extreme times in finance heston model.ppt
extreme times in finance heston model.pptextreme times in finance heston model.ppt
extreme times in finance heston model.pptArounaGanou2
 
Pre and Post fire vegetation behavioral trends from satellite MODIS/NDVI time...
Pre and Post fire vegetation behavioral trends from satellite MODIS/NDVI time...Pre and Post fire vegetation behavioral trends from satellite MODIS/NDVI time...
Pre and Post fire vegetation behavioral trends from satellite MODIS/NDVI time...Beniamino Murgante
 
Challenges in predicting weather and climate extremes
Challenges in predicting weather and climate extremesChallenges in predicting weather and climate extremes
Challenges in predicting weather and climate extremesIC3Climate
 
Lecture pressure 2012
Lecture pressure 2012Lecture pressure 2012
Lecture pressure 2012Lorenzo Mazza
 
New Mathematical Tools for the Financial Sector
New Mathematical Tools for the Financial SectorNew Mathematical Tools for the Financial Sector
New Mathematical Tools for the Financial SectorSSA KPI
 
20-12-11 PhD Day Turin
20-12-11 PhD Day Turin20-12-11 PhD Day Turin
20-12-11 PhD Day TurinFabioDiRienzo
 
The translucent and yellow gummy latex of mangosteen by using the vfss measur...
The translucent and yellow gummy latex of mangosteen by using the vfss measur...The translucent and yellow gummy latex of mangosteen by using the vfss measur...
The translucent and yellow gummy latex of mangosteen by using the vfss measur...Alexander Decker
 
Non-linear optics by means of dynamical Berry phase
Non-linear optics  by means of  dynamical Berry phaseNon-linear optics  by means of  dynamical Berry phase
Non-linear optics by means of dynamical Berry phaseClaudio Attaccalite
 
05Seuntjens-MonteCarloIntro.pdf
05Seuntjens-MonteCarloIntro.pdf05Seuntjens-MonteCarloIntro.pdf
05Seuntjens-MonteCarloIntro.pdfNishant835443
 
Tachyon inflation in DBI and RSII context
Tachyon inflation in DBI and RSII contextTachyon inflation in DBI and RSII context
Tachyon inflation in DBI and RSII contextMilan Milošević
 
Lecture 8 populations and logistic growth (1)
Lecture 8 populations and logistic growth (1)Lecture 8 populations and logistic growth (1)
Lecture 8 populations and logistic growth (1)sarahlouvaughn
 

Semelhante a Understanding natural populations with dynamic models (20)

IJCER (www.ijceronline.com) International Journal of computational Engineeri...
 IJCER (www.ijceronline.com) International Journal of computational Engineeri... IJCER (www.ijceronline.com) International Journal of computational Engineeri...
IJCER (www.ijceronline.com) International Journal of computational Engineeri...
 
Color Img at Prisma Network meeting 2009
Color Img at Prisma Network meeting 2009Color Img at Prisma Network meeting 2009
Color Img at Prisma Network meeting 2009
 
Dissertation Slides
Dissertation SlidesDissertation Slides
Dissertation Slides
 
Homogenized trigonal models for biomechanical applications description copia
Homogenized trigonal models for biomechanical applications description copiaHomogenized trigonal models for biomechanical applications description copia
Homogenized trigonal models for biomechanical applications description copia
 
Neutral Electronic Excitations: a Many-body approach to the optical absorptio...
Neutral Electronic Excitations: a Many-body approach to the optical absorptio...Neutral Electronic Excitations: a Many-body approach to the optical absorptio...
Neutral Electronic Excitations: a Many-body approach to the optical absorptio...
 
PhD defense talk slides
PhD  defense talk slidesPhD  defense talk slides
PhD defense talk slides
 
Meteocast: a real time nowcasting system
Meteocast: a real time nowcasting systemMeteocast: a real time nowcasting system
Meteocast: a real time nowcasting system
 
extreme times in finance heston model.ppt
extreme times in finance heston model.pptextreme times in finance heston model.ppt
extreme times in finance heston model.ppt
 
Pre and Post fire vegetation behavioral trends from satellite MODIS/NDVI time...
Pre and Post fire vegetation behavioral trends from satellite MODIS/NDVI time...Pre and Post fire vegetation behavioral trends from satellite MODIS/NDVI time...
Pre and Post fire vegetation behavioral trends from satellite MODIS/NDVI time...
 
Challenges in predicting weather and climate extremes
Challenges in predicting weather and climate extremesChallenges in predicting weather and climate extremes
Challenges in predicting weather and climate extremes
 
SmithOSM20160226
SmithOSM20160226SmithOSM20160226
SmithOSM20160226
 
Lecture pressure 2012
Lecture pressure 2012Lecture pressure 2012
Lecture pressure 2012
 
New Mathematical Tools for the Financial Sector
New Mathematical Tools for the Financial SectorNew Mathematical Tools for the Financial Sector
New Mathematical Tools for the Financial Sector
 
20-12-11 PhD Day Turin
20-12-11 PhD Day Turin20-12-11 PhD Day Turin
20-12-11 PhD Day Turin
 
The translucent and yellow gummy latex of mangosteen by using the vfss measur...
The translucent and yellow gummy latex of mangosteen by using the vfss measur...The translucent and yellow gummy latex of mangosteen by using the vfss measur...
The translucent and yellow gummy latex of mangosteen by using the vfss measur...
 
Aem Lect5
Aem Lect5Aem Lect5
Aem Lect5
 
Non-linear optics by means of dynamical Berry phase
Non-linear optics  by means of  dynamical Berry phaseNon-linear optics  by means of  dynamical Berry phase
Non-linear optics by means of dynamical Berry phase
 
05Seuntjens-MonteCarloIntro.pdf
05Seuntjens-MonteCarloIntro.pdf05Seuntjens-MonteCarloIntro.pdf
05Seuntjens-MonteCarloIntro.pdf
 
Tachyon inflation in DBI and RSII context
Tachyon inflation in DBI and RSII contextTachyon inflation in DBI and RSII context
Tachyon inflation in DBI and RSII context
 
Lecture 8 populations and logistic growth (1)
Lecture 8 populations and logistic growth (1)Lecture 8 populations and logistic growth (1)
Lecture 8 populations and logistic growth (1)
 

Último

How to Troubleshoot Apps for the Modern Connected Worker
How to Troubleshoot Apps for the Modern Connected WorkerHow to Troubleshoot Apps for the Modern Connected Worker
How to Troubleshoot Apps for the Modern Connected WorkerThousandEyes
 
Elevate Developer Efficiency & build GenAI Application with Amazon Q​
Elevate Developer Efficiency & build GenAI Application with Amazon Q​Elevate Developer Efficiency & build GenAI Application with Amazon Q​
Elevate Developer Efficiency & build GenAI Application with Amazon Q​Bhuvaneswari Subramani
 
DBX First Quarter 2024 Investor Presentation
DBX First Quarter 2024 Investor PresentationDBX First Quarter 2024 Investor Presentation
DBX First Quarter 2024 Investor PresentationDropbox
 
Apidays New York 2024 - Accelerating FinTech Innovation by Vasa Krishnan, Fin...
Apidays New York 2024 - Accelerating FinTech Innovation by Vasa Krishnan, Fin...Apidays New York 2024 - Accelerating FinTech Innovation by Vasa Krishnan, Fin...
Apidays New York 2024 - Accelerating FinTech Innovation by Vasa Krishnan, Fin...apidays
 
WSO2's API Vision: Unifying Control, Empowering Developers
WSO2's API Vision: Unifying Control, Empowering DevelopersWSO2's API Vision: Unifying Control, Empowering Developers
WSO2's API Vision: Unifying Control, Empowering DevelopersWSO2
 
Why Teams call analytics are critical to your entire business
Why Teams call analytics are critical to your entire businessWhy Teams call analytics are critical to your entire business
Why Teams call analytics are critical to your entire businesspanagenda
 
Rising Above_ Dubai Floods and the Fortitude of Dubai International Airport.pdf
Rising Above_ Dubai Floods and the Fortitude of Dubai International Airport.pdfRising Above_ Dubai Floods and the Fortitude of Dubai International Airport.pdf
Rising Above_ Dubai Floods and the Fortitude of Dubai International Airport.pdfOrbitshub
 
Polkadot JAM Slides - Token2049 - By Dr. Gavin Wood
Polkadot JAM Slides - Token2049 - By Dr. Gavin WoodPolkadot JAM Slides - Token2049 - By Dr. Gavin Wood
Polkadot JAM Slides - Token2049 - By Dr. Gavin WoodJuan lago vázquez
 
Strategize a Smooth Tenant-to-tenant Migration and Copilot Takeoff
Strategize a Smooth Tenant-to-tenant Migration and Copilot TakeoffStrategize a Smooth Tenant-to-tenant Migration and Copilot Takeoff
Strategize a Smooth Tenant-to-tenant Migration and Copilot Takeoffsammart93
 
TrustArc Webinar - Unlock the Power of AI-Driven Data Discovery
TrustArc Webinar - Unlock the Power of AI-Driven Data DiscoveryTrustArc Webinar - Unlock the Power of AI-Driven Data Discovery
TrustArc Webinar - Unlock the Power of AI-Driven Data DiscoveryTrustArc
 
AWS Community Day CPH - Three problems of Terraform
AWS Community Day CPH - Three problems of TerraformAWS Community Day CPH - Three problems of Terraform
AWS Community Day CPH - Three problems of TerraformAndrey Devyatkin
 
Artificial Intelligence Chap.5 : Uncertainty
Artificial Intelligence Chap.5 : UncertaintyArtificial Intelligence Chap.5 : Uncertainty
Artificial Intelligence Chap.5 : UncertaintyKhushali Kathiriya
 
Navigating the Deluge_ Dubai Floods and the Resilience of Dubai International...
Navigating the Deluge_ Dubai Floods and the Resilience of Dubai International...Navigating the Deluge_ Dubai Floods and the Resilience of Dubai International...
Navigating the Deluge_ Dubai Floods and the Resilience of Dubai International...Orbitshub
 
DEV meet-up UiPath Document Understanding May 7 2024 Amsterdam
DEV meet-up UiPath Document Understanding May 7 2024 AmsterdamDEV meet-up UiPath Document Understanding May 7 2024 Amsterdam
DEV meet-up UiPath Document Understanding May 7 2024 AmsterdamUiPathCommunity
 
FWD Group - Insurer Innovation Award 2024
FWD Group - Insurer Innovation Award 2024FWD Group - Insurer Innovation Award 2024
FWD Group - Insurer Innovation Award 2024The Digital Insurer
 
MINDCTI Revenue Release Quarter One 2024
MINDCTI Revenue Release Quarter One 2024MINDCTI Revenue Release Quarter One 2024
MINDCTI Revenue Release Quarter One 2024MIND CTI
 
Repurposing LNG terminals for Hydrogen Ammonia: Feasibility and Cost Saving
Repurposing LNG terminals for Hydrogen Ammonia: Feasibility and Cost SavingRepurposing LNG terminals for Hydrogen Ammonia: Feasibility and Cost Saving
Repurposing LNG terminals for Hydrogen Ammonia: Feasibility and Cost SavingEdi Saputra
 
Biography Of Angeliki Cooney | Senior Vice President Life Sciences | Albany, ...
Biography Of Angeliki Cooney | Senior Vice President Life Sciences | Albany, ...Biography Of Angeliki Cooney | Senior Vice President Life Sciences | Albany, ...
Biography Of Angeliki Cooney | Senior Vice President Life Sciences | Albany, ...Angeliki Cooney
 
Finding Java's Hidden Performance Traps @ DevoxxUK 2024
Finding Java's Hidden Performance Traps @ DevoxxUK 2024Finding Java's Hidden Performance Traps @ DevoxxUK 2024
Finding Java's Hidden Performance Traps @ DevoxxUK 2024Victor Rentea
 

Último (20)

How to Troubleshoot Apps for the Modern Connected Worker
How to Troubleshoot Apps for the Modern Connected WorkerHow to Troubleshoot Apps for the Modern Connected Worker
How to Troubleshoot Apps for the Modern Connected Worker
 
Elevate Developer Efficiency & build GenAI Application with Amazon Q​
Elevate Developer Efficiency & build GenAI Application with Amazon Q​Elevate Developer Efficiency & build GenAI Application with Amazon Q​
Elevate Developer Efficiency & build GenAI Application with Amazon Q​
 
DBX First Quarter 2024 Investor Presentation
DBX First Quarter 2024 Investor PresentationDBX First Quarter 2024 Investor Presentation
DBX First Quarter 2024 Investor Presentation
 
Apidays New York 2024 - Accelerating FinTech Innovation by Vasa Krishnan, Fin...
Apidays New York 2024 - Accelerating FinTech Innovation by Vasa Krishnan, Fin...Apidays New York 2024 - Accelerating FinTech Innovation by Vasa Krishnan, Fin...
Apidays New York 2024 - Accelerating FinTech Innovation by Vasa Krishnan, Fin...
 
WSO2's API Vision: Unifying Control, Empowering Developers
WSO2's API Vision: Unifying Control, Empowering DevelopersWSO2's API Vision: Unifying Control, Empowering Developers
WSO2's API Vision: Unifying Control, Empowering Developers
 
Why Teams call analytics are critical to your entire business
Why Teams call analytics are critical to your entire businessWhy Teams call analytics are critical to your entire business
Why Teams call analytics are critical to your entire business
 
+971581248768>> SAFE AND ORIGINAL ABORTION PILLS FOR SALE IN DUBAI AND ABUDHA...
+971581248768>> SAFE AND ORIGINAL ABORTION PILLS FOR SALE IN DUBAI AND ABUDHA...+971581248768>> SAFE AND ORIGINAL ABORTION PILLS FOR SALE IN DUBAI AND ABUDHA...
+971581248768>> SAFE AND ORIGINAL ABORTION PILLS FOR SALE IN DUBAI AND ABUDHA...
 
Rising Above_ Dubai Floods and the Fortitude of Dubai International Airport.pdf
Rising Above_ Dubai Floods and the Fortitude of Dubai International Airport.pdfRising Above_ Dubai Floods and the Fortitude of Dubai International Airport.pdf
Rising Above_ Dubai Floods and the Fortitude of Dubai International Airport.pdf
 
Polkadot JAM Slides - Token2049 - By Dr. Gavin Wood
Polkadot JAM Slides - Token2049 - By Dr. Gavin WoodPolkadot JAM Slides - Token2049 - By Dr. Gavin Wood
Polkadot JAM Slides - Token2049 - By Dr. Gavin Wood
 
Strategize a Smooth Tenant-to-tenant Migration and Copilot Takeoff
Strategize a Smooth Tenant-to-tenant Migration and Copilot TakeoffStrategize a Smooth Tenant-to-tenant Migration and Copilot Takeoff
Strategize a Smooth Tenant-to-tenant Migration and Copilot Takeoff
 
TrustArc Webinar - Unlock the Power of AI-Driven Data Discovery
TrustArc Webinar - Unlock the Power of AI-Driven Data DiscoveryTrustArc Webinar - Unlock the Power of AI-Driven Data Discovery
TrustArc Webinar - Unlock the Power of AI-Driven Data Discovery
 
AWS Community Day CPH - Three problems of Terraform
AWS Community Day CPH - Three problems of TerraformAWS Community Day CPH - Three problems of Terraform
AWS Community Day CPH - Three problems of Terraform
 
Artificial Intelligence Chap.5 : Uncertainty
Artificial Intelligence Chap.5 : UncertaintyArtificial Intelligence Chap.5 : Uncertainty
Artificial Intelligence Chap.5 : Uncertainty
 
Navigating the Deluge_ Dubai Floods and the Resilience of Dubai International...
Navigating the Deluge_ Dubai Floods and the Resilience of Dubai International...Navigating the Deluge_ Dubai Floods and the Resilience of Dubai International...
Navigating the Deluge_ Dubai Floods and the Resilience of Dubai International...
 
DEV meet-up UiPath Document Understanding May 7 2024 Amsterdam
DEV meet-up UiPath Document Understanding May 7 2024 AmsterdamDEV meet-up UiPath Document Understanding May 7 2024 Amsterdam
DEV meet-up UiPath Document Understanding May 7 2024 Amsterdam
 
FWD Group - Insurer Innovation Award 2024
FWD Group - Insurer Innovation Award 2024FWD Group - Insurer Innovation Award 2024
FWD Group - Insurer Innovation Award 2024
 
MINDCTI Revenue Release Quarter One 2024
MINDCTI Revenue Release Quarter One 2024MINDCTI Revenue Release Quarter One 2024
MINDCTI Revenue Release Quarter One 2024
 
Repurposing LNG terminals for Hydrogen Ammonia: Feasibility and Cost Saving
Repurposing LNG terminals for Hydrogen Ammonia: Feasibility and Cost SavingRepurposing LNG terminals for Hydrogen Ammonia: Feasibility and Cost Saving
Repurposing LNG terminals for Hydrogen Ammonia: Feasibility and Cost Saving
 
Biography Of Angeliki Cooney | Senior Vice President Life Sciences | Albany, ...
Biography Of Angeliki Cooney | Senior Vice President Life Sciences | Albany, ...Biography Of Angeliki Cooney | Senior Vice President Life Sciences | Albany, ...
Biography Of Angeliki Cooney | Senior Vice President Life Sciences | Albany, ...
 
Finding Java's Hidden Performance Traps @ DevoxxUK 2024
Finding Java's Hidden Performance Traps @ DevoxxUK 2024Finding Java's Hidden Performance Traps @ DevoxxUK 2024
Finding Java's Hidden Performance Traps @ DevoxxUK 2024
 

Understanding natural populations with dynamic models

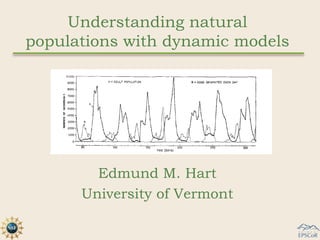
  • 1. Understanding natural populations with dynamic models Edmund M. Hart University of Vermont
  • 2. The beginning Charles Elton 1900-1991 A. J. Nicholson 1895-1969
  • 3. The beginning H. G. Andrewartha 1907-1992 L. Charles Birch The logarithm of the average population size per month for 1918-2009 several years in the study of Thrips imaginis
  • 4. The unanswered question A. J. Nicholson Charles Elton 1895-1969 1900-1991 How can we fit experimental and observational data to population dynamic models in order to understand what regulates populations? H. G. Andrewartha 1907-1992 L. Charles Birch 1918-2009
  • 5. First principles N B D N B D rt Nt 1 Nt 1
  • 6. First principles N B D Nt rt ln Nt 1 Nt 1 Nt 1 Nt Nt 1 rt N t 1
  • 7. First principles Nt Nt 1 rt N t 1 rt f ( N , environment , competitors, etc...)
  • 8. Mathematical Framework Three basic types of population growth Random Walk rt 0 N (0, 2 ) Exponential Growth rt r0 N (0, 2 ) Logistic Growth (Ricker form rt r0 N t 1 exp(c) Ν( 0 ,σ 2 ) shown)
  • 9. Mathematical Framework Random walk Density dependent Exponential
  • 10. Mathematical Framework Random walk Density dependent Exponential
  • 11. Mathematical Framework Vertical shift rt f ( N t 1 ) g ( zt )
  • 12. Mathematical Framework Lateral shift rt f ( Nt 1 zt )
  • 13. Testing hypotheses Two methods:  Carry out experiments and test how populations change over parameter space  Fit models to observational data
  • 14. Experimental approach How can expected changes in the mean and variance of an environmental factor caused by climate change alter population processes in aquatic communities?
  • 17. Experimental approach Surface response 7 Levels of Water Variation 7 Levels of Water mean depth Fully crossed for 49 tubs Means (cm): 6.6,9.9,13.2, 16.5,19.8, 23.1, 26.4 Coeffecients of Variation (C.V.): 0,.1,.2,.3,.4,.5,.6
  • 18. Experimental approach Mean Water Level Low water level, high CV High water level, high CV Water C.V. High water level, low CV Low water level, low CV
  • 21. Experimental approach Mosquitoes Midges
  • 22. Experimental approach ymn 0 1 MWL WCV 2 3 MWL *WCV mn β1 (p<0.05) R2=0.27 β2 (p<0.05) β3 (p<0.05) R2=0.49
  • 23. Experimental approach 2 jk Growth rate, same as r0 rtjk ~ N ( jk jk X [t 1] jk , r ) jk Strength of density dependence X [t 1] jk Log abundance jk Grand mean Effect of mean water level jk Effect of water level CV U A vector of 0’s of length 2 B j ~ MVN (U , B ) B A 2x2 variance covariance matrix
  • 24. Experimental approach Growth rate Density dependence Estimates of the Gompertz logistic (GL) parameters for each treatment combination for growth rate and density dependence in Culicidae and Chironomidae. Darker squares indicate either higher population growth rate or stronger density dependence.
  • 25. Experimental approach Growth rate Density dependence
  • 26. Experimental approach • The mean and variance of pond hydrological process impacts larval abundance in opposing directions • Abundances change due to alterations in population dynamic parameters  Changes in intrinsic rate of increase in mosquitoes probably due to female oviposition choice  Density dependent effects in midges most likely caused by competition for space
  • 27. Observational approach Using monitoring data, how can we understand what controls toxic algal bloom population dynamics in Missisquoi Bay?
  • 30. Observational approach Microcystis Anabaena
  • 31. Observational approach The nutrients The competitors Chlorophyceae (green algae) Bacillariophyceae (diatoms) TP SRP TN TN TP Cryptophyceae
  • 32. Observational approach Toxic algal blooms in Missisquoi Bay 2003 - 2006 • Data is from the Rubenstein Ecosystems Science Laboratory’s toxic algal bloom monitoring program • Data from dominant taxa (Microcystis 2003-2005, Anabaena 2006) • Averaged across all sites within Missisquoi bay for each year • Included only sites that had ancillary nutrient data
  • 33. Observational approach Nt Nt 1 rt N t 1 rt f ( Nt 1 , Nt 2 ...Nt d ) g ( Et , Et 1...Et d ) h(C1t 1 C1t 2...C1t d )
  • 34. Observational approach Exogenous drivers rt f ( Nt 1 , Nt 2 ...Nt d ) g ( Et , Et 1...Et d ) h(C1t 1 C1t 2...C1t d ) f ( N t d ) r0 N t 1 exp( c) g ( Et d ) E 1 t d h(C1t d ) C1t 1 d Ricker logistic growth Linear Linear
  • 35. Observational approach rt f ( Nt 1 , Nt 2 ...Nt d ) g ( Et , Et 1...Et d ) h(C1t 1 C1t 2...C1t d ) f ( N t d ) r0 N t 1 exp( c) g ( Et d ) E 1 t d h(C1t d ) C1t 1 d rt r0 N t 1 exp( c) 1 Et d rt r0 N t 1 exp( c 1 Et d ) rt r0 N t 1 exp( c C1t d ) 1
  • 36. Observational approach We fit 29 different models from the following: Random walk / Density dependent Environmental factors Competitors exponential growth (endogenous factors) rt r0 rt r0 N t 1 exp( c) rt r0 N t 1 exp( c) 1 Et rt r0 N t 1 exp( c C1t 1 ) 1 rt r0 N t 1 exp( c) 1 Et 1 rt r0 N t 1 exp( c 1 Et ) rt r0 N t 1 exp( c 1 Et 1 ) rt r0 1 Et rt r0 E 1 t 1 Assessed model fit with AICc (AIC + 2K(K+1)/n-K-1)
  • 37. Observational approach Growth rates of toxic algal blooms in Missisquoi Bay 2003 - 2006
  • 38. Observational approach Growth rates of toxic algal blooms in Missisquoi Bay 2003 - 2006
  • 39. Observational approach 2004 Microcystis
  • 40. Observational approach 2003 Microcystis 2005 Microcystis 2006 Anabaena 2004 Microcystis Julian Day
  • 41. Observational approach Julian Growth Microcystis Microcystis Day Rate (cells/ml) Julian Day (cells/ml) 182 2.54 3667.88 182 3667.883 188 0.65 46381.51 188 46381.514 195 0.23 89095.14 195 89095.144 203 -1.28 111960.54 203 111960.543 210 -0.45 31070.73 210 31070.727 217 -0.19 19824.80 217 19824.800 224 0.52 16395.25 224 16395.252 231 -0.05 27626.31 231 27626.305 238 0.52 26363.80 238 26363.801 247 -0.48 44301.53 247 44301.534 252 0.47 27541.29 252 27541.291 259 -0.99 43930.60 259 43930.596 267 -0.01 16324.47 267 16324.465 273 -0.93 16104.06 273 16104.062 280 0.35 6366.31 280 6366.310 287 9052.005
  • 42. Observational approach AICc ∆AICc AIC R2 Model weight TN t 33.1 0 0.63 0.8 rt r0 N t 1 exp( c) 1 TPt 38.3 5.2 0.04 0.71 rt r0 N t 1 exp( c) TPt 1 38.4 5.3 0.04 0.64 rt r0 N t 1 exp( c) 38.9 5.8 0.03 0.7 rt r0 N t 1 exp( c) 1TN t 1 38.9 5.8 0.03 0.7 rt r0 N t 1 exp( c) 1 SRPt 1 TN t rt 0.28 N t 1 exp( 10 .8) 0.08 TPt
  • 43. Decline phase dynamics AICc ∆AICc AIC R2 Model weight rt r0 N t 1 exp( c TN t ) 78.8 0 0.21 0.18 1 81.2 2.4 0.06 - rt r0 81.4 2.6 0.06 0.13 rt r0 N t 1 exp( c TPt ) 1 81.6 2.8 0.05 0.12 rt r0 N t 1 exp( c 1 Crt 1 ) rt r0 N t 1 exp( c) 81.7 2.9 0.05 0.04 * Cr = Cryptophyceae rt 0.12 N t 1 exp( 7.05 33 .1* TN t )
  • 44. Two phase growth Growth rates of toxic algal blooms in Missisquoi Bay 2003 - 2006 TNt r0 Nt 1 exp(c) 1 ,t 5 rt TPt r0 Nt 1 exp(c 1TNt ), t 5
  • 45. Observational approach Partial residual plot of bloom Population size and N:P on bloom phase data phase growth rate model
  • 46. Observational approach • Toxic algal blooms have two distinct dynamic phases, a pattern observed across years and genera. • N:P important in the bloom phase, but not the decline, i.e. nutrients don’t always matter. • Capturing the dynamics of a bloom are important. i.e. if correlating N:P with populations, depending when samples are taken you may get different results
  • 47. Conclusions • Populations can be understood from both experimental and observational data • Population dynamic models provide a deeper understanding of changes in abundance and correlation with environmental variables. • Dynamic models showed how climate change alters different aspects of population processes depending on the taxa and its life history, which in turn drive abundance. • Dynamic models of observational data elucidated relationships between environmental covariates and population growth rates that otherwise are missed by simple regression on abundances.
  • 48. Acknowledgements Committee Members Funding Nick Gotelli Vermont EPSCoR Alison Brody NSF Sara Cahan Brian Beckage Jericho forest David Brynn Don Tobi Undergraduate field assistants Chris Graves Cyrus Mallon (University of Groningen) My faithful field companion, Tuesday. General helper and Co-Authors on the plankton manuscript protector from squirrels and the Nick Gotelli occasional bear Rebecca Gorney Mary Watzin