Real Estate Market Overview: Corpus Christi
•
1 gostou•981 visualizações

Texas real estate market overview provided by the Texas A&M Real Estate Research Center. For Corpus Christi, which is on the gulf coast. NOTE: Full-sized view or download is optimal.

Recomendados
Mais conteúdo relacionado
Mais de Dee Patience
Último
Último (20)
Real Estate Market Overview: Corpus Christi
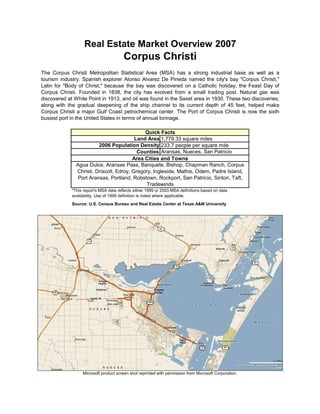
- 1. Real Estate Market Overview 2007 Corpus Christi The Corpus Christi Metropolitan Statistical Area (MSA) has a strong industrial base as well as a tourism industry. Spanish explorer Alonso Alvarez De Pineda named the city's bay quot;Corpus Christi,quot; Latin for quot;Body of Christ,quot; because the bay was discovered on a Catholic holiday, the Feast Day of Corpus Christi. Founded in 1838, the city has evolved from a small trading post. Natural gas was discovered at White Point in 1913, and oil was found in the Saxet area in 1930. These two discoveries, along with the gradual deepening of the ship channel to its current depth of 45 feet, helped make Corpus Christi a major Gulf Coast petrochemical center. The Port of Corpus Christi is now the sixth busiest port in the United States in terms of annual tonnage. Quick Facts Land Area 1,779.33 square miles 2006 Population Density 233.7 people per square mile Counties Aransas, Nueces, San Patricio Area Cities and Towns Agua Dulce, Aransas Pass, Banquete, Bishop, Chapman Ranch, Corpus Christi, Driscoll, Edroy, Gregory, Ingleside, Mathis, Odem, Padre Island, Port Aransas, Portland, Robstown, Rockport, San Patricio, Sinton, Taft, Tradewinds *This report's MSA data reflects either 1999 or 2003 MSA definitions based on data availability. Use of 1999 definition is noted where applicable. Source: U.S. Census Bureau and Real Estate Center at Texas A&M University Microsoft product screen shot reprinted with permission from Microsoft Corporation.
- 2. Metropolitan Statistical Areas (MSAs) DALLAM SHERMAN HANSFORD OCHILTREE LIPSCOMB HUTCHINSON HARTLEY MOORE ROBERTS HEMPHILL 2 CARSON POTTER WHEELER OLDHAM GRAY RANDALL ARMSTRONG DONLEY COLLINGSWORTH DEAF SMITH BRISCOE PARMER CASTRO SWISHER HALL CHILDRESS HARDEMAN WICHITA 25 BAILEY LAMB HALE FLOYD MOTLEY COTTLE WILBARGER FOARD 14 20 GRAYSON CLAY 21 LAMAR ARCHER MONTAGUE COOKE RED RIVER FANNIN COCHRAN HOCKLEY DICKENS KING KNOX BAYLOR LUBBOCK CROSBY BOWIE DELTA FRANKLIN WISE DENTON COLLIN HUNT JACK TITUS YOAKUM TERRY LYNN GARZA KENT STONEWALL HASKELL THROCKMORTON YOUNG HOPKINS 8 MORRIS CASS CAMP ROCKWALL RAINS PARKER WOOD UPSHUR MARION JONES SHACKLEFORD DALLAS TARRANT 1 GAINES DAWSON BORDEN SCURRY FISHER STEPHENS PALO PINTO KAUFMAN 22 13 GREGG SMITH HARRISON VAN ZANDT JOHNSON HOOD ELLIS CALLAHAN EASTLAND ANDREWS MARTIN HOWARD MITCHELL NOLAN TAYLOR ERATH SOMERVELL HENDERSON 17 16 PANOLA RUSK 9 NAVARRO HILL EL PASO 24 COMANCHE CHEROKEE BOSQUE STERLING COKE LOVING RUNNELS WINKLER ANDERSON ECTOR MIDLAND COLEMAN BROWN SHELBY FREESTONE 18 HAMILTON GLASSCOCK MCLENNAN CORYELL NACOGDOCHES MILLS LIMESTONE 11 SAN CULBERSON WARD HUDSPETH CRANE AUGUSTINE UPTON REAGAN HOUSTON SABINE CONCHO LEON TOM GREEN LAMPASAS IRION FALLS REEVES ANGELINA MCCULLOCH SAN SABA ROBERTSON 6 BELL TRINITY MADISON JASPER NEWTON MENARD SCHLEICHER POLK BURNET TYLER MILAM PECOS WALKER BRAZOS JEFF DAVIS CROCKETT MASON LLANO SAN WILLIAMSON JACINTO BURLESON KIMBLE 4 SUTTON HARDIN 3 GRIMES TRAVIS MONTGOMERY GILLESPIE LEE BLANCO ORANGE TERRELL WASHINGTON LIBERTY 10 BASTROP JEFFERSON KERR HAYS AUSTIN PRESIDIO WALLER EDWARDS VAL VERDE CHAMBERS REAL KENDALL FAYETTE BREWSTER CALDWELL HARRIS COMAL BANDERA FORT BEND COLORADO 19 GUADALUPE GALVESTON GONZALES KINNEY LAVACA UVALDE MEDINA BRAZORIA WHARTON BEXAR 23 WILSON DE WITT JACKSON FRIO MATAGORDA ZAVALA KARNES MAVERICK ATASCOSA VICTORIA GOLIAD CALHOUN DIMMIT BEE REFUGIO MCMULLEN LA SALLE ARANSAS LIVE OAK 7 12 SAN PATRICIO JIM WELLS NUECES 1. Abilene 14. Lubbock DUVAL WEBB KLEBERG 2. Amarillo 15. McAllen-Edinburg-Mission 3. Austin-Round Rock 16. Midland JIM HOGG ZAPATA BROOKS KENEDY 4. Beaumont-Port Arthur 17. Odessa 15 5. Brownsville-Harlingen 18. San Angelo STARR WILLACY 6. College Station-Bryan 19. San Antonio HIDALGO 5 CAMERON 7. Corpus Christi 20. Sherman-Denison 8. Dallas-Fort Worth-Arlington 21. Texarkana 9. El Paso 22. Tyler 10. Houston-Sugar Land-Baytown 23. Victoria 11. Killeen-Temple-Fort Hood 24. Waco 12. Laredo 25. Wichita Falls 13. Longview Prepared by the Labor Market and Career Information Department, TWC Edited by Real Estate Center at Texas A&M University
- 3. Table of Contents Demographics ..............................................................................................1 Education .....................................................................................................4 Employment .................................................................................................5 Economy ....................................................................................................10 Infrastructure ..............................................................................................11 Public Facilities ..........................................................................................12 Multifamily ..................................................................................................13 Housing ......................................................................................................15 Retail ..........................................................................................................21 Hotel...........................................................................................................22 Office..........................................................................................................23 Industrial ....................................................................................................25
- 4. Real Estate Center Market Overview 2007 Corpus Christi, TX Corpus Christi Market Overview 2007 Demographics Corpus Christi MSA Population Percent Change Year Population - 1996 398,529 1.0 1997 402,504 0.3 1998 403,818 0.1 1999 404,155 -0.2 2000 403,280 -0.3 2001 402,105 0.6 2002 404,400 0.4 2003 405,916 0.9 2004 409,645 1.0 2005 413,553 0.5 2006 415,810 * July 1 population estimates Source: U.S. Census Bureau County Population* Growth Growth 1996-2006 (in County 1996 2006 percent) Aransas 21,239 24,831 16.9 312,762 Nueces 321,457 2.8 64,528 San Patricio 69,522 7.7 * July 1 population estimates Source: U.S. Census Bureau 1
- 5. Real Estate Center Market Overview 2007 Corpus Christi, TX Texas Metropolitan Area Population* Change Percent Metropolitan Area 1996 2006 Change Austin-Round Rock 1,073,037 1,513,565 41.1 McAllen-Edinburg-Mission 503,411 700,634 39.2 Laredo 171,583 231,470 34.9 Dallas-Fort Worth-Arlington 4,627,649 6,003,967 29.7 Houston-Sugar Land-Baytown 4,334,020 5,539,949 27.8 Brownsville-Harlingen 312,086 387,717 24.2 San Antonio 1,599,427 1,942,217 21.4 Texas 19,340,342 22,859,968 18.2 Tyler 166,087 194,635 17.2 Sherman-Denison 102,993 118,478 15.0 El Paso 656,482 736,310 12.2 College Station-Bryan 172,341 192,152 11.5 Amarillo 217,579 241,515 11.0 Killeen-Temple-Fort Hood 318,613 351,322 10.3 Waco 205,894 226,189 9.9 Midland 114,412 124,380 8.7 Longview 190,556 203,367 6.7 Lubbock 247,099 261,411 5.8 Texarkana 127,694 134,510 5.3 Victoria 108,636 114,088 5.0 Odessa 121,519 127,462 4.9 Corpus Christi 398,529 415,810 4.3 San Angelo 104,574 105,752 1.1 Abilene 156,351 158,063 1.1 Beaumont-Port Arthur 380,417 379,640 -0.2 Wichita Falls 151,170 145,528 -3.7 * July 1 population estimates Source: U.S. Census Bureau Corpus Christi MSA Projected Population Texas State Data Center Texas Water Development Year (Scenario 0.5) Board 403,280 2000 403,280 430,952 2005 - 460,846 2010 465,842 489,651 2015 - 516,695 2020 531,477 541,676 2025 - 564,933 2030 589,092 586,557 2035 - 606,132 2040 638,440 Sources: Texas State Data Center (2006 projection) and Texas Water Development Board (2006 projection) 2
- 6. Real Estate Center Market Overview 2007 Corpus Christi, TX Texas Metropolitan Area Population Growth Forecast, 2000 - 2020 Texarkana Wichita Falls Beaumont-Port Arthur Abilene San Angelo Sherman-Denison Longview Lubbock Midland Tyler Waco Odessa Victoria College Station-Bryan Amarillo San Antonio Corpus Christi Texas Killeen-Temple-Fort Hood Houston-Sugar Land-Baytown El Paso Dallas-Fort Worth-Arlington Brownsville-Harlingen Austin-Round Rock McAllen-Edinburg-Mission Laredo 0% 10% 20% 30% 40% 50% 60% 70% 80% 90% Source: Texas State Data Center – Scenario 0.5 (2006 projection) Household Composition Corpus Christi MSA Texas Average household size (2000) 2.82 2.74 28.9 28.2 Population younger than 18 (2000, in percent) 11.0 9.9 Population 65 and older (2000, in percent) Source: U.S. Census Bureau (1999 definition) Distribution by Race and Hispanic or Latino Origin, 2000 (in percent) Corpus Christi MSA Texas White 72.9 71.0 Black 4.0 11.5 Asian 1.1 2.7 American Indian 0.6 0.6 Other 18.2 11.7 Two or more races 3.1 2.5 Hispanic (of any race) 54.7 32.0 Source: U.S. Census Bureau (1999 definition) 3
- 7. Real Estate Center Market Overview 2007 Corpus Christi, TX Corpus Christi Market Overview 2007 Education Educational Attainment, Persons Age 25 and Older (in percent) Aransas Nueces San Patricio County County County Level of Education Texas 24.8 High school graduate 29.1 25.0 29.8 22.4 Some college, no degree 24.4 24.8 23.8 5.2 Associate's degree 4.4 5.7 4.8 15.6 Bachelor's degree 11.0 12.0 9.2 5.2 Master's degree 3.6 4.4 2.7 0.8 Doctorate degree 0.5 0.7 0.2 Source: U.S. Census Bureau, 2000 Census Educational Level, Persons Age 25 and Older, 2000 (in percent) Corpus Christi Level of Education MSA Texas High School Graduate or Higher 73.9 75.7 Bachelor's Degree or Higher 17.8 23.2 Source: U.S. Census Bureau 2000 (1999 definition) Local College and University Enrollment, Fall Semester School 2002 2003 2004 2005 2006 Del Mar College 11,159 11,289 11,245 11,889 11,301 Texas A&M University at Corpus Christi 7,607 7,861 8,227 8,355 8,585 Source: Texas Higher Education Coordinating Board 4
- 8. Real Estate Center Market Overview 2007 Corpus Christi, TX Corpus Christi Market Overview 2007 Employment Top Ten Employers Employer Sector Employees Naval Air Station Corpus Christi Flight training 5,525 Christus Spohn Health System Hospital 5,400 Corpus Christi ISD Education 5,178 H.E.B. Grocery Co. Grocery company 5,000 Corpus Christi Army Depot Helicopter repair 3,541 City of Corpus Christi Government 3,171 Bay, Ltd. Industrial construction 2,100 Del Mar College Education 1,542 Corpus Christi Medical Center Hospital 1,300 First Data Corporation Teleservices 1,200 Source: Corpus Christi Regional Economic Development Corporation Feb-2007 Corpus Christi MSA Nonfarm Employment Percent Year Employment Change 155,100 - 1996 158,800 2.4 1997 161,700 1.8 1998 163,200 0.9 1999 164,900 1.0 2000 166,200 0.8 2001 165,700 -0.3 2002 166,700 0.6 2003 167,300 0.4 2004 170,500 1.9 2005 173,800 1.9 2006 Source: Texas Workforce Commission and Real Estate Center at Texas A&M University 5
- 9. Real Estate Center Market Overview 2007 Corpus Christi, TX Employment Growth by Industry Corpus Christi MSA Texas Employment Growth 2006 (Percent Change) 1.9 3.3 Unemployment Rate 2006 (Percent Change) 5.0 4.9 Net Job Change in 2006 3,300 318,300 2006 Employment Growth by Sector (Percent Change) Natural Resources and Mining and Construction 6.2 7.5 Manufacturing 6.6 3.2 Trade, Transportation, and Utilities 1.3 2.5 Information 4.0 -0.4 Financial Activities 1.3 2.6 Professional and Business Services 4.3 6.0 Educational and Health Services -2.3 2.8 Leisure and Hospitality 3.5 3.9 Government 0.9 1.7 Source: Texas Workforce Commission and Real Estate Center at Texas A&M University Texas Metropolitan Area Nonfarm Employment Change Percent Metropolitan Area 1996 2006 Change McAllen-Edinburg-Mission 126,900 202,600 59.7 Midland 126,900 202,600 59.7 Laredo 56,500 84,200 49.0 Austin-Round Rock 540,900 720,000 33.1 Brownsville-Harlingen 94,000 121,300 29.0 College Station-Bryan 71,400 90,200 26.3 Tyler 73,700 91,700 24.4 Killeen-Temple-Fort Hood 97,600 118,100 21.0 Dallas-Fort Worth-Arlington 2,331,600 2,860,800 22.7 San Antonio 658,300 811,300 23.2 Longview 76,100 91,600 20.4 Houston-Sugar Land-Baytown 1,981,700 2,446,000 23.4 Texas 8,257,900 10,053,300 21.7 Lubbock 111,300 128,400 15.4 Waco 92,600 106,000 14.5 Corpus Christi 155,100 173,800 12.1 Odessa 48,100 57,400 19.3 Amarillo 96,900 110,100 13.6 Victoria 45,200 50,000 10.6 El Paso 236,700 264,800 11.9 Texarkana 50,300 55,700 10.7 Sherman-Denison 42,000 44,500 6.0 Abilene 60,600 65,300 7.8 San Angelo 42,500 44,700 5.2 Wichita Falls 59,600 62,500 4.9 Beaumont-Port Arthur 151,200 160,500 6.2 Source: Texas Workforce Commission and Real Estate Center at Texas A&M University 6
- 10. Real Estate Center Market Overview 2007 Corpus Christi, TX Metropolitan Area Nonfarm Employment Change 1996-2006 Wichita Falls San Angelo Sherman-Denison Beaumont-Port Arthur Abilene Victoria Texarkana El Paso Corpus Christi Amarillo Waco Lubbock Odessa Longview Killeen-Temple-Fort Hood Texas Dallas-Fort Worth-Arlington San Antonio Houston-Sugar Land-Baytown Tyler College Station-Bryan Brownsville-Harlingen Austin-Round Rock Laredo Midland McAllen-Edinburg-Mission 0% 10% 20% 30% 40% 50% 60% 70% Source: Texas Workforce Commission and Real Estate Center Average Hourly Wage 2005 Brownsville-Harlingen $12.25 McAllen-Edinburg-Mission $12.72 Abilene $13.39 Laredo $13.50 San Angelo $14.08 El Paso $14.14 Wichita Falls $14.17 Killeen-Temple-Fort Hood $14.23 Waco $14.45 Longview $14.63 Sherman-Denison $14.66 Texarkana $14.71 Corpus Christi $14.89 Tyler $15.11 Odessa $15.11 Victoria $15.34 Amarillo $15.37 Lubbock $15.51 Beaumont-Port Arthur $15.59 San Antonio $15.76 College Station-Bryan $15.85 Midland $16.56 Texas $17.10 Austin-Round Rock $18.71 Houston-Sugar Land-Baytown $18.76 Dallas-Fort Worth-Arlington $18.84 $10.00 $12.00 $14.00 $16.00 $18.00 $20.00 Source: Texas Workforce Commission 7
- 11. Real Estate Center Market Overview 2007 Corpus Christi, TX Nonfarm Employment Growth Corpus Christi MSA 3.0 2.5 Percent Change from Previous Year 2.0 1.5 1.0 0.5 0.0 -0.5 1997 1998 1999 2000 2001 2002 2003 2004 2005 2006 Source: Texas Workforce Commission and Real Estate Center at Texas A&M University Corpus Christi MSA Unemployment Rate 9 8 7 6 5 Percent 4 3 2 1 0 1997 1998 1999 2000 2001 2002 2003 2004 2005 2006 Source: Texas Workforce Commission and Real Estate Center at Texas A&M University 8
- 12. Real Estate Center Market Overview 2007 Corpus Christi, TX Distribution of Employment in Major Categories Corpus Christi MSA 180,000 160,000 140,000 120,000 Total Annual Jobs 100,000 80,000 60,000 40,000 20,000 0 2002 2003 2004 2005 2006 Natural Resources and Mining and Construction Manufacturing Trade, Transportation, and Utilities Information Financial Activities Professional and Business Services Educational and Health Services Leisure and Hospitality Government Source: Texas Workforce Commission and Real Estate Center at Texas A&M University 9
- 13. Real Estate Center Market Overview 2007 Corpus Christi, TX Corpus Christi Market Overview 2007 Economy Corpus Christi MSA Gross Retail Sales Sales per Capita Year Total Sales 1995 $3,380,234,427 #N/A 1996 $3,566,953,823 $8,950 1997 $3,698,087,607 $9,188 1998 $3,710,137,474 $9,188 1999 $3,708,947,438 $9,177 2000 $3,918,914,676 $9,718 2001 $4,080,056,376 $10,147 2002 $4,090,695,790 $10,115 2003 $4,260,206,975 $10,495 2004 $4,414,454,521 $10,776 2005 $4,690,484,526 $11,342 State Average 2005: $15,935 * 2006 data not available as of April 15, 2007. Source: Texas Comptroller's Office Gross Retail Sales per Capita 2005 Brownsville-Harlingen Texarkana McAllen-Edinburg-Mission El Paso Corpus Christi Wichita Falls Beaumont-Port Arthur College Station-Bryan Sherman-Denison Waco Abilene San Angelo Laredo Victoria Killeen-Temple-Fort Hood Houston-Sugar Land-Baytown San Antonio Fort Worth-Arlington MD Amarillo Longview Tyler Austin-Round Rock Odessa Texas Midland Dallas-Plano-Irving MD Lubbock $5,000 $7,000 $9,000 $11,000 $13,000 $15,000 $17,000 $19,000 $21,000 Source: Texas Comptroller's Office 10
- 14. Real Estate Center Market Overview 2007 Corpus Christi, TX Corpus Christi Market Overview 2007 Infrastructure Corpus Christi Airline Activity Corpus Christi International Airport 2002 2003 2004 2005 2006 Enplaned (int'l & national) 394,139 380,180 410,036 434,567 443,444 Deplaned (int'l & national) 393,435 386,310 407,949 433,617 443,084 Total (int'l & national) 787,574 766,490 817,985 868,184 886,528 Source: Corpus Christi International Airport Airport Cargo Statistics (in pounds) 2002 2003 2004 2005 2006 Airport 2,766,144 3,257,634 3,187,756 3,087,069 3,008,386 Corpus Christi International Airport Source: Corpus Christi International Airport Port Statistics Port of Corpus Christi 2002 2003 2004 2005 2006 Cargo Activity Total calls (ships and barges) 5,713 6,766 7,237 7,378 6,633 Total short tons (in millions) 81.0 85.1 86.4 86.8 87.0 Passenger Count Day Cruise 189,277 150,599 159,282 168,210 178,470 Source: Port of Corpus Christi 11
- 15. Real Estate Center Market Overview 2007 Corpus Christi, TX Corpus Christi Market Overview 2007 Public Facilities Corpus Christi City Public Facilities Building Permits 2005* Corpus Christi City Building Permit Office * 2006 data not available as of April 15, 2007. 12
- 16. Real Estate Center Market Overview 2007 Corpus Christi, TX Corpus Christi Market Overview 2007 Multifamily Corpus Christi 2006 Texas Metro Corpus Christi Average Average rent per square foot $0.72 $0.77 Average rent for units built since 2000 $0.69 $0.86 Average occupancy 95.2% 92.8% Average occupancy for units built since 2000 94.7% 94.1% Source: Apartment MarketData Research Corpus Christi MSA Multifamily Building Permits 5+ Multifamily Building Permits 1,000 900 800 700 600 Units 500 400 300 200 100 p 0 1987 1988 1989 1990 1991 1992 1993 1994 1995 1996 1997 1998 1999 2000 2001 2002 2003 2004 2005 2006 Source: U.S. Bureau of Census and Real Estate Center at Texas A&M University 2006 figure is a preliminary number. 13
- 17. Real Estate Center Market Overview 2007 Corpus Christi, TX Corpus Christi City Multifamily Building Permits 2005* Corpus Christi City Building Permit Office * 2006 data not available as of April 15, 2007. 14
- 18. Real Estate Center Market Overview 2007 Corpus Christi, TX Corpus Christi Market Overview 2007 Housing 2006 Housing Affordability Index Required Median 2006 Median-Priced Income to Family HAI for First-Time MLS Home Qualify Income HAI* Homebuyers** Corpus Christi $130,600 $32,128 $48,200 1.50 1.06 1.54 1.05 State $143,000 $35,179 $54,300 1.10 0.62 US $221,900 $54,139 $59,600 * The HAI is the ratio of the median family income to the income required to buy the median-priced house using standard mortgage financing at the current interest rate. Standard financing is a fixed-rate, 30-year loan covering 80 percent of the cost of the home. A HAI of 1.00 indicates that the median family income is exactly equal to the required income to qualify for the standard loan to purchase the median-priced house. ** First-time home buyer is assumed to purchase a home equal to the first quartile home price using a 90% home loan at an interest rate 0.5 percent greater than the standard current rate. Source: Real Estate Center at Texas A&M University Price Distribution of MLS Homes Sold, Corpus Christi Area (in percent) Price Range 2000 2001 2002 2003 2004 2005 2006 $29,999 or less 4.1 4.0 4.2 4.0 3.0 2.5 2.0 30,000 - 39,999 4.3 3.9 3.4 3.5 3.4 2.7 2.3 40,000 - 49,999 6.5 5.6 5.1 4.5 2.9 3.4 3.1 50,000 - 59,999 8.2 7.4 7.0 5.8 4.7 3.9 3.8 60,000 - 69,999 10.3 8.6 7.6 6.7 5.6 4.3 4.6 70,000 - 79,999 11.0 10.2 9.2 7.7 6.3 5.3 5.4 80,000 - 89,999 9.7 11.2 10.8 9.1 8.4 6.6 6.1 90,000 - 99,999 8.6 8.1 8.6 8.1 7.3 6.8 5.2 100,000 - 119,999 9.6 11.0 10.7 10.5 12.1 11.5 11.3 120,000 - 139,999 8.5 9.1 9.3 10.9 11.5 11.6 11.7 140,000 - 159,999 5.1 5.4 7.5 8.3 9.2 9.2 9.9 160,000 - 179,999 4.1 4.1 5.0 5.8 7.3 7.4 7.7 180,000 - 199,999 2.5 2.6 2.6 3.8 4.0 5.9 5.6 200,000 - 249,999 3.9 4.8 4.9 5.0 6.1 7.7 8.7 250,000 - 299,999 1.8 2.2 2.1 3.2 3.6 4.6 4.2 300,000 - 399,999 1.3 1.4 1.3 2.3 3.2 3.7 5.2 400,000 - 499,999 0.4 0.2 0.3 0.6 0.8 1.6 1.7 500,000 and more 0.3 0.2 0.4 0.4 0.6 1.2 1.5 Source: Real Estate Center at Texas A&M University 15
- 19. Real Estate Center Market Overview 2007 Corpus Christi, TX Price Distribution of MLS Homes Sold Corpus Christi Area 14.0 12.0 10.0 8.0 Percent 6.0 4.0 2.0 0.0 e ss 9 9 9 9 9 99 9 9 9 9 9 99 9 9 9 9 or 9 99 9 9 99 99 9 9 9 99 9 9 9 9 le ,9 ,9 ,9 ,9 ,9 ,9 ,9 ,9 ,9 ,9 ,9 ,9 m 9, 9, 9, 9, 9 9 69 9 9 9 9 9 9 9 9 9 or 3 4 5 7 8 9 11 13 15 17 24 39 49 19 29 d an 99 - - - - - - - - - - - - - - - - 0 0 0 0 0 0 0 ,9 00 0 0 00 0 0 00 0 00 00 00 00 00 00 00 00 00 0 0 0 ,0 0 29 ,0 0, 0, 0, 0, 0, 0, ,0 ,0 ,0 ,0 ,0 ,0 ,0 ,0 ,0 70 $ 00 3 4 5 6 8 9 00 20 40 60 80 00 50 00 00 5 1 1 1 1 1 2 2 3 4 2004 2005 2006 Source: Real Estate Center at Texas A&M University Property Tax Rates, 2006 County, Major City, Major School District Tax Rate per $100 Valuation Taxing Entity* Corpus Christi 0.3659 Nueces County 0.6024 City of Corpus Christi 1.4860 Corpus Christi ISD $2.45 Total Rockport 0.2348 Aransas County 0.2443 City of Rockport 1.3963 Aransas County ISD $1.88 Total Portland 0.4755 San Patricio County City of Portland 0.5023 Portland ISD 1.6100 Total $2.59 * Only the typical taxing entities are listed. However, there are numerous numbers of taxing entities that need to be taken into account for an actual tax rate calculation. See following link for a more complete list: http://www.co.nueces.tx.us/taxoffice/pdf/taxjurisdictions.pdf Source: Aransas, Nueces & San Patricio County Tax Offices 16