
Recomendados
Mais conteúdo relacionado
Mais procurados
Mais procurados (9)
Destaque
Destaque (9)
Semelhante a 11578 Costigan Lane - 4th Floor Condo in Charlotte, NC
Semelhante a 11578 Costigan Lane - 4th Floor Condo in Charlotte, NC (20)
Último
Último (20)
11578 Costigan Lane - 4th Floor Condo in Charlotte, NC
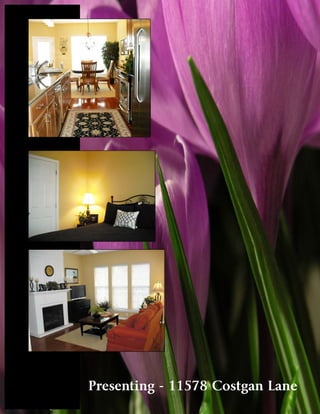
- 1. Presenting - 11578 Costgan Lane
- 2. quot; L i v ing in B e l le Vis t a a t Ba l la n ty n e Vi l lag e i s mo r e tha n j us t a ho me to us ; i t is a l i fes t y le ! W e lo v e l iv i ng s o c l ose t o s ho pp in g , r es t au r an ts , a nd s er v ic es. W e ca n wa lk to th e mo vies , d oc tors , d r y c l ean ers , dr ug s tor e, no t to men tio n a ll o f t h e r es ta ur a n ts - - Pa ner a Br ea d , M oe 's , V i l la ge B is tr o , a nd K ilw ins Ice C r eam a nd C h oco la t e S ho p jus t t o na me a few . D u r i ng th e s u mm er m on t hs w e e nj o y s oc ia l izi ng b y t he p oo l. A f t er l i vin g i n o th er c o ndo m in iu m b ui ld ings on low er f l oo r s , w e lo v e l i v ing o n the t op f l oo r c or n er u n i t t ha t is v ir tua l l y n ois e- fre e . F acing s ou theas t w i th a view o f Ba llan tyne Co un tr y C lu b a llows us to en jo y o ur p a ti o a ll day l on g- - s ipp in g c o f fe e i n th e mo r n in gs or a g lass o f w in e i n the e ven ings ! Ad jac en t to Belle Vista is Ba llantyn e Cor por ate Park wh ich boasts d es i gna t ed a nd w e l l- m an icur ed w a lk ing , jog gi ng , a nd b ic yc le tr ail s ar oun d s m a ll lakes and ponds --we r eally enjoy our daily walks !!! When tr aveling we love the co mfor t le ve l we ha ve kn owing th a t we ca n jus t lock ou r do or and no t wo rr y a bou t ma inte nanc e or sec ur i ty, s inc e Be lle Vista is a sec ure , ga ted , and ma in te nance -free c ommu nity. We are tr uly g oing to miss our lifes tyle a t Be lle Vista!!!quot;
- 6. Ardrey Kell High School 2006-07 HIGH STUDENT PERFORMANCE Ardrey Kell High School Performance of Students in Each Course on the ABCs End-of-Course Tests Mike Mathews, Principal Percentage of Students’ Scores At or Above Grade Level 10220 Ardrey Kell Road Charlotte, NC 28277 English I Algebra I Algebra II Geometry Biology Chemistry Physical Physics Civics & US Science Econ. History (980) 343-0860 Our Grades 9-11 93.0 69.0 84.0 82.0 75.0 --- --- --- 87.0 95.0 School Regular School Traditional Calendar District 71.0 71.0 61.0 58.0 63.0 --- --- --- 66.0 71.0 State 72.0 67.0 65.0 63.0 65.0 --- --- --- 66.0 65.0 Charlotte-Mecklenburg Schools N/A = 5 or fewer students *Chemistry, Physical Science, and Physics End-of-Course tests were not administered for ABCs calculations during 2006-07. SCHOOL PROFILE Performance of Each Student Group on the ABCs End-of-Course Tests School Size Percentage of Passing Scores on the End-of-Course Tests Grouped by Gender, Ethnicity, and The total number of students in this Other Factors. school and the average number of students in schools with similar grade Male Female White Black Hispanic Amer. Asian Multi- E.D. N.E.D. L.E.P. Migrant Students ranges at the district and state levels. Indian Pacific Racial Students with Islander Disabilities OUR SCHOOL DISTRICT STATE Our 1,139 1,411 989 School 85.5 85.7 89.8 71.2 69.5 88.9 89.6 74.4 62.7 87.8 55.6 N/A 65.4 # of tests Average Course Size 1,054 1,001 1,425 250 164 9 164 43 177 1,878 108 0 81 taken The average number of students 66.7 67.3 84.6 51.1 55.9 65.1 78.8 70.3 50.6 75.5 43.3 N/A 35.4 District enrolled in the the courses listed at the time of testing. 66.8 66.1 77.0 45.7 55.0 55.2 78.1 69.6 50.7 73.8 38.7 N/A 38.2 State OUR SCHOOL DISTRICT STATE E.D. = Economically Disadvantaged N.E.D. = Not Economically Disadvantaged L.E.P. = Limited English Proficiency 22 16 16 English I * N/A = 5 or fewer students 24 21 18 Algebra I 25 18 17 Algebra II School Attendance 95 Our School 25 20 17 Geometry 95 The average percentage of students who District 19 15 15 Biology attend school daily. 95 State Civics & Econ 27 17 16 US History 22 16 15
- 7. Ardrey Kell High School PAGE 2 HIGH STUDENT PERFORMANCE, CONTINUED SAFE, ORDERLY AND CARING SCHOOLS School Performance Each year, schools in North Carolina may receive several designations based on their performance School Safety on the state's ABCs tests. These designations are awarded on the basis of the percentage of students performing at grade level and on whether students have learned as much as they are The number of acts of crime or expected to learn in one year. The designations earned by your school are displayed below, violence reported below includes followed by a brief description of each designation. all acts occurring in school, at a bus stop, on a school bus, on Our School’s Designation(s): School of Distinction, High Growth school grounds or during off-cam- pus, school-sponsored activities. PERCENT OF SCHOOLS GROWTH: PERFORMANCE: WITH DESIGNATION DESIGNATION LEARNING ACHIEVED IN ONE YEAR STUDENTS PERFORMING AT GRADE LEVEL Out of 1,139 students in our High Expected Expected school, there were a total of 8 DISTRICT STATE Growth Growth Growth Not Achieved act[s] of crime or violence. HONOR SCHOOL At least 90% of students at grade level and the 0 1 OF EXCELLENCE school made adequate yearly progress (AYP) The number of acts of crime or SCHOOL OF EXCELLENCE At least 90% of students at grade level 0 1 violence reported per 100 students: SCHOOL OF DISTINCTION At least 80% of students at grade level 13 6 SCHOOL OF PROGRESS At least 60% of students at grade level 33 46 1 OUR SCHOOL NO RECOGNITION 60 to 100% of students at grade level 8 9 PRIORITY SCHOOL 50 to 60% of students at grade level, OR 1 DISTRICT 46 32 Less than 50% of students at grade level 1 STATE LOW PERFORMING Less than 50% of students at grade level 0 5 Access to Technology Adequate Yearly Progress (AYP) Results In any group where the percentage of students North Carolina has set target goals that schools Percentage of classrooms at a grade level is greater than 95% or less must meet to make Adequate Yearly Progress connected to the Internet than 5%, the actual values may not be displayed (AYP) under the federal No Child Left Behind act. because of federal privacy regulations. In Our school made adequate yearly progress. 100.0% 99.5% 99.3% these cases the results will be shown as 95% 100% or 5% for the group. Our school met 8 out of 8 AYP targets. 80% 60% QUALITY TEACHERS 40% 20% Teachers National Classes Taught by Total Number Fully Teacher Years of Teaching Experience with Board Highly Qualified of Classroom Licensed Turnover 0% 0–3 4–10 10+ Advanced Certified Teachers Teachers* Teachers Rate Our District State years years years Degrees Teachers* School Our School 77 90% 96% 40% 11 22% 26% 52% N/A District 97 85% 91% 27% 10 27% 28% 45% 27% Keeping you informed State 63 89% 96% 25% 8 22% 25% 53% 22% More information about your * The total number of teachers in this school and the average number of teachers in schools with similar grade ranges at the district and state level. school is available on the NC Becoming involved in your child’s school is one way to guarantee success in the School Report Cards Web site at: classroom. Working together, we can create superior schools for all children. http://www.ncreportcards.org Michael F. Easley, Governor, State of North Carolina North Carolina Office of the Governor • Public Schools of North Carolina
- 8. Community House Middle 2006-07 HIGH STUDENT PERFORMANCE Community House Middle Performance of Students in Each Grade on the ABCs End-of-Grade Tests Jamie W. Brooks, Principal Percentage of Students’ Scores At or Above Grade Level 9500 Community House Rd Charlotte, NC 28277 Grade 5 Grade 6 Grade 7 OVERALL (980) 343-0689 Reading Math Reading Math Reading Math Reading Math Grades 5-6 Our Regular School 95 90.7 95 88.6 95 92.0 95 90.4 School Traditional Calendar District 89.1 68.6 78.0 61.4 81.2 59.6 83.3 65.3 Charlotte-Mecklenburg Schools State 89.3 66.7 82.5 64.6 86.3 63.5 85.5 66.4 N/A = 5 or fewer students Performance of Each Student Group on the ABCs End-of-Grade Tests SCHOOL PROFILE Percentage of Students, Grouped by Gender, Ethnicity, and Other Factors, Who Passed BOTH School Size the Reading and Math Tests The total number of students in Male Female White Black Hispanic Amer. Asian Multi- E.D. N.E.D. L.E.P. Migrant Students this school and the average number Indian Pacific Racial Students with Islander Disabilities of students in schools with similar Our grade ranges at the district and 88.9 89.7 91.6 77.5 85.4 N/A 93.3 76.3 73.6 91.0 55.9 N/A 70.9 School state levels. # of tests 651 592 869 138 89 4 105 38 121 1,122 34 0 79 taken OUR SCHOOL DISTRICT STATE District 60.9 64.8 85.4 46.0 52.2 58.9 79.9 67.1 45.1 79.8 30.9 N/A 29.3 1,246 948 666 62.7 65.2 75.9 43.5 52.5 50.5 81.1 64.7 48.5 77.2 38.3 N/A 33.7 State Average Class Size E.D. = Economically Disadvantaged N.E.D. = Not Economically Disadvantaged L.E.P. = Limited English Proficiency The average number of students N/A = 5 or fewer students enrolled in a “typical” K–8 classroom. Three Year Trend of Student Percentage of Students Promoted OUR SCHOOL DISTRICT STATE Performance on the ABCs End-of- at Each Gateway Grade Reading and Math Tests Grade 5 N/A 22 21 NC students are required to meet state- Percentage of students at or above grade wide standards for promotion in grades Grade 6 28 22 21 level for the past three years. 3, 5, and 8. These gateways are designed Grade 7 26 22 21 to ensure that students are working at 100 grade level before being promoted to the 90 next grade. 80 GRADE 3 GRADE 5 GRADE 8 70 N/A N/A N/A Our School 60 N/A N/A N/A District 50 2005-06 2006-07 N/A N/A N/A State Reading Math * A multi-year trend for math is only available beginning in 2005-06 because of new tests based on the revised Standard Course of Study.
- 9. Community House Middle PAGE 2 HIGH STUDENT PERFORMANCE, CONTINUED SAFE, ORDERLY AND CARING SCHOOLS School Performance Each year, schools in North Carolina may receive several designations based on their performance School Safety on the state's ABCs tests. These designations are awarded on the basis of the percentage of students performing at grade level and on whether students have learned as much as they are The number of acts of crime or expected to learn in one year. The designations earned by your school are displayed below, violence reported below includes followed by a brief description of each designation. all acts occurring in school, at a bus stop, on a school bus, on Our School’s Designation(s): Honor School of Excellence, High Growth school grounds or during off-cam- PERCENT OF SCHOOLS GROWTH: pus, school-sponsored activities. PERFORMANCE: WITH DESIGNATION DESIGNATION LEARNING ACHIEVED IN ONE YEAR STUDENTS PERFORMING AT GRADE LEVEL Out of 1,246 students in our High Expected Expected school, there were a total of 6 DISTRICT STATE Growth Growth Growth Not Achieved act[s] of crime or violence. HONOR SCHOOL At least 90% of students at grade level and the 13 4 OF EXCELLENCE school made adequate yearly progress (AYP) The number of acts of crime or SCHOOL OF EXCELLENCE At least 90% of students at grade level 0 1 violence reported per 100 students: SCHOOL OF DISTINCTION At least 80% of students at grade level 17 20 SCHOOL OF PROGRESS At least 60% of students at grade level 20 45 0 OUR SCHOOL NO RECOGNITION 60 to 100% of students at grade level 13 16 PRIORITY SCHOOL 50 to 60% of students at grade level, OR 1 DISTRICT 27 12 Less than 50% of students at grade level 1 STATE LOW PERFORMING Less than 50% of students at grade level 10 2 Access to Technology Adequate Yearly Progress (AYP) Results In any group where the percentage of students North Carolina has set target goals that schools Percentage of classrooms at a grade level is greater than 95% or less must meet to make Adequate Yearly Progress connected to the Internet than 5%, the actual values may not be displayed (AYP) under the federal No Child Left Behind act. because of federal privacy regulations. In 100.0% 99.5% 99.3% these cases the results will be shown as 95% 100% Our school made adequate yearly progress. or 5% for the group. 80% Our school met 29 out of 29 AYP targets. 60% QUALITY TEACHERS 40% 20% Teachers National Classes Taught by Total Number Fully Teacher Years of Teaching Experience 0% with Board Highly Qualified of Classroom Licensed Turnover Our District State 0–3 4–10 10+ Advanced Certified Teachers Teachers* Teachers Rate years years years Degrees School Teachers* Our School 67 97% 90% 40% 14 24% 31% 45% 27% District 61 84% 91% 25% 6 32% 34% 34% 31% Keeping you informed State 46 91% 96% 24% 5 24% 30% 46% 24% More information about your * The total number of teachers in this school and the average number of teachers in schools with similar grade ranges at the district and state level. school is available on the NC Becoming involved in your child’s school is one way to guarantee success in the School Report Cards Web site at: classroom. Working together, we can create superior schools for all children. http://www.ncreportcards.org Michael F. Easley, Governor, State of North Carolina North Carolina Office of the Governor • Public Schools of North Carolina
- 10. Providence Spring Elementary 2006-07 HIGH STUDENT PERFORMANCE Providence Spring Elementary Performance of Students in Each Grade on the ABCs End-of-Grade Tests Diane Adams, Principal Percentage of Students’ Scores At or Above Grade Level 10045 Providence Church Ln Charlotte, NC 28277 Grade 3 Grade 4 Grade 5 OVERALL (980) 343-6935 Reading Math Reading Math Reading Math Reading Math Grades K-5 Our Regular School 95 95 95 93.4 95 95 95 95 School Traditional Calendar District 81.5 70.1 85.1 68.3 89.1 68.6 83.3 65.3 Charlotte-Mecklenburg Schools State 81.8 70.8 85.2 67.7 89.3 66.7 85.5 66.4 N/A = 5 or fewer students Performance of Each Student Group on the ABCs End-of-Grade Tests SCHOOL PROFILE Percentage of Students, Grouped by Gender, Ethnicity, and Other Factors, Who Passed BOTH School Size the Reading and Math Tests The total number of students in Male Female White Black Hispanic Amer. Asian Multi- E.D. N.E.D. L.E.P. Migrant Students this school and the average number Indian Pacific Racial Students with Islander Disabilities of students in schools with similar Our grade ranges at the district and 95 95 95 93.3 76.9 N/A 95 95 88.9 95 N/A N/A 82.8 School state levels. # of tests 232 199 377 15 13 0 17 9 9 422 0 0 29 taken OUR SCHOOL DISTRICT STATE District 60.9 64.8 85.4 46.0 52.2 58.9 79.9 67.1 45.1 79.8 30.9 N/A 29.3 857 671 510 62.7 65.2 75.9 43.5 52.5 50.5 81.1 64.7 48.5 77.2 38.3 N/A 33.7 State Average Class Size E.D. = Economically Disadvantaged N.E.D. = Not Economically Disadvantaged L.E.P. = Limited English Proficiency The average number of students N/A = 5 or fewer students enrolled in a “typical” K–8 classroom. Three Year Trend of Student Percentage of Students Promoted OUR SCHOOL DISTRICT STATE Performance on the ABCs End-of- at Each Gateway Grade Reading and Math Tests Kindergarten 22 19 19 NC students are required to meet state- Percentage of students at or above grade wide standards for promotion in grades Grade 1 22 19 19 level for the past three years. 3, 5, and 8. These gateways are designed Grade 2 23 20 19 to ensure that students are working at 100 grade level before being promoted to the Grade 3 21 20 19 90 next grade. Grade 4 27 21 20 80 Grade 5 29 22 21 GRADE 3 GRADE 5 GRADE 8 70 N/A N/A N/A Our School 60 N/A N/A N/A District 50 2004-05 2005-06 2006-07 N/A N/A N/A State Reading Math * A multi-year trend for math is only available beginning in 2005-06 because of new tests based on the revised Standard Course of Study.
- 11. Providence Spring Elementary PAGE 2 HIGH STUDENT PERFORMANCE, CONTINUED SAFE, ORDERLY AND CARING SCHOOLS School Performance Each year, schools in North Carolina may receive several designations based on their performance School Safety on the state's ABCs tests. These designations are awarded on the basis of the percentage of students performing at grade level and on whether students have learned as much as they are The number of acts of crime or expected to learn in one year. The designations earned by your school are displayed below, violence reported below includes followed by a brief description of each designation. all acts occurring in school, at a bus stop, on a school bus, on Our School’s Designation(s): Honor School of Excellence, High Growth school grounds or during off-cam- PERCENT OF SCHOOLS GROWTH: pus, school-sponsored activities. PERFORMANCE: WITH DESIGNATION DESIGNATION LEARNING ACHIEVED IN ONE YEAR STUDENTS PERFORMING AT GRADE LEVEL Out of 857 students in our High Expected Expected school, there was a total of 1 DISTRICT STATE Growth Growth Growth Not Achieved act[s] of crime or violence. HONOR SCHOOL At least 90% of students at grade level and the 11 5 OF EXCELLENCE school made adequate yearly progress (AYP) The number of acts of crime or SCHOOL OF EXCELLENCE At least 90% of students at grade level 0 0 violence reported per 100 students: SCHOOL OF DISTINCTION At least 80% of students at grade level 15 24 SCHOOL OF PROGRESS At least 60% of students at grade level 36 37 0 OUR SCHOOL NO RECOGNITION 60 to 100% of students at grade level 22 22 PRIORITY SCHOOL 50 to 60% of students at grade level, OR 1 DISTRICT 16 11 Less than 50% of students at grade level 1 STATE LOW PERFORMING Less than 50% of students at grade level 1 1 Access to Technology Adequate Yearly Progress (AYP) Results In any group where the percentage of students North Carolina has set target goals that schools Percentage of classrooms at a grade level is greater than 95% or less must meet to make Adequate Yearly Progress connected to the Internet than 5%, the actual values may not be displayed (AYP) under the federal No Child Left Behind act. because of federal privacy regulations. In 100.0% 99.5% 99.3% these cases the results will be shown as 95% 100% Our school made adequate yearly progress. or 5% for the group. 80% Our school met 9 out of 9 AYP targets. 60% QUALITY TEACHERS 40% 20% Teachers National Classes Taught by Total Number Fully Teacher Years of Teaching Experience 0% with Board Highly Qualified of Classroom Licensed Turnover Our District State 0–3 4–10 10+ Advanced Certified Teachers Teachers* Teachers Rate years years years Degrees School Teachers* Our School 50 100% 100% 26% 13 14% 42% 44% 14% District 46 98% 99% 31% 6 31% 32% 36% 26% Keeping you informed State 37 97% 99% 26% 4 24% 29% 48% 21% More information about your * The total number of teachers in this school and the average number of teachers in schools with similar grade ranges at the district and state level. school is available on the NC Becoming involved in your child’s school is one way to guarantee success in the School Report Cards Web site at: classroom. Working together, we can create superior schools for all children. http://www.ncreportcards.org Michael F. Easley, Governor, State of North Carolina North Carolina Office of the Governor • Public Schools of North Carolina
- 12. `xv~ÄxÇuâÜz VÉâÇàç fv{ÉÉÄá The above information was taken from the 2007 -08 Charlotte Observer “Living Here” publication. Find the whole book on the internet at: http://newspaperads.charlotte.com/SS
- 13. Professional Services Conrad, Trosch Kemmy 704-553-8221 Closing Attorney Trey Inman Associates 704-227-0220 L.A. Page Law firm 704-927-5070 The Bailey Law Group 704-544-2922 Castle Home Inspections 704-399-1177 Property Inspection Alpha Omega Home Inspections Joe Funderburk - 803-925-1502 Housemaster Butch Upton - 704-869-0000 Housemaster Butch Upton - 704-869-0000 Pest Inspection Castle Home Inspections 704-399-1177 Myers Park Mortgage Dana Bausman - 704-906-4773 Lender USAA Denise Rodriguez - 800-531-8781 Wachovia Cynthia Crippen - 704-542-2382 American Home Shield Jackie Campbell - 800-735-4663 Home Warrantee Old Republic Dawn Neary - 800-445-6999 Owen Sons Fencing Decks Owen Presutti - 704-455-7354 Miscellaneous services Painting Small repairs PACO Home Improvement - 704-605-3036 Steel Tape House Measuring Clay Ferguson - 704-525-8485 Carpentry, Drywall, Electrical Brian Sherrill - 704-488-5260 DANIELE E. SUMMERFIELD - Realtor ® 8604 Cliff Cameron Dr. Suite 110, Charlotte, NC 28269 Cell (704) 787-2068 * Fax 866-756-1575 DSummerfield@WilkinsonAndAssociates.com