UN; Summary of Field and Laboratory Testing for the Biosand Filter
•
1 like•4,205 views

UN; Summary of Field and Laboratory Testing for the Biosand Filter

Recommended
Recommended
More Related Content
What's hot
What's hot (11)
Similar to UN; Summary of Field and Laboratory Testing for the Biosand Filter
Similar to UN; Summary of Field and Laboratory Testing for the Biosand Filter (20)
More from D2Z
More from D2Z (12)
Recently uploaded
Recently uploaded (20)
UN; Summary of Field and Laboratory Testing for the Biosand Filter
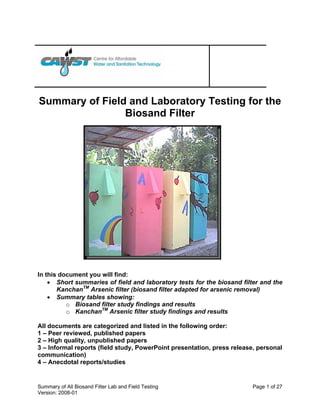
- 1. Summary of Field and Laboratory Testing for the Biosand Filter In this document you will find: • Short summaries of field and laboratory tests for the biosand filter and the KanchanTM Arsenic filter (biosand filter adapted for arsenic removal) • Summary tables showing: o Biosand filter study findings and results o KanchanTM Arsenic filter study findings and results All documents are categorized and listed in the following order: 1 – Peer reviewed, published papers 2 – High quality, unpublished papers 3 – Informal reports (field study, PowerPoint presentation, press release, personal communication) 4 – Anecdotal reports/studies Summary of All Biosand Filter Lab and Field Testing Page 1 of 27 Version: 2008-01
- 2. Table of Contents PART 1: BIOSAND FILTER FIELD AND LABORATORY STUDIES ............................................................................ 3 CATEGORY 1 – PUBLISHED PAPERS ................................................................................................................ 3 EFFECTS OF OPERATING CONDITIONS ON THE BACTERIAL REMOVAL OF TWO HOUSEHOLD DRINKING-WATER FILTERS (2007)............................................................................................................................................ 3 CHARACTERIZATION OF THE BSF FOR MICROBIAL REDUCTIONS- LAB AND FIELD CONDITIONS (2006).............. 3 PERFORMANCE OF BSF IN HAITI: A FIELD STUDY OF 107 HOUSEHOLDS (2006) ............................................. 4 THE LONG-TERM SUSTAINABILITY OF HOUSEHOLD BIOSAND FILTRATION (2004)............................................. 4 TOXICANT AND PARASITE CHALLENGE OF MANZ INTERMITTENT SLOW SAND FILTER (1999) ............................ 4 CATEGORY 2 – HIGH QUALITY UNPUBLISHED PAPERS ...................................................................................... 6 EVALUATION OF HOUSEHOLD BIOSAND FILTERS IN ETHIOPIA (2006) .............................................................. 6 NEPAL WATER PROJECT – MASSACHUSETTS INSTITUTE OF TECHNOLOGY (2001) .......................................... 6 INTERMITTENTLY OPERATED SLOW SAND FILTRATION – A NEW WATER TREATMENT PROCESS (1995) ........... 7 NICARAGUA HOUSEHOLD WATER SUPPLY AND TESTING PROJECT FINAL REPORT (1993) ............................... 8 CATEGORY 3 – INFORMAL REPORTS (FIELD STUDY, POWERPOINT PRESENTATION, PRESS RELEASE, PERSONAL COMMUNICATION) ............................................................................................................................................ 9 UNC INDEPENDENT ASSESSMENT OF BIOSAND FILTER IN CAMBODIA (2007) .................................................. 9 UNC HEALTH IMPACT STUDY IN CAMBODIA (2007) ....................................................................................... 9 EVALUATION OF BSF PROJECT IN DANLÍ, HONDURAS (2007)....................................................................... 10 PERFORMANCE OF BSF IN POSOLTEGA, NICARAGUA- FIELD EVALUATION (2007) ......................................... 10 CAMBODIA BIOSAND FILTER MONITORING AND EVALUATION SUMMARY (2007) ............................................. 11 UNC HEALTH IMPACT STUDY IN THE DOMINICAN REPUBLIC (2006).............................................................. 12 PROJECT BRAVO FIELD STUDY (2006) ..................................................................................................... 12 BSF EVALUATION REPORT SAMARITAN’S PURSE – 6 COUNTRY STUDY (2002)............................................. 13 TARGETING INDIVIDUALS: THE SUCCESS OF HOUSEHOLD SAND FILTRATION (2000)...................................... 14 CATEGORY 4 – ANECDOTAL REPORTS/STUDIES.............................................................................................. 15 SAMARITAN’S PURSE PROJECT IN ETHIOPIA (2006)..................................................................................... 15 PART 2: KANCHANTM ARSENIC FILTER FIELD AND LABORATORY STUDIES ....................................................... 16 CATEGORY 1 – PUBLISHED PAPERS .............................................................................................................. 16 KANCHANTM ARSENIC FILTER (KAF) PROJECT IN NEPAL – MIT AND ENPHO (2005) .................................... 16 CATEGORY 2 – HIGH QUALITY UNPUBLISHED PAPERS .................................................................................... 19 4 WEEK DAILY STUDY ON TOTAL COLIFORM REMOVAL OF THE KAF (2005).................................................. 19 CAN IRON AND ARSENIC PARTICLES MIGRATE THROUGH THE KAF SAND LAYER? (2005).............................. 19 ARSENIC, IRON AND COLIFORM REMOVAL EFFICIENCY OF KAF (2004)......................................................... 19 KAF STUDY ON EFFECT OF AIR SPACE BETWEEN THE RESTING WATER AND THE DIFFUSER BASIN (2004) .... 20 PERFORMANCE EVALUATION OF THE ARSENIC BIOSAND FILTER FOR MITIGATION OF ARSENIC CONTAMINATION (2004) ...................................................................................................................................................... 20 ARSENIC BIOSAND FILTER: DESIGN OF AN APPROPRIATE HOUSEHOLD DRINKING WATER FILTER (2003) ....... 21 PART 3: SUMMARY TABLES OF FIELD AND LABORATORY STUDIES .................................................................. 22 TABLE 1: BIOSAND FILTER FIELD AND LABORATORY TESTS ............................................................................. 22 TABLE 2: BIOSAND FILTER HEALTH IMPACT STUDIES ....................................................................................... 26 TABLE 3: KANCHANTM ARSENIC FILTER FIELD AND LABORATORY STUDIES ....................................................... 27 Summary of All Biosand Filter Lab and Field Testing Page 2 of 27 Version: 2008-01
- 3. PART 1: BIOSAND FILTER FIELD AND LABORATORY STUDIES CATEGORY 1 – PUBLISHED PAPERS Effects of operating conditions on the bacterial removal of two household drinking-water filters (2007) Jill Baumgartner, Susan Murcott, & Majid Ezzati; Harvard School of Public Health, Massachusetts Institute of Technology Source: Environmental Research Letters, 2 (2007) IOP Publishing Available at: http://www.iop.org/EJ/article/1748-9326/2/2/024003/erl7_2_024003.pdf?request- id=5uxprOmA3BGq5Z7K2wi7Kg This study investigated the performance of the BSF with respect to pause times between filtration runs, water-dosing volumes and the effluent volume at which a filtered water sample was collected. Three scenarios were compared by the authors, including infrequent filtration (36 hours) and high water dosing volume (20 liters), frequent filtration (12 hours) and high water dosing volume (20 liters), and frequent filtration (12 hours) and low water dosing volume (10 liters). The study showed: • Total coliform removal by the BSF decreased with an increase in the sample collection volume, i.e. at 5 liters of effluent the percent removal was greatest • Greater removal of total coliforms when filter pause period is 12 hours versus 36 hours Key lessons learned: • Encourage users to filter 5 L of water at a time or when filtering more than 5 L at a time, use first five liters for drinking/cooking and the remainder for other household needs Characterization of the BSF for Microbial Reductions- Lab and Field Conditions (2006) Christine E. Stauber, Mark Elliott, Fatma Koksal, Gloria M. Ortiz, Kaida Liang, Francis A. DiGiano, and Mark D. Sobsey ; University of North Carolina at Chapel Hill Source: Water Science & Technology Vol 54 No 3 pp 1–7 Q IWA Publishing 2006 Abstract Available at: http://www.ncbi.nlm.nih.gov/sites/entrez?db=pubmed&uid=17037125&cmd=showdetailview&ind exed=google The objective of this study was to determine the ability of the BSF to reduce concentrations of bacteria, coliphages and human enteric viruses and to changes in filter effectiveness with biological ripening and length of operation • Ripening time varies, probably due to influent water quality • 95-98% reduction of E. coli in a ripened filter • ~80-90% virus reductions in a ripened filter • In the field, filters near Bonao DR are reducing E. coli an average of about 90% Summary of All Biosand Filter Lab and Field Testing Page 3 of 27 Version: 2008-01
- 4. Performance of BSF in Haiti: A Field Study of 107 Households (2006) Baker, D.L., Duke, W.F., Mazumder, A. and R. Nordin Source: Rural and Remote Health. 6: 570. (Online), 2006. Available at http://www.rrh.org.au/publishedarticles/article_print_570.pdf A field study of 107 households was conducted to evaluate the use and performance of the Manz biosand filter in the Artibonite Valley of Haiti. Approximately 2000 filters had been installed in this area over the preceding five years by the staff in Community Development at Hospital Albert Schweitzer. Water analyses were performed by Haitian lab technicians using the membrane filtration method to determine E. coli counts. Description Contamination Removal Shallow wells (source) 243 E.coli cfu/100ml - Piped water (source) 195 E.coli cfu/100ml - Average biosand filter - 98.5% efficiency of bacterial removal Biosand filter Turbidity 6.2 NTU 0.9 NTU removal The Long-term Sustainability of Household Biosand Filtration (2004) E. Fewster, A. Mol, and C. Wiesent-Brandsma Source: 30th WEDC International Conference, Vientiane, Lao PDR (2004) Available at: http://www.biosandfilter.org/biosandfilter/files/webfiles/Bio_Sand_Filter_Article_WEDC_Confere nce_2004.pdf This paper was submitted to the WEDC International Conference in 2004 based on an evaluation of a project in the Machakos District of Kenya that began in 1999. 51 filters were tested for bacterial and turbidity removal after four years of operation. The evaluation found that: • 70.5% of filters achieved 0-10 faecal coliforms per 100 mL (The percentage of filters that achieved this level of microbial reduction four years earlier was 80.7%) • 82.4% of filters achieved turbidity reduction of less than 10 NTU • Outlined possible linkage between user cleaning behaviour and failure to achieve good microbial reduction – operation and maintenance information to users needs to be improved, including improved follow-up visits and increased frequency of visits. Toxicant and Parasite Challenge of Manz Intermittent Slow Sand Filter (1999) Palmateer, G., Manz, D., Jurkovic, A., McInnis, R., Unger, S., Kwan, K. K., Dudka, B. J. Source: Environmental Toxicology, vol. 14, pp. 217- 225 (1999) Abstract available at: http://www3.interscience.wiley.com/cgi- bin/abstract/60000404/ABSTRACT?CRETRY=1&SRETRY=0 Safe potable water is a luxury that is generally unavailable to the majority of rural and suburban populations of developing, underdeveloped, and often developed countries. Important Summary of All Biosand Filter Lab and Field Testing Page 4 of 27 Version: 2008-01
- 5. considerations in the development and maintenance of safe water supplies is the availability and use of efficient, inexpensive, and appropriate technology for removing microbial hazards, parasites, and toxicants. The Manz intermittent slow sand filter was known to be user friendly, small enough to fit into the smallest kitchen, and could remove up to 97% of the fecal coliforms present in the raw water before treatment by the Manz filter. This filter was evaluated for its ability to remove parasitic cysts and toxicants as well as bacteria. Using two different filters and two different water supplies our results indicated that the intermittent slow sand filter could remove 83+% total heterotrophic bacterial populations, 100% of Giardia cysts, 99.98% of Cryptosporidium oocysts, and 50-90% of organic and inorganic toxicants when administered in concentrations varying from 10-100x environmental pollution levels. Methodology details are provided in the paper. Summary of All Biosand Filter Lab and Field Testing Page 5 of 27 Version: 2008-01
- 6. CATEGORY 2 – HIGH QUALITY UNPUBLISHED PAPERS Evaluation of Household Biosand Filters in Ethiopia (2006) Paul Earwaker Source: Cranfield University Silsoe, MSc Water Management (Community Water Supply) Available at: https://dspace.lib.cranfield.ac.uk/handle/1826/1454 An evaluation was conducted to evaluate filters in rural Ethiopia that were installed more than 5 years previously. Filters from three villages were examined to assess filter performance, maintenance practices, user perceptions and the supporting environment. The investigation utilized a range of methods including water testing, observation and semi-structured interviews. A brief summary of the evaluation is as follows: • 44% to 88% of total filter are used in each village • 87.9% reduction rate of E. coli in the working filter • 81.2% of the filtered water have less than 5 TU. The poor performance of some filters and low usage rates in some villages were attributed to the quality of maintenance, the lack of reinforcement of educational messages and the support provided to filter users. Nepal Water Project – Massachusetts Institute of Technology (2001) Tse-Luen Lee; Biosand Household Water Filter Project in Nepal Nathaniel Paynter; Household Water Use and Treatment Practices in Rural Nepal Source: Masters Theses, Department of Civil and Environmental Engineering, Massachusetts Institute of Technology Available at: http://web.mit.edu/watsan/std_thesis_nepal.htm A total of thirty-nine sets of BSF samples were tested. Each set of samples consisted of two individual tests; one sample of water before filtration and one after filtration by the BSF for a total of seventy-eight individual tests. Number of BSF test samples analyzed Turbidity H2S Total Coliform E. coli Palpa 12 12 2 2 Nawalparasi 66 66 36 36 Total 78 78 38 38 Of the thirty-nine BSFs that were evaluated in Nepal, fourteen of them did not show favourable results in terms of the removal of microbial contamination (i.e. H2S bacteria, total coliform, E. coli). Of the subset that did not work, 63% were found to have problems either with the diffuser plate, the resting water level or the maturity of the biofilm. Since these filters may not be representative of the microbial removal efficiency of the BSF, they were excluded in the results. Summary of All Biosand Filter Lab and Field Testing Page 6 of 27 Version: 2008-01
- 7. The results of filters that were working properly shows 75% removed total coliform, 83% removed E. coli and 89% removed H2S-producing bacteria. Thirty-six BSFs out of forty-two visited had been used in the last week, while three others had been used in the past four months. The remaining BSFs were not in use either because of problems with the construction (two BSFs) or because the BSF was inconveniently located. 93% of the respondents overwhelmingly liked the BSF, particularly citing the treated water's taste, and the BSF's high flow rate, cooling properties, as well as turbidity removal (Paytner, 2001). Membrane filtration tests carried out at MIT by Tse-Luen Lee indicate that the BSF technology is effective at removal of total coliform with an average removal of 99.5% of total coliform in the source water. During the test period, about 20L of water from the Charles River was collected every day (except weekends) and passed through the filter. The BSF was allowed 45 days to mature. Membrane filtration tests were then carried out. The medium used was the m-Endo broth manufactured by Millipore, which tests for total coliform. The results of the membrane filtration tests are shown in Table 8. Average percentage removal of total coliforms is 99.5% after being in operation for 45 days. This verified that the BSF is a fairly effectives technology for the removal of total coliforms in water. Membrane filtration total coliform results Trial Number Date Influent (CFU/100mL) Effluent (CFU/100mL) % Removal 1 April 28 560 3 99.46 2 April 29 610 5 99.18 3 May 1 680 3 99.58 4 May 2 590 2 99.66 5 May 5 730 2 99.72 Average 630 3 99.52 Intermittently Operated Slow Sand Filtration – A New Water Treatment Process (1995) Brian J. Buzanis Source: Masters Thesis, Department of Civil Engineering, University of Calgary (Electronic version available through CAWST) • Filter is effective in removing 96% of faecal coliform indicators and reducing turbidity levels to < 1 NTU • A mathematical model to describe the diffusion of oxygen transfer into the filter bio-layer was developed and supported by experimental data. • Considerable data was taken over a 55 day test period using influent water averaging 1300 CFU/100 ml taken from a river lagoon. Summary of All Biosand Filter Lab and Field Testing Page 7 of 27 Version: 2008-01
- 8. Nicaragua Household Water Supply and Testing Project Final Report (1993) David Manz, Byron Buzanis, Carlos Morales Available at: http://www.manzwaterinfo.ca/documents/Nicaragua%20Report%201993.pdf • Pilot project with plastic filter -- operated well but too complex, leakage and valves were stolen • Concrete filter developed -- Cost was $20 US • Valle Menier • 55 households, 326 people • 55 filters installed in households and 1 in a school • 15 water sources • Each filter had 3 faecal coliform tests in June 94 and Nov 94. • After 21 days of operations -- faecal coliform removal -- low was 86.67 % with a high of 100 % and average of 97 % • After 2 months of operation -- faecal coliform removal -- average for 55 filters was 96.4% Summary of All Biosand Filter Lab and Field Testing Page 8 of 27 Version: 2008-01
- 9. CATEGORY 3 – INFORMAL REPORTS (FIELD STUDY, POWERPOINT PRESENTATION, PRESS RELEASE, PERSONAL COMMUNICATION) UNC Independent Assessment of Biosand filter in Cambodia (2007) Kaida Liang, Mark Sobsey, Proum Sorya, & Mickey Sampson Source: September 2007 Presentation in Cambodia This cross sectional study investigating BSF use was conducted between December 2006 and January 2007 among recipients of biosand filters through two NGOs- Hagar and Cambodia Global Action (CGA). 336 households were selected at random from over 21,000 households reported to have received biosand filters in the region. Households were interviewed to determine water handling practices and use, filter use and maintenance, and sanitation and hygiene practices. The cross-sectional study showed the following: • Filter use ranged from 0-8 years • 87.5% of households were still using their filter • Continued filter use was significantly associated with: o Reported receiving training on BSF operation and maintenance o Observed method of drawing water for drinking, using a dipper o Using a deep well for water source o Reported cleaning water storage container o Treating water always or often Key Lessons Learned: • Biosand filters have a long lifespan and low breakage rate Note: this was taken from a presentation by Mark Sobsey in Cambodia and has not been published as of the date of distribution (Electronic version available through CAWST) UNC Health Impact Study in Cambodia (2007) Kaida Liang, Mark Sobsey, Proum Sorya, & Mickey Sampson Source: September 2007 Presentation in Cambodia This was a longitudinal, prospective cohort study over a period of 5 months with a sample size of 208 households divided into 104 intervention households and 104 matched controls. Households were visited weekly to collect data on diarrheal disease rates and monthly to sample raw, treated and stored water. Water samples were tested for E. coli and turbidity. The longitudinal study and health impact results were as follows: • Filters showed on average a 95% reduction in E. coli- Up to 99.99% observed • 55% of effluent water met the WHO’s low risk criteria (<10 E. coli 100mL) • 82% reduction in turbidity on average • For all ages combined, there was a 44% reduction in diarrheal disease • Greatest reduction in diarrheal disease was experienced by children ages 2-4 – 46% Summary of All Biosand Filter Lab and Field Testing Page 9 of 27 Version: 2008-01
- 10. Key Lessons Learned: • Recontamination of filtered water is a barrier to achieving safer drinking water at the household level • Need to design appropriate software (education) and hardware (containers) to prevent recontamination within the home Note: this was taken from a presentation by Mark Sobsey in Cambodia and has not been published as of the date of distribution (Electronic version available through CAWST) Evaluation of BSF Project in Danlí, Honduras (2007) Kelly Miller; Undergraduate Student at University of Buffalo, NY Prepared for Pure Water for the World, Honduras (Electronic version available through CAWST) This field evaluation was conducted in July and August of 2007 for Pure Water for the World, which has installed approximately 8,400 biosand filters in 135 communities. A random sample of 137 filters was drawn from 21 communities to represent the project area. Each household was visited and interviewed to determine use, maintenance, and perceived health benefits of the BSF. In addition, filters were inspected for quality of construction, flow rate, as well as sand and water quality. The household were visited a total of three times each to take stored and filtered water samples and test the subsequent samples for E. coli, turbidity and free chlorine levels. The major findings of the evaluation were: • 71.7% of filters were in use • 95.6% of users reported no filter problems (1.5% of filters were changed b/c of a problem) • 35% of users knew how to maintain filter • Average flow rate of .77 L/min (minimum = .15 L/min, maximum = 1.37 L/min) • 51% of filters were within 5-10 cm sand height range • 75% (n=20) of filters tested for effective sand size fell within the recommended range • 45% (n=20) of filters tested fall within recommended uniformity coefficient range Performance of BSF in Posoltega, Nicaragua- Field Evaluation (2007) Jason Vanderzwaag; MASc Candidate in Civil Engineering at University of British Columbia (Available at: http://www.civil.ubc.ca/pcwm/Seminars/Jason%20Vanderzwaag.pdf) The study author investigated whether filters installed in Posoltega, Nicaragua in 1999 and 2004 were still in operation at the time of the study- 2007, looked at the long-term efficiency of Biosand filters, identified the socioeconomic factors and behavioural attributes associated with successful filter operation, and researched the tools available to households and communities to evaluate their own filters. To achieve the study objectives, the author conducted household interviews, collected observational data and performed water quality testing for source, filtered, and stored water in the households. The study showed: • 10% of the original filters were still in operation (n=260). Summary of All Biosand Filter Lab and Field Testing Page 10 of 27 Version: 2008-01
- 11. • Of the 90% of filters that were no longer in use, many were broken and cracked, families lacked filter maintenance and operation knowledge, and households did not have access to replacement parts to fix or repair the filter • Household interviews showed that filter users liked the technology and would recommend it to others, thought the taste/odour and appearance of the filtered water was better, and thought the health of their family had improved after using the filter • Recontamination of filtered water was substantial • Average E. coli removal efficiency of the 27 filters in operation was 97%, ranging from 78% to 99.9% • Lack of awareness, education and training contributed to poor maintenance and operation and recontamination of filtered water • Poor filter construction appeared to affect sustained use more so than socioeconomic factors Note: This was taken from a presentation at the University of British Columbia. The author has submitted this paper for publishing. Cambodia Biosand Filter Monitoring and Evaluation Summary (2007) Sustainable Cambodia & Rotary Club of Pursat, Cambodia (Electronic version available through CAWST) Sustainable Cambodia conducted a field evaluation six months after implementing a biosand filter project in Sthany, Osdau and Tnort Trat villages. The evaluation team interviewed 73 households over the course of 5 days and also completed observations of the biosand filter and safe water storage within each household. The results were compared to a baseline survey conducted just before biosand filter installation. The results of the evaluation showed: • 36% of households reported “treating” their drinking water after filtering – which method was unclear from the survey • Households use filtered water for a variety of activities: 99% drinking, 73% cooking, 48% cleaning vegetables, 44% washing dishes, 13% washing clothes, 1% bathing At baseline, households treated only their drinking water • An increase in the number of people treating their drinking water from 58% to 99% - households boiled their water before biosand filter • 30% of filters had problems with the concrete - chipping or cracking • 29% of filters had food stored inside the filter reservoir • 22% of families did not have the filter lid in place – many because they never received lids • Need more education about how the filter works and on safe storage One tentative conclusion was that there was improved health after biosand filters had been installed. This was based on a household’s perception that their overall health had improved, reporting reductions in diarrhea and typhoid. The recall period for baseline survey and evaluation were both long. The project team will focus on education for operation and maintenance of the filter as well as safe storage and investigate the quality of cement used for filter body construction. Summary of All Biosand Filter Lab and Field Testing Page 11 of 27 Version: 2008-01
- 12. UNC Health Impact Study in the Dominican Republic (2006) Christine Stauber, Mark Sobsey Source: March 2007 Press Release by University of North Carolina (Results to be published in 2008) This was a cross-sectional study that investigated 182 out of 400 homes in Bonao. During the four month baseline phase, weekly visits were made and biweekly water samples were collected. During the six month intervention phase, 80 homes were randomly selected to receive biosand filters. During the study, more than 5,900 weekly interviews and over 5,000 water samples were compiled. The health impact results were as follows: • For children under age 5, the number of cases of diarrhea per child per year was 1.7 when drinking BSF water and 4.8 when drinking unfiltered water • For all ages combined, the number of cases of diarrhea per person per year was 0.62 when drinking BSF water and 1.50 when drinking unfiltered water • Overall, the intervention reduced diarrhea in all ages including children under the age of 5 by 30-40% • By comparison, in the U.S. the cases of diarrhea per person per year is about 0.5 when drinking water from standard sources Note: this was taken from a personal communication with Mark Sobsey and a press release by UNC and has not been published as of the date of distribution (Electronic version available through CAWST) Project BRAVO Field Study (2006) Derek Baker and William Duke Source: CAWST Presentation and Executive Summary Available at: http://www.cawst.org/assets/File/Project_BRAVO_Result_Summary.pdf http://www.cawst.org/assets/File/BRAVO_Executive_Summary.pdf This study was conducted in the Arbonite Valley of Haiti in 2005. The study team investigated biosand filter use and performance among long-term users of the biosand filter (1-5 years) and new users (0 to 3 months). Water quality samples were taken from both groups and tested for turbidity and E. coli removal. Households were also surveyed to determine the community acceptance level and perceptions of the filter. There were 80 households included in the new user sample and 107 households included as long-term users. A more in depth write up of the long-term users was included as a Category 1 study in this summary document and published in the Journal of Rural and Remote Health. The major findings included: • Average flow rate of the long-term users was .6 L/min and 1.5 L/min for new users • Filter bacterial removal effectiveness was on average 98.5% for long-term users and 76% for new users • High flow rate through the biosand filter was found to indicate poor bacterial removal effectiveness • User perceptions were positive among both new and long-term users – easy to use, good smell and appearance of filtered water • 95% of users thought their filtered water was “improved” as compared to unfiltered water • 80% of users reported the health of their family had improved since drinking BSF water Summary of All Biosand Filter Lab and Field Testing Page 12 of 27 Version: 2008-01
- 13. • Filter is durable – no recurring costs to operate and maintain the BSF • Strong need to maintain quality control of sand when installing the filters – sand must be properly tested, prepared, and monitored to assure optimum bacterial removal effectiveness • Recontamination of filtered water was an issue in both long-term and new user households – safe water storage is critical After analyzing the data from this study and field experience, CAWST Recommends: • Sand media and flow rate monitoring • Safe water storage to prevent recontamination • Training Community Stewards/Promoters/Workers to influence hygiene and sanitation BSF Evaluation Report Samaritan’s Purse – 6 Country Study (2002) Nathan Kaiser, B.A., Kaida Liang, B.A., Marianne Maertens, B.Sc. Ryan Snider, B.A. M.Sc. Conducted in Honduras, Nicaragua, Mozambique, Kenya, Cambodia, & Vietnam Prepared for Samaritan's Purse Canada (Electronic version available through CAWST) This evaluation consisted of water analysis to determine fecal coliform removal on the biosand filter along with a user survey on almost 600 filters located in 6 countries on 3 continents. This study was done in the fall of 2001 and is the most rigorous study performed on the biosand filter. A brief summary of the Evaluation is as follows: • 98.4 % of all BSF recipients are using their filter on a regular basis. • 93.0 % of fecal coliform in the source water is removed by the BSF. • 88.5 % of all households surveyed uses their BSF every day. • 85.0 % of the households surveyed report that they would be drinking their water directly from the source if they did not own a BSF. • 98.1 % of the households surveyed report that the BSF has improved the health of their household. • 5.0 % of the households surveyed ranks their health BEFORE receiving a BSF as excellent. • 82.4 % of the households surveyed ranks their health AFTER receiving a BSF as excellent. The WHO Drinking Water Guidelines state that there can be no E. coli present in any drinking water sample. A system that could purify water to its purest state would include a multiple step water treatment process. Although disinfection is an important component to any water treatment program, raw water can not be treated with disinfection. The BSF is an essential step in meeting the WHO drinking water guidelines. The BSF Evaluation of Samaritan’s Purse projects discovered that the average fecal coliform removal rate under field conditions is 93%. Average Fecal Coliform Removal Rates for the Individual Countries Honduras 100 % Nicaragua 99 % Mozambique 98 % Kenya 94 % Summary of All Biosand Filter Lab and Field Testing Page 13 of 27 Version: 2008-01
- 14. Cambodia 83 % Vietnam 81 % World Average (sample size = 577) 93% Targeting Individuals: The Success of Household Sand Filtration (2000) Adriaan Mol; MEDAIR East Africa - Project in Kenya (Electronic version available through CAWST) Random testing of 110 installed filters showed an average E. coli removal rate of 93%. It has to be mentioned that this average was brought down by 6 samples with a count of less than 80%, caused by owners misusing the filter. Excluding these samples an average removal rate of 96% was established, while in all but 11 cases turbidity was reduced to less than 5 NTU. Except for 17 cases, drinking water was produced with less than 10 E. coli per 100 ml. Summary of All Biosand Filter Lab and Field Testing Page 14 of 27 Version: 2008-01
- 15. CATEGORY 4 – ANECDOTAL REPORTS/STUDIES Samaritan’s Purse Project in Ethiopia (2006) Source: Personal Communication • Filters showed a 97% reduction in E. coli - many had very high contamination to start • 80% reduction in turbidity • 96.8% of the people using the filters after at least one year • 94% know the maintenance when asked • 48% cleaned the spout • There was a 22% increase in handwashing (from 0% at the beginning) – so this shows that the hygiene is much harder to promote than using the filters • 78% of the users stored the water safely Key lessons learned: • Education – software is critical to get better results • Latrine construction requires more effort (were only able to be 2,800 pit latrines while they produced 7,500 filters - so many families still did not have latrines) • Awareness of filter maintenance (spout cleaning) needs more emphasis Note: this was an internal study by Samaritan’s Purse; results will not be published and are not available. Summary of All Biosand Filter Lab and Field Testing Page 15 of 27 Version: 2008-01
- 16. PART 2: KANCHANTM ARSENIC FILTER FIELD AND LABORATORY STUDIES CATEGORY 1 – PUBLISHED PAPERS KanchanTM Arsenic Filter (KAF) Project in Nepal – MIT and ENPHO (2005) Ngai, T., Shrestha, R., Dangol, B., Maharjan, M., & S. Murcott. “Design for Sustainable development – Household drinking water filter for arsenic and pathogen treatment in Nepal.” Journal of Environmental Science and Health Part A. (2007) 42, 1879-1888. Abstract available at:http://www.informaworld.com/smpp/content~content=a783095262~db=jour Ngai, T.; Dangol, B.; Murcott, S.; Shrestha, R.R. “KanchanTM Arsenic Filter – A Simple Solution for Arsenic Problem”. Massachusetts Institute of Technology (MIT) and Environment and Public Health Organization (ENPHO). Kathmandu, Nepal. ISBN: 99946-34-22-4. First edition. April 2005. Available at http://web.mit.edu/watsan/worldbank_summary.htm Ngai, T., Murcott, S., and Shrestha, R. “KanchanTM Arsenic Filter (KAF) – Research and Implementation of an Appropriate Drinking Water Solution for Rural Nepal.” Paper to the 9th Forum on Arsenic Contamination of Groundwater in Asia, Asia Arsenic Network and Research Group of Applied Geology. Japan. November 20-21, 2004. Available at http://web.mit.edu/watsan/Docs/Other%20Documents/KAF/Ngai%20- %20Asia%20Arsenic%20Network%20symposium%20paper%202004.pdf This project was funded by the World Bank Development Marketplace Global Competition 2003 and implemented as well as evaluated by Massachusetts Institute of Technology (MIT), USA and the Environment and Public Health Organization (ENPHO) of Nepal. Over 2500 KanchanTM Arsenic Filters were distributed by various agencies during the project period. Three versions of the KAF were distributed, namely concrete (over 900 units), Hilltake plastic (over 600 units), and Gem505 plastic (over 1000 units). Almost all of these filters are used by households affected by arsenic contamination in their drinking water. Two rounds of “blanket” monitoring of all existing filter were conducted. The first round monitoring took place between February 2004 to May 2004. The second round took place between Dec 2004 to February 2005. Parameters monitored during the first round including arsenic removal, iron removal, pH, flow rate, phosphate concentration, as well as GPS location, household demographic, filter cleaning frequency, filter usage rate, and user feedback. Arsenic removal was found to be excellent. Of the 966 filters tested for arsenic during round 1, over 95% of them were able to meet the Nepali arsenic interim standard of 50 ug/L. The average arsenic removal is in the range of 90-95%. The filters that showed unsatisfactory arsenic removal were later found to be defective. The filters were either installed incorrectly (e.g. use of incorrect sized sand and gravel), or improperly operated and maintained by the users. Summary of All Biosand Filter Lab and Field Testing Page 16 of 27 Version: 2008-01
- 17. Round 1 KAF monitoring results – Arsenic removal (n=966) Effluent Arsenic Concentration (ug/L) ND 10 20 30 40 50 60 70 80 90 100 150 200 250 300 350 400 450 500 500 5 2 0 0 1 0 0 0 0 0 0 0 0 0 0 0 0 0 0 Influent Arsenic Concentration (ug/L) 450 8 1 2 3 0 0 0 0 0 0 1 0 0 0 1 1 1 3 400 10 2 2 1 2 0 0 0 0 0 0 1 0 1 0 0 1 350 15 3 1 3 1 0 0 0 0 0 0 0 0 0 0 0 300 28 1 3 1 1 0 0 0 0 0 0 0 0 1 0 250 27 2 1 2 2 2 0 0 1 0 0 0 1 2 200 32 1 0 0 0 0 0 0 1 0 1 0 2 150 40 1 1 0 1 0 0 0 0 0 0 1 100 99 8 3 1 1 0 0 1 0 0 0 90 86 6 3 0 0 0 1 2 0 1 80 57 1 0 1 0 0 0 0 0 70 42 3 0 3 0 0 0 0 60 34 13 5 2 1 0 0 Figures indicate 50 71 5 2 0 0 0 number of filters 40 21 2 0 0 0 30 17 0 0 0 20 44 1 0 10 12 0 ND 189 Iron removal was also excellent. The average iron removal efficiency is about 90-95%. A few filters were unable to significantly remove iron. They were later found to be defective in the installation process as well. Round 1 KAF monitoring results – Iron removal (n=953) Effluent Iron Concentration (mg/L) Influent Iron Conc. (mg/L) ND 0.1 0.3 0.5 1 2 3 5 10 10 17 1 42 0 62 1 13 6 1 5 47 1 73 0 45 1 1 0 3 69 0 11 0 1 0 0 2 32 0 0 0 1 0 1 210 0 1 0 0 0.5 26 0 0 0 0.3 193 0 2 Figures indicate 0.1 2 0 number of filters ND 94 Summary of All Biosand Filter Lab and Field Testing Page 17 of 27 Version: 2008-01
- 18. The arsenic monitoring results during the round 2 monitoring round is unavailable at this moment. However, preliminary users feedback is tabulated below. Round 2 KAF monitoring results – Users Feedback (n=424) Yes Partially No Filter still in operation after 1 year 85.3% 8.3% 6.3% Users think filter operation is easy 73.6% --- 26.4% Users can operate the filter correctly 50.2% 42.3% 7.4% Users will recommend filter to others 82.5% --- 17.5% Better Same Worse Appearance of filtered water 92.8% 6.9% 0.2% Taste of filtered water 95.0% 5.0% 0% Smell of filtered water 89.9% 11.1% 0% Users’ perceived health conditions 77.5% 22.5% 0% after drinking filtered water Summary of All Biosand Filter Lab and Field Testing Page 18 of 27 Version: 2008-01
- 19. CATEGORY 2 – HIGH QUALITY UNPUBLISHED PAPERS 4 Week Daily Study on Total Coliform Removal of the KAF (2005) Dipina Sharma Source: Bachelor of Science Thesis- Kathmandu University Available at http://web.mit.edu/watsan/worldbank_summary.htm • Installed 5 KAF (plastic Gem505 version) in the village of Kasiya of Nawalparasi districts of Nepal • 40 L of tube well water poured into each filter per day • Tested total coliform removal over a 4-weeks period using membrane filtration technique • 4 of the 5 filters achieved 96-100% total coliforms removal within 3 weeks since installation, of which one filter achieved 100% total coliform removal in just 9 days. • The remaining one of the 5 filters shows unsatisfactory total coliform removal is believed to be related to insufficient sand cleaning. • The use of a clean storage container and good hygiene practise was found to improve filtered water quality. Can Iron and Arsenic Particles Migrate through the KAF Sand Layer? (2005) Bardan Ghimire Source: Masters Thesis, Kathmandu Universit Available at http://web.mit.edu/watsan/worldbank_summary.htm • Two older concrete filters (12-months of operation) and two newer concrete filters (5-months of operation) in the Terai region of Nepal were studied. • Sand samples were collected at every 4 cm interval from the top to the bottom of the sand layer. • Arsenic and iron concentrations on these sand samples were tested using laboratory AAS method. • Iron and arsenic appear to be effectively trapped on top of the fine sand • The low and similar iron and arsenic values found in the region 5cm or lower appear to be background concentration • The significantly lower arsenic-to-iron ratio at 5cm depth or lower further confirms that arsenic-loaded iron particles are NOT migrating down through the sand media • The similarity in the profiles of older (12-months) and newer (5-months) filters suggest that the profiles may not change over time Arsenic, Iron and Coliform Removal Efficiency of KAF (2004) Prem Krishna Shrestha Source: Masters Thesis, Tribhuvan University, Nepal Available at http://web.mit.edu/watsan/worldbank_summary.htm • Tested arsenic, iron, and coliforms removal of the KAF Gem505 version through 3 rounds of study. • Phase I laboratory study used groundwater from Kathmandu spiked with arsenic • Phase II laboratory study used tap water from Kathmandu spiked with arsenic Summary of All Biosand Filter Lab and Field Testing Page 19 of 27 Version: 2008-01
- 20. • Phase III field study used naturally occurring arsenic-contaminated water in the Terai region of Nepal. • Phase I study found that arsenic removal is less than 50% because of phosphate interference. Phosphate in the Kathmandu groundwater was 31 ppm. • Phase II study found that arsenic removal is 85%. Phosphate concentration in Kathmandu tap water is only 0.4 ppm. • Phase III study found that for naturally-occurring groundwater contaminated by arsenic, the arsenic removal is the best, at 91%. • Laboratory study shows 94% removal of total coliform KAF Study on Effect of Air Space between the Resting Water and the Diffuser Basin (2004) Shashank Pandey Source: Bachelors Thesis, Kathmandu University, Nepal Available at http://web.mit.edu/watsan/worldbank_summary.htm • 4 KAF Hilltake versions located in a rural village of Nawalparasi district were studies • Raw water of 250 ppb arsenic was poured into the filter for 4 cycles • Filtered water was continually collected and monitored (one sample for every 2L filtered) • Research found that there is no fluctuation in arsenic concentration within short timeframe. • The arsenic concentration is either non-detect or 10 ppb in majority of the filtered samples. • Research suggests that arsenic removal is happening at two locations – adsorption on iron nails in the diffuser box, and adsorption on iron particles accumulated on the fine sand Performance Evaluation of the Arsenic Biosand Filter for Mitigation of Arsenic Contamination (2004) Naomi Odell; US Peace Corps volunteer - Parasi, Nepal, April 2004 (Available at http://web.mit.edu/watsan/worldbank_summary.htm) • Two concrete version of the KAF were studies in the rural town of Parasi. • One filter has 2.5 kg of iron nails • One filter has 5.0 kg of iron nails • Study recommended the use of 5.0 kg of iron nails for effective arsenic removal • Over 95% of arsenic can be removed in the KAF with 5.0 kg of iron nails. • 4-months is too short a time to observe any noticeable decrease in iron nails’ arsenic adsorption capacity Summary of All Biosand Filter Lab and Field Testing Page 20 of 27 Version: 2008-01
- 21. Arsenic Biosand Filter: Design of an Appropriate Household Drinking Water Filter (2003) Tommy Ngai and Sophie Walewjik Source: Final Report Submitted to Massachusetts Institute of Technology in July 2003. Available at http://web.mit.edu/watsan/worldbank_summary.htm Technical Range Average • Pilot study -16 concrete filters in 4 Indicator Results rural villages (Nawalparasi and Rupendehi districts) installed in Oct Arsenic removal 87 to 96% 93% 2002. • Evaluation in Jan 2003 showed : Total coliform 0 to >99% 58% removal E. Coli removal 0 to >99% 64% Iron removal >90 to > >93% 99% Flow rate 4 to 23 L/hr 14 L/hr Summary of All Biosand Filter Lab and Field Testing Page 21 of 27 Version: 2008-01
- 22. PART 3: SUMMARY TABLES OF FIELD AND LABORATORY STUDIES Table 1: Biosand Filter Field and Laboratory Tests Country Author(s) Organization(s) Year Type of Category † Key Lessons Learned Study - Baumgartner, Harvard School of 2007 Laboratory 1 • Encourage users to filter 5 L of J. Public Health; water at a time Massachusetts • When filtering more than 5 L at a Institute of time, use first five liters for Technology (MIT) consumption and the remainder for other household needs Dominican Stauber, C. University of North 2006 Field Study 1 • Ripening time of filter varies, Republic Elliot, M. Carolina probably due to influent water quality • 95-98% reduction of E. coli in a ripened filter Haiti Duke, W. University of 2006 Cross-sectional 1 98.5% removal of E. coli on Baker, D. Victoria, BC; evaluation average in sample of 107 filters CAWST Kenya Fewster, E. Medair 2004 Cross-sectional 1 • 70.5% of filters achieved 0-10 Mol, A. evaluation faecal coliforms per 100 mL • 82.4% of filters achieved <10 NTU for turbidity - Palmateer, National Water 1997 Laboratory 1 • 83% removal of heterotrophic G. Research Institute bacterial populations, Manz, D. Canada • Removed 100% of Giardia cysts • Removed 99.98% of Cryptosporidium oocysts • Removed 50-90% of organic and inorganic toxicants † Category Key 1 - Peer reviewed, published papers; 2 - High quality, unpublished papers; 3 - Informal reports (field study, PowerPoint presentation, press release, personal communication); 4 - Anecdotal reports/studies Summary of All Biosand Filter Lab and Field Testing Page 22 of 27 Version: 2008-01
- 23. Country Author(s) Organization(s) Year Type of Category † Key Lessons Learned Study Ethiopia Earwater, P. Cranfield 2006 Cross-sectional 2 Quality of maintenance, lack of University Silsoe evaluation educational message reinforcement and lack of support provided to filter users contributed to low usage and poor filter performance in some villages Nepal Lee, T. MIT 2001 Cross-sectional 2 • 83% removal of E. coli in a Paynter, N. sample of 38 filters • 23% of filters were found to be in poor condition – diffuser plate problems, incorrect resting water level, or immature biofilm - Buzanis, B. University of 1995 Laboratory 2 • First laboratory study of Calgary intermittent slow sand filter • Fecal coliform removal efficiency of 96% and turbidity removal efficiency to <1 NTU Nicaragua Manz, D. University of 1993 Field evaluation 2 Original BSF study showed Buzanis, B. Calgary intermittent slow sand filter has Morales, C. high removal efficiency in 55 filters Cambodia Liang, K. University of North 2007 Cross-sectional 3 • Biosand filters have a long Sobsey, MD Carolina evaluation lifespan and low breakage rate • Need to design appropriate software (education) and hardware (containers) to prevent recontamination within the home † Category Key 1 - Peer reviewed, published papers; 2 - High quality, unpublished papers; 3 - Informal reports (field study, PowerPoint presentation, press release, personal communication); 4 - Anecdotal reports/studies Summary of All Biosand Filter Lab and Field Testing Page 23 of 27 Version: 2008-01
- 24. Country Author(s) Organization(s) Year Type of Category † Key Lessons Learned Study Honduras Miller, K. Pure Water for the 2007 Cross-sectional 3 • 74.1% of filters still in use World evaluation • 35% of users knew how to properly maintain the filter Nicaragua Vanderzwaa University of 2007 Field evaluation 3 • 10% of the original filters were g, J. British Columbia still in operation (after 1999 & 2004 installation) • Lack of awareness, education and training contributed to poor maintenance and operation and recontamination of filtered water Haiti Baker, D. CAWST 2006 Field Evaluation 3 • High flow rate through BSF Duke, W. found to indicate poor bacterial removal effectiveness • Need to maintain quality of sand media to ensure effective BSF • Recontamination is an issue Kenya, Kaiser, N. Samaritan’s Purse 2002 Cross-sectional 3 • Average fecal coliform removal Mozambique, Liang, K. Canada evaluation rate across all 6 countries was Cambodia, Maertens, M. 93% in sample of 577 filters Vietnam, Snider, R. • 88.5% of households used filter Honduras, everyday Nicaragua • O&M info to users needs to be improved - additional follow-up visits and increased frequency of visits Kenya Mol, A. Medair 2000 Cross-sectional 3 • Random testing of 110 filters evaluation showed E. coli removal rate of 93% • 90% of samples turbidity <5 NTU † Category Key 1 - Peer reviewed, published papers; 2 - High quality, unpublished papers; 3 - Informal reports (field study, PowerPoint presentation, press release, personal communication); 4 - Anecdotal reports/studies Summary of All Biosand Filter Lab and Field Testing Page 24 of 27 Version: 2008-01
- 25. Country Author(s) Organization(s) Year Type of Category † Key Lessons Learned Study Ethiopia - Samaritan’s Purse 2006 Cross-sectional 4 • Education – software is critical to evaluation get better results • Awareness of filter maintenance (spout cleaning) needs more emphasis † Category Key 1 - Peer reviewed, published papers; 2 - High quality, unpublished papers; 3 - Informal reports (field study, PowerPoint presentation, press release, personal communication); 4 - Anecdotal reports/studies Summary of All Biosand Filter Lab and Field Testing Page 25 of 27 Version: 2008-01
- 26. Table 2: Biosand Filter Health Impact Studies Country Author(s) Organization(s) Year Type of Category † Key Lessons Learned Study Cambodia Liang, K. University of North 2007 Longitudinal, 3 • For children under 5 and adults, there Sobsey, MD Carolina prospective was a 44% reduction in the number of cohort study cases of diarrhea • Greatest reduction occurred in children ages 2-4 - 46% reduction Dominican Stauber, C. University of North 2006 Longitudinal, 3 • For children under 5 and all age Republic Sobsey, MD Carolina prospective groups there was a 30-40% reduction cohort study in the number of cases of diarrhea † Category Key 1 - Peer reviewed, published papers; 2 - High quality, unpublished papers; 3 - Informal reports (field study, PowerPoint presentation, press release, personal communication); 4 - Anecdotal reports/studies Summary of All Biosand Filter Lab and Field Testing Page 26 of 27 Version: 2008-01
- 27. Table 3: KanchanTM Arsenic Filter Field and Laboratory Studies Country Author(s) Organization(s) Year Type of Study Category † Key Lessons Learned Nepal Ngai, T. Massachusetts 2005 Cross-sectional 1 • 95% of 966 filters met the Nepali Dangol, B. Institute of evaluation arsenic interim standard Murcott, S. Technology (MIT) • Average arsenic and iron removal ENPHO efficiency was in the range of 90-95% World Bank • 85.3% of users were retained after 1 year Nepal Sharma, D. Kathmandu 2005 Laboratory 2 Removal of total coliforms in 5 filters University showed 4/5 filters removed 96-100% Nepal Ghimire, B. Kathmandu 2005 Laboratory 2 • Iron and arsenic appear to be University effectively trapped on top of the fine sand in 4 filters (2 old, 2 new) Nepal Shrestha, Kathmandu 2004 Laboratory 2 • Arsenic removal is the best for PK University naturally-occurring groundwater contaminated with arsenic, at 91% • Laboratory study shows 94% removal of total coliform Nepal Pandey, S. Kathmandu 2004 Field study 2 Arsenic removal is occurring at two University locations – adsorption on iron nails and on iron particles accumulated on the fine sand Nepal Odell, N. US Peace Corps 2004 Field study 2 • Over 95% of arsenic can be removed in the KAF with 5.0 kg of iron nails • Recommend use of 5.0 kg iron nails Nepal Ngai, T. MIT 2003 Field study 2 • Arsenic removal on average 93% in 16 Walewjik, S. pilot filters • Iron removal - >93% on average † Category Key 1 - Peer reviewed, published papers; 2 - High quality, unpublished papers; 3 - Informal reports (field study, PowerPoint presentation, press release, personal communication); 4 - Anecdotal reports/studies Summary of All Biosand Filter Lab and Field Testing Page 27 of 27 Version: 2008-01