Modelling the Atomic and Molecular Gas in Galaxies and Comparisons wih GASS and COLD GASS Results
•
1 like•727 views


Recommended
Recommended
More Related Content
What's hot
What's hot (20)
Viewers also liked
Viewers also liked (17)
Similar to Modelling the Atomic and Molecular Gas in Galaxies and Comparisons wih GASS and COLD GASS Results
Similar to Modelling the Atomic and Molecular Gas in Galaxies and Comparisons wih GASS and COLD GASS Results (20)
More from CosmoAIMS Bassett
More from CosmoAIMS Bassett (20)
Recently uploaded
Recently uploaded (20)
Modelling the Atomic and Molecular Gas in Galaxies and Comparisons wih GASS and COLD GASS Results
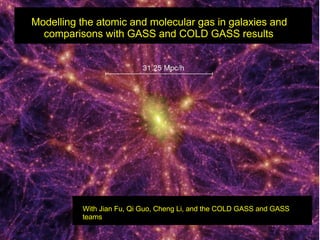
- 1. z=0Modelling the atomic and molecular gas in galaxies and comparisons with GASS and COLD GASS results With Jian Fu, Qi Guo, Cheng Li, and the COLD GASS and GASS teams
- 4. GALAXY SELECTION a) Redshift range : 0.025 < z < 0.05 Motivation: 1) We want to detect HI and H2 down to levels of a few percent in M(gas)/M* in about an hour of integration time. 2) We want to get an accurate estimate of the total cold gas mass with a single pointing of both the Arecibo and IRAM telescopes. b) Stellar mass range: log M* > 10 Motivation: 1) Span a range of stellar masses encompassing both “active” star-forming galaxies and “passive” systems => quantify how the transition between these two populations is reflected in their cold gas content. Avoid any selection on morphology, environment etc. 2) In the mass range, all galaxies have roughly solar metallicity: conversion factor from CO luminosity to H2 mass is simplified. OBSERVING STRATEGY: Integrate until the galaxy is detected or a limiting HI/H2 mass fraction ~1.5-3% is reached, i.e. Our survey will quantify the full condensed baryon budget in these galaxies.
- 5. MILLENNIUM-II Simulations (Boylan-Kolchin et al 2009)
- 7. Models are based on the L-Galaxies Code developed by Springel, Croton, De Lucia, Guo et al.
- 8. Radially Resolved Models for Galactic Disk Formation Scale radius of the infalling gas is proportional to λ Rvir (following Fall & Efstathioiu 1980; Mo, Mao, White 1998) The gas that falls is at one snapshot is simply superposed on the gas that has already fallen in at earlier times.
- 9. Krumholz, McKee and Tumlinson 2009 Blitz & Rosolowsky 2004,2006
- 10. Comparison of Model Profiles with THINGS/ HERACLES data from Bigiel et al 2008 GAS PROFILES ARE TOO FLAT AND THE MOLECULAR GAS IS RAPIDLY CONSUMED IN THE INNER DISK. PROBLEM CANNOT BE SOLVED BY ADJUSTING FREE PARAMETERS.
- 11. Comparison of Model Profiles with THINGS/ HERACLES data from Bigiel et al 2008 IF ENERGY FROM SUPERNOVA IS MORE EFFICIENTLY DISSIPATED IN DENSE INNER REGIONS OF THE DISK (i.e. LESS COLD GAS IS REHEATED ), THEN MODELS CAN FIT DATA. Caveat: Radial inflow of gas has not been considered
- 12. The Models Provide a Reasonable Match to the Observed Mass Functions of HI, H2 and Stars in the Local Universe
- 13. It is interesting to consider the global scaling relations between stellar mass, stomic gas mass and molecular gas mass for an ensemble of disk galaxies
- 14. What Are the Physical Drivers of these Scaling Relations? 1) The MASS OF THE DARK MATTER HALO determines the mass of baryons that is able to cool. Because supernovae feedback is less efficient in massive halos, a larger fraction of the baryons that cool are converted into stars.
- 15. What Are the Physical Drivers of these Scaling Relations? 1) The SPIN PARAMETER sets the contraction factor of the infalling gas. A higher spin parameter results in larger galaxies with lower gas surface densities.
- 16. What Are the Physical Drivers of these Scaling Relations? 1) The FRACTION OF GAS in the galaxy that was ACCRETED recently (i.e. Gas that has has less time to be turned into stars).
- 17. COMPARE WITH DR2 FROM THE COLD GASS SURVEY (300 galaxoes with both HI observations from Arecibo and CO 1-0 observations from the IRAM 30m telescope)
- 18. BLUE: Arecibo/IRAM detections RED: Arecibo/IRAM non-detections
- 19. PROCEDURE: 1) Analyze detections and non-detections separately. 2) Analysis of population of galaxies with detected HI/CO allows us to test the disk formation models . 3) Analysis of galaxies without detected gas allows us to test whether “quenching” processes (in particular radio-mode AGN feedback) operates the same way in the models and in the data.
- 20. Comparison of Mean HI and H2 scaling relations Atomic Gas Molecular Gas
- 21. Saintonge et al 2011 Molecular gas depletion times are shorter in more actively star- forming galaxies
- 22. Distribution Functions of the HI detections in bins of mass, stellar mass density, concentration
- 23. Trends in non-detected fraction do NOT agree with the models Fraction of non- detections is independent of stellar mass in the data, but depends strongly on stellar surface density and concentration (i.e. Bulge-to-disk ratio)
- 24. In the models, “radio-mode” AGN feedback prevents gas from cooling in massive galaxies (with black holes) located in halos above ~10^11 M_sun. Observationally, this is manifested as a strong threshold in STELLAR MASS
- 25. H2 detections and non-detections in 2-dimensional planes of stellar mass and galaxy structural parameters
- 26. Natural interpretation of the results: processes associated with the formation of galactic bulges and or black holes are most directly responsible for shutting down star formation in galaxies.
- 27. PHOTOMETRIC INDICATORS OF ATOMIC GAS CONTENT
- 28. UGC 8802: A Case Study of a Star-Forming Outlier from the HI “plane”, with unusually high HI fraction M(HI) = 2 x 10 10 M_sol Moran et al 2010
- 29. As the HI gas fraction increases, galaxies become bluer on the outside relative to the inside. This effect is weaker in control samples matched in stellar mass, structural parameters and specific star formation rate. Wang et al 2011
- 30. Preliminary work with Cheng Li: Find best photometric “predictors” of the HI content of a galaxy Update of HI gas fraction “plane” to include a colour gradient term -- gives much more accurate predictions for high Hi fraction galaxies.
- 31. GASS-SDSS cross-correlation functions: “real” versus “predicted” What is this useful for? Creating mock catalogues – tuning up future surveys with real data!