Falsifying Cosmic Acceleration Models with Galaxy Clusters
1. Falsifying Paradigms
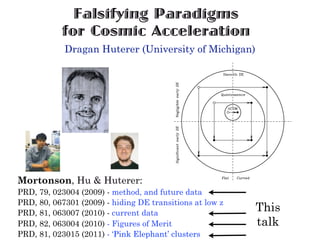
for Cosmic Acceleration
Dragan Huterer (University of Michigan)
Mortonson, Hu & Huterer:
PRD, 79, 023004 (2009) - method, and future data
PRD, 80, 067301 (2009) - hiding DE transitions at low z
PRD, 81, 063007 (2010) - current data
This
PRD, 82, 063004 (2010) - Figures of Merit talk
PRD, 81, 023015 (2011) - ‘Pink Elephant’ clusters
2.
3. 1
always accelerates
0.5 accelerates now
! (m-M)
decelerates in the past
0
open
flat
-0.5
always decelerates closed
0 0.5 1 1.5 2
Redshift z
Using Union2 SN data (Amanullah et al 2010) binned in redshift
5. Underlying Philosophy
• The data are now consistent with LCDM, but that may
change.
• So, what observational strategies do we use to determine
which violation of Occam’s Razor has the nature served us?
• Possible alternatives: w(z) ≠ -1, early DE, curvature ≠ 0,
modified gravity, more than one of the above (?!)
• Goal: to calculate predicted ranges in fundamental
cosmological functions D(z), H(z), G(z), (and any other
parameters/functions of interest), given current or future
observations
• ... and therefore to provide ‘target’ quantities/redshifts for
ruling out classes of DE models with upcoming data
(BigBOSS, DES, LSST, space mission, ..........)
6. DE Models and their complexity
(-5≤w(z)≤3)
(-1≤w(z)≤1)
7. Modeling of DE
Modeling of low-z w(z):
Principal Components
500 bins (so 500 PCs)
0.03<z<1.7
We use first ~10 PCs;
(results converge 10→15)
Fit of a quintessence
model with PCs
8. Modeling of Early DE
(de Putter & Linder 2008) 3(1+w∞ )
1+z
ρDE (z zmax ) = ρDE (zmax )
1 + zmax
Early DE - current constraints
•ΩDE(zrec) 0.03 (CMB peaks; Doran, Robbers Wetterich 2007)
•ΩDE(zBBN)0.05 (BBN; Bean, Hansen Melchiorri 2001)
Modeling of Modified Gravity
(Linder 2005)
a
G(a) = exp d ln a [Ωγ (a ) − 1]
M
0
Advantage: γ≈0.55 for any GR model (small corrections for w(z)≠-1)
Advantage: extremely easy to implement
Disadvantage: actual MG growth may be scale-dependent
9. Methodology
1. Start with the parameter set:
ΩM , ΩK , H0 , w(z), w∞
2. Use either the current data or future data
3. Employ the likelihood machine
Markov Chain Monte Carlo likelihood calculation,
between ~2 and ~15 parameters constrained
4. Compute predictions for D(z), G(z), H(z) (and γ(z), f(z))
10. Cosmological Functions
Expansion Rate (BAO):
1/2
ρDE (z)
H(z) = H0 ΩM (1 + z) + ΩDE
3
+ ΩK (1 + z)2
ρDE (0)
Distance (SN, BAO, CMB):
z
1 dz
D(z) = S (|ΩK |H0 )
2 )1/2 K
2 1/2
(|ΩK |H0 0 H(z )
Growth (WL, clusters):
H
H
3
G + 4+
G + 3+
− ΩM (z) G = 0
H H 2
G = D1 /a
12. Structure of graphs to follow
!#$%'%()*+,(-+.%*'/)#*
Prediction on observable
(given data) by SNe+CMB Pivot
(around fiducial, or best-fit)
Max extent of
SN data
Sketch by M. Mortonson
14. Predictions from Future Data
Assumed “data”:
1. SNAP 2000 SNe, 0.1z1.7
(plus 300 low-z SNe);
converted into distances
2. Planck info on Ωmh2 and DA(zrec)
2
0.1 0.15
2
1+z
2
σα = + 0.022
∆zsub 2.7
Dead Alive Nα
Predictions below shown
around:
fiducial model
15. a
e dat
Futur
LCDM predictions
(flat or curved)
Grey: flat
Blue: curved
D, G to 1% everywhere
H(z=1) to 0.1% for flat LCDM
16. a
e dat
Futur Quintessence
predictions (flat)
Grey: no Early DE
Blue: with Early DE
Smoking Gun of EDE:
Uniform suppression in G
17. a
e dat
utur
F Quintessence
predictions (no EDE)
Grey: flat
Blue: curved
Smoking Gun of curvature:
1. Shift in G0
2. Negative const offset in D
18. a
e dat
utur
F Quintessence
predictions
with curvature and EDE
Smoking Gun:
Large negative deviation in G
Note even in this general class,
firm predictions: e.g.,
G and D can’t be LCDM value
19. Smooth DE with curvature and/or Early DE
Some quantities
are accurately predicted
even in very general classes
of DE models
(e.g. specific linear combination of G0
and G evaluated at z=1 vs z=zmax)
20. Predictions from Current Data
- SN Union compilation
- Full WMAP power spectrum
- DBAO(z=0.35) to ~3% from SDSS (adding 2dF ⇒ little diff)
- H0 from SHOES (Riess et al): (74±3.6) km/s/Mpc; apply at z=0.04
Predictions below shown around:
best-fit LCDM model
26. From current and future data,
projected down on w0-wa
ΩK=0
(68% CL)
27. In principal, constraints are good...
(components)
values for example
Top row: quintessence model
Current Data
Bottom Row:
Future Data Flat
(assumes αi=0) Curved
28. Figures of Merit (FoMs)
The most common choice:
area of the (95%) ellipse in the w0-wa plane
(DETF report 2006, Huterer Turner 2001)
6.17π
FoM ≡ (det Cw0 wa ) −1/2
≈
wa 95% C.L. A95
Or, simply:
1
FoM ≡
σwpivot × σwa
w0
29. Generalizing FoM to many parameters - PCs of w(z)
−1/2
det Cn
FoM(PC)
n ≡ (prior)
det Cn
(proportional to volume
of n-dim ellipsoid)
Future/current ratio
30. Falsifying LCDM and Quintessence
with “pink elephant” clusters
56 30
Pink Elephant:
- any of various visual
hallucinations sometimes
00
experienced as a
Declination (2000)
57 30
withdrawal symptom
00 after sustained alcoholic
drinking.
58 30
-Dictionary.com
0.1 h-1 Mpc
70
z = 1.393
-25! 59 00
26s 24s 22s 20s 18s 22h 35m 16s
Right Ascension (2000)
Mortonson, Hu Huterer: arXiv:1004.0236
31. Cluster number counts: basics
mass function;
calibrated from simulations = dV / (dΩdz); exactly
to ~10% accuracy predictable given
a cosmological model
d2 N r(z)2
= n(z)
dΩ dz H(z) 5 ΩM=1, ΩDE=0
10
w=-0.8
dN/dz (4000 deg )
2 10
4
observed
3
10
ΩM=0.3, ΩDE=0.7, w=-1
2
10
0 0.5 1 1.5 2
z
• Essentially fully in the nonlinear regime (scales ~few Mpc)
32. Pink elephant, candidate 1:
SPT-CL J0546-5345
Brodwin et al, arXiv:1006.5639 optical (grz); contours are SZ optical (ri)+IRAC; contours are X-ray
z=1.067
M ≈ (8±1)·1014 Msun
SPT-CL J0546-5345: A Massive z 1 Galaxy Cluster Selected Via the SZE 7
TABLE 2
Comparison of Mass Measurements for SPT-CL J0546-5345
Mass Scaling M200 a,b
Mass Type Proxy Measurement Units Relation (1014 M )
+6.1
Dispersion Biweight 1179 +232
−167 km/s σ–M200 (Evrard et al. 2008) 10.4 −4.4
Gapper 1170 +240
−128 km/s σ–M200 (Evrard et al. 2008) 10.1 +6.2
−3.3
Std Deviation 1138 +205
−132 km/s σ–M200 (Evrard et al. 2008) 9.3 +5.0
−3.2
X-ray YX 5.3 ± 1.0 ×10¹⁴ M keV YX –M500 (Vikhlinin et al. 2009) 8.23 ± 1.21
TX 7.5 +1.7
−1.1 keV TX –M500 (Vikhlinin et al. 2009) 8.11 ± 1.89
SZE YSZ 3.5 ± 0.6 ×10¹⁴ M keV YSZ – M500 (A10) 7.19 ± 1.51
S/N at 150 GHz 7.69 ξ – M500 (V10) 5.03 ± 1.13 ± 0.77
Richness N200 80 ± 31 galaxies N200 – M200 (H10) 8.5 ± 5.7 ± 2.5
Ngal 66 ± 7 galaxies Ngal – M200 (H10) 9.2 ± 4.9 ± 2.7
Best Combined 7.95 ± 0.92
34. Pink elephant, candidate 3:
SPT-CL J2106-5844
z=1.132
Foley et al 2011
MSZ+x-ray ≈ (1.27±0.21)·1015 Msun Williamson et al. 2011
4 Foley et al.
35. Two sources of statistical uncertainty
1. Sample variance - the Poisson noise in
counting rare objects in a finite volume
2. Parameter variance - uncertainty due
to fact that current data allow cosmological
parameters to take a range of values
36. Parameter variance
(due to uncertainty in cosmo parameters)
95% sample
variance limit for
seeing ≥1 clusters
(and for fsky=1)
37. Predicted abundance for
M 10 15h-1 M
sun, z 1.48
95% sample variance
limit for fsky=1
95% parameter variance
limit
(in each case)
Rule out ΛCDM ⇒ automatically rule out quintessence
38. Eddington bias
A.S. Eddington, MNRAS, 1913
For a steeply falling mass function,
observed mass was more likely to be scattered into
observed range from lower M than for higher M
(≠ Malmquist bias: more luminous objects are more likely to scatter into the sample)
dn/dlnM Δ ln(M) = (γ/2) σlnM2
log slope of MF
Mobs±ΔMobs
dlnM
39. Results for the two pink elephant clusters vs.
predictions for LCDM
Shown limits:
95% both
sample and
parameter
variance
black error bars:
masses
corrected for
Eddington bias
41. Potentially useful product of paper:
Fitting formulae to evaluate Nclusters that rule
out LCDM at a given
✓ mass and redshift
e.g. Williamson et al. 2011
✓ sample variance confidence (SPT)
✓ parameter variance confidence
✓ fsky
42. Conclusions I: Falsifying DE
• Current (and, esp, future) data lead to strong
predictions for D(z), G(z), H(z)
• Examples:
• Flat LCDM: H(z=1) to 0.1%, D(z), G(z) to
1% everywhere
• Quint: D(z), G(z) to 5%; one-sided
deviations
• Smooth DE: tight consistency relations can
still be found
• GR tests: to 5% (~0.02) even with
arbitrary w(z)
• Total FoM=det(Cov) -1/2 improvement of 100
in the future
• it’s wise to keep eyes open for mode exotic DE
(and measuring PCs 3, 4, 5, 6...)
43. Conclusions II: ‘Pink Elephants’
• It’s important to be careful about the various statistical,
not just systematic, effects in analyzing the abundance of
rare, massive and distant clusters
• In particular, we find that the following effects have
major effect on their likelihood
• Parameter variance (in addition to sample variance)
• Fair assessment of f sky
• Eddington bias
• So far none of the detected clusters rules out any models
(contrary to some claims in the literature)
• If an unusually massive/distant observed cluster observed
tomorrow rules out LCDM, it will rule out quintessence at
the same time