Recomendados

Recomendados
Mais conteúdo relacionado
Mais procurados
Mais procurados (20)
Destaque
Semelhante a Colleen Gabel Independent Study Poster
Semelhante a Colleen Gabel Independent Study Poster (20)
Colleen Gabel Independent Study Poster
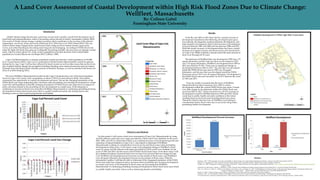
- 1. A Land Cover Assessment of Coastal Development within High Risk Flood Zones Due to Climate Change: Wellfleet, Massachusetts By: Colleen Gabel Framingham State University Introduction Global climate change has become a growing concern and is mostly a result from the human use of fossil fuels and industrialization, which is increasing carbon dioxide in Earth’s atmosphere (Hardy 2003). One result of Global climate change is global warming which contributes to the increase of the planet’s temperature, sea levels, wind, and waves (Dobrynin et al. 2014; Frey et al. 2010; Prasad 2012). One can observe theses major changes from coastal areas where rising sea level, intense storms, large ocean waves, and urban flooding are becoming more frequent and damaging. According to FEMA flood zone maps the high risk flood zone areas are continually increasing annually. Sea level rise can damage coastal areas, which is where about 10% of the world’s population is located and half of the United States population is located (Byaravan and Rajan 2015; Culliton, 1998). Cape Cod Massachusetts is a densely populated coastal area that has a total population of 215,888 (U.S. Census Bureau 2010). Cape Cod is a peninsula in South-Eastern Massachusetts created by glaciers during the Ice Age. Cape Cod has been affected by beach erosion as well as other issues that sea level rise due to global climate change has prompted including: flooding, more intense hurricanes and nor’easters. Damages from flooding include unstable ground, foundation damage, as well as potential total home loss (Frey et al.2010; Boateng 2011). The town Wellfleet, Massachusetts located on the Cape Cod peninsula is one of the least populated towns in Cape Cod County with a population of about 2,750 (Us Census Bureau 2010). This smaller community has opportunity to expand development and grow. But are the changing boundaries of the FEMA flood zone maps impacting policy decisions when permitting new housing development in coastal areas? My null hypothesis is that the changing boundaries of FEMA flood zone maps have no impact on policy decisions related to the permitting of new development in coastal areas. If development is continuing to increase in flood zone areas then Wellfleet, Massachusetts is continuing permitting housing development in those flood zones area which is a public health and safety risk during storms and flooding events as well as destroying beaches and habitat. References -Boateng, I. 2011. “GIS assessment of coastal vulnerability to climate change and coastal adaption planning in Vietnam.” Journal of Coastal Conservation 16:25-36. -Byravan, S., and Rajan, S.C. 2015. “Sea level rise and climate change exiles: A possible solution.” Bulletin of the Atomic Scientists 71(2):21-28. -Culliton, T.J. 1998. “Population: Distribution, Density and Growth.” National Oceanic and Atmospheric Administration (NOAA). <http://state_of_coast.noaa.gov/bulletins/html/pop_01/pop.html> (April 17, 2015). -Dobrynin, M., Murawski, J., Baehr, J., and Ilyina, T. 2014. “Detection and Attribution of Climate Change Signal in Ocean Wind Waves.” Journal of Climate 28:1578-1591. -Frey, A.E., Olivera, F., Irish, J.L., Dunkin, L.M., Kaihatu, J.M., Ferrira, C.M., and Edge, B.L. 2010. “Potential Impact of Climate Change on Hurricane Flooding Inundation, Population Affected and Property Damages in Corpus Christi.” Journal of the American Water Resources Association 46(5):1049-1059. -Hardy, J.T. 2003. “Climate Change: Cause, Effects, and Solutions.” John Wiley and Sons, Chichester, West Sussex England. -Prasad, S. 2012. “An Assessment of Human Vulnerability to Hazards in the US Coastal Northeast and Mid-Atlantic.” Southeastern Geographer 52(3):282-298. -U.S Census Bureau. American Community Survey. 2010 American Community Survey 5-year Estimates. Using STATS CapeCod; http://www.statscapecod.org/>. (April 4, 2015). Objective and Methods For this project I will create a land cover assessment of Cape Cod, Massachusetts by using ArcGIS software with land cover maps provided by USGS Land Cover Institute for the years 2001, 2006, and 2011 to determine if there is an continual increase of development growth and reduction of natural habitats in Cape Cod. I also intend to determine if Wellfleet, Massachusetts is taking in consideration of sea level rise and flood zones when permitting development in their town. I will create a map of development change in Wellfleet’s flood zones by using ArcGIS software with maps provided by USGS Land Cover Institute for the years of 1992 and 2011 and the most current FEMA flood hazard map. From these maps I will do a statistical analysis of percent land cover in Cape Cod, percent land use change in Cape Cod, Wellfleet's development percent increase in and outside of flood zones, and Wellfleet's over all square kilometer development increase in and outside of flood zones. With the information I gather I will then be able to determine if the changing boundaries of the FEMA flood zone maps have impacted policy decisions when permitting new housing development in coastal zone areas. If development in flood zones are increasing then Wellfleet, Massachusetts is continuing permitting housing development in those flood zones area which is a public health and safety risk as well as destroying beaches and habitat. Results From the year 2001 to 2011 there had be a steady increase of development classified as the following; developed open space, low intensity development, medium intensity development, and high intensity development. Most of this increase of development occurred between 2001 and 2006 and less between 2006 and 2011. With this steady increase of development there has been a steady decrease of evergreen forests, deciduous forest, and mixed forest on Cape Cod. While wetlands consume about the same amount of land cover through all 10 years. The total area of Wellfleet that was developed in 1992 was 1.72 square kilometers and the total area that was developed in 2011 was 3.32 square kilometers. Wellfleet’s development from 1992 to 2011 increased by 93.32%. There was no significant change in development between 2001 to 2011. The area that was developed inside the FEMA flood zone area in 1992 was .04 square kilometers, and the area that was developed inside the FEMA flood zone area in 2011 was .05 square kilometers. Development in the FEMA flood zone area increased by 26.21% between the years of 1992 and 2011. From my results I conclude that the town of Wellfleet, Massachusetts has taken measures since 2001 to reduce development within the current FEMA flood zone areas. I found very little change in development within the FEMA flood zone area from 2001 to 2011. There was however a 93.32% increase of development overall in Wellfleet between 1992 and 2011 which could lead to public health and safety problems in the future resulting from sea level rise and increasing flood zone areas. Therefore I believe that the town of Wellfleet is not taking in consideration future flood zones due to sea levels rising when permitting further development.