SlideShare a Scribd company logo
1 of 61
The Role of Energy                       Technical Report
                                         NREL/TP-6A2-47187
Storage with Renewable                   January 2010

Electricity Generation

Paul Denholm, Erik Ela, Brendan Kirby,
and Michael Milligan
The Role of Energy Storage                                       Technical Report
                                                                 NREL/TP-6A2-47187
with Renewable Electricity                                       January 2010

Generation

Paul Denholm, Erik Ela, Brendan Kirby,
and Michael Milligan

Prepared under Task No. WER8.5005


National Renewable Energy Laboratory
1617 Cole Boulevard, Golden, Colorado 80401-3393
303-275-3000 • www.nrel.gov
NREL is a national laboratory of the U.S. Department of Energy
Office of Energy Efficiency and Renewable Energy
Operated by the Alliance for Sustainable Energy, LLC
Contract No. DE-AC36-08-GO28308
NOTICE

This report was prepared as an account of work sponsored by an agency of the United States government.
Neither the United States government nor any agency thereof, nor any of their employees, makes any
warranty, express or implied, or assumes any legal liability or responsibility for the accuracy, completeness, or
usefulness of any information, apparatus, product, or process disclosed, or represents that its use would not
infringe privately owned rights. Reference herein to any specific commercial product, process, or service by
trade name, trademark, manufacturer, or otherwise does not necessarily constitute or imply its endorsement,
recommendation, or favoring by the United States government or any agency thereof. The views and
opinions of authors expressed herein do not necessarily state or reflect those of the United States
government or any agency thereof.


                          Available electronically at http://www.osti.gov/bridge

                          Available for a processing fee to U.S. Department of Energy
                          and its contractors, in paper, from:
                                   U.S. Department of Energy
                                   Office of Scientific and Technical Information
                                   P.O. Box 62
                                   Oak Ridge, TN 37831-0062
                                   phone: 865.576.8401
                                   fax: 865.576.5728
                                   email: mailto:reports@adonis.osti.gov

                          Available for sale to the public, in paper, from:
                                  U.S. Department of Commerce
                                  National Technical Information Service
                                  5285 Port Royal Road
                                  Springfield, VA 22161
                                  phone: 800.553.6847
                                  fax: 703.605.6900
                                  email: orders@ntis.fedworld.gov
                                  online ordering: http://www.ntis.gov/ordering.htm


             Printed on paper containing at least 50% wastepaper, including 20% postconsumer waste
Acknowledgments
The authors wish to thank the following people for their review and other contributions:
Doug Arent, Easan Drury, Vahan Gevorgian, Michelle Kubik, Jim Leyshon, Sean Ong,
and Brian Parsons of the National Renewable Energy Laboratory (NREL); Jonah Levine
of the University of Colorado; Mark O’Malley of the Electricity Research Center,
University College Dublin; and Samir Succar of the Natural Resources Defense Council.


                                           iii
List of Acronyms
AC       alternate current
AGC      automatic generation control
AS       ancillary services
CAES     compressed-air energy storage
CCGT     combined-cycle gas turbine
CCR      capital charge rate
CSP      concentrating solar power
DC       direct current
ERCOT    Electric Reliability Council of Texas
EVs      electric vehicles
GW       gigawatt
ISO      independent system operators
LaaR     Load Acting as a Resource (program)
MW       megawatt
NERC     North American Electric Reliability Corporation
PHS      pumped hydro storage
PV       photovoltaics
RTO      regional transmission organization
RE       renewable energy
SMES     superconducting magnetic energy storage
T&D      transmission and distribution
V2G      vehicle to grid
VG       variable generation


                                     iv
Table of Contents
1 Introduction ..................................................................................................................................1
2 Operation of the Electric Grid ....................................................................................................2
3 Electricity Storage in the Existing Grid ..................................................................................... 6
            3.1 Development of Energy Storage in Regulated Markets ....................................6
            3.2 The Economics of Energy Storage in Restructured Markets .............................8
            3.3 Other Applications of Energy Storage .............................................................12
            3.4 Summary of Energy Storage Applications in the Current Grid .......................13
4 Impacts of Renewables on the Grid and the Role of Enabling Technologies ..................... 17
            4.1 Costs of Wind and Solar Integration from Previous Studies ...........................19
            4.2 Limiting Factors for Integration of Wind and Solar Energy............................23
5 Storage and Flexibility Options for Renewables-Driven Grid Applications ........................ 34
            5.1 The Flexibility Supply Curve...........................................................................34
            5.2 Deployment and Operational Balancing of Renewable Energy – Individual
            Plant Storage vs. Power System Storage ...............................................................36
            5.3 Energy Storage Technologies and Applications ..............................................38
            5.4 Electric Vehicles and the Role of Vehicle to Grid ...........................................44
6 Conclusions ............................................................................................................................... 46
Bibliography ..................................................................................................................................47
References ....................................................................................................................................48


                                                                       v
List of Tables
Table 3.1. Historical Values of Energy Storage in Restructured Electricity Markets .......10
Table 3.2. Traditional Major Grid Applications of Energy Storage ..................................14
Table 4.1. Summary of Recent Wind Integration Cost Studies .........................................20
Table 5.1. Dedicated Renewable Applications of Energy Storage and Their Whole-Grid
Counterpart ........................................................................................................................37
Table 5.2. Three Classes of Energy Storage .....................................................................38


List of Figures
Figure 2.1. Hourly loads from ERCOT 2005 ......................................................................2
Figure 2.2. System load following and regulation ...............................................................3
Figure 2.3. Optimal and reserve constrained dispatch .........................................................5
Figure 3.1. Historical fuel costs for intermediate load power plants ...................................7
Figure 3.2. Relationship between the annual benefit of storage and capital cost using
different capital charge rates ..............................................................................................11
Figure 4.1. Impact of net load from increased use of renewable energy ...........................18
Figure 4.2. Dispatch with low VG penetration ..................................................................24
Figure 4.3. Dispatch with higher VG penetration ..............................................................25
Figure 4.4. Relationship between price and load in PJM in 2002 .....................................27
Figure 4.5. Contribution from inflexible generation ..........................................................28
Figure 4.6. Effect of decreasing minimum load point on increased use of RE .................29
Figure 4.7. Average curtailment rate as a function of VG penetration for different
flexibilities in ERCOT .......................................................................................................30
Figure 4.8. Marginal curtailment rate as a function of VG penetration for different system
flexibilities in ERCOT .......................................................................................................30
Figure 4.9. Relative cost of VG as a function of VG penetration for different system
flexibilities in ERCOT .......................................................................................................31
Figure 4.10. Option for increasing the use of VG by decreasing curtailment ...................32
Figure 4.11. Reduction of curtailment resulting from addition of energy storage ............33
Figure 5.1. Flexibility supply curve ...................................................................................34
Figure 5.2. Energy storage applications and technologies .................................................39


                                                                 vi
1 Introduction
Renewable energy sources, such as wind and solar, have vast potential to reduce
dependence on fossil fuels and greenhouse gas emissions in the electric sector. Climate
change concerns, state initiatives including renewable portfolio standards, and consumer
efforts are resulting in increased deployments of both technologies. Both solar
photovoltaics (PV) and wind energy have variable and uncertain (sometimes referred to
as “intermittent”) 1 output, which are unlike the dispatchable sources used for the majority
of electricity generation in the United States. The variability of these sources has led to
concerns regarding the reliability of an electric grid that derives a large fraction of its
energy from these sources as well as the cost of reliably integrating large amounts of
variable generation into the electric grid. Because the wind doesn’t always blow and the
sun doesn’t always shine at any given location, there has been an increased call for the
deployment of energy storage as an essential component of future energy systems that
use large amounts of variable renewable resources. However, this often-characterized
“need” for energy storage to enable renewable integration is actually an economic
question. The answer requires comparing the options to maintain the required system
reliability, which include a number of technologies and changes in operational practices.
The amount of storage or any other “enabling” technology used will depend on the costs
and benefits of each technology relative to the other available options.

To determine the potential role of storage in the grid of the future, it is important to
examine the technical and economic impacts of variable renewable energy sources. It is
also important to examine the economics of a variety of potentially competing
technologies including demand response, transmission, flexible generation, and improved
operational practices. In addition, while there are clear benefits of using energy storage to
enable greater penetration of wind and solar, it is important to consider the potential role
of energy storage in relation to the needs of the electric power system as a whole.

In this report, we explore the role of energy storage in the electricity grid, focusing on the
effects of large-scale deployment of variable renewable sources (primarily wind and solar
energy). We begin by discussing the existing grid and the current role that energy storage
has in meeting the constantly varying demand for electricity, as well as the need for
operating reserves to achieve reliable service. The impact of variable renewables on the
grid is then discussed, including how these energy sources will require a variety of
enabling techniques and technologies to reach their full potential. Finally, we evaluate the
potential role of several forms of enabling technologies, including energy storage.


1
  The use of the term “intermittent” has been questioned by the wind energy community as being
technically inaccurate. Intermittent implies a short-term “on-off” cycle while the output of wind
experiences maximum variations more typically on the order of 10% per hour. Solar PV is perhaps
somewhat more “intermittent” because it follows a daily on-off cycle. The description “variable” or
“variable and uncertain” has been proposed as a more technically accurate description of the output of a
wind power plant (Smith and Parsons 2007).

                                                     1
2 Operation of the Electric Grid
The operation of electric power systems involves a complex process of forecasting the
demand for electricity, and scheduling and operating a large number of power plants to
meet that varying demand. The instantaneous supply of electricity must always meet the
constantly changing demand, as indicated in Figure 2.1. It shows the electricity demand
patterns for three weeks for the Electric Reliability Council of Texas (ERCOT) grid
during 2005. 2 The seasonal and daily patterns are driven by factors such as the need for
heating, cooling, lighting, etc. While the demand patterns in Figure 2.1 are for a specific
region of the United States, many of the general trends shown in the demand patterns are
common throughout the country. To meet this demand, utilities build and operate a
variety of power plant types. Baseload plants are used to meet the large constant demand
for electricity. In the United States, these are often nuclear and coal-fired plants, and
utilities try to run these plants at full output as much as possible. While these plants
(especially coal) can vary output, their high capital costs, and low variable costs (largely
fuel), encourage continuous operation. Furthermore, technical constraints (especially in
nuclear plants) restrict rapid change in output needed to follow load. Variation in load is
typically met with load-following or “cycling” plants. These units are typically
hydroelectric generators or plants fueled with natural gas or oil. These “load-following”
units are further categorized as intermediate load plants, which are used to meet most of
the day-to-day variable demand; and peaking units, which meet the peak demand and
often run less than a few hundred hours per year.

                                                                                                 1.0

                60000                                                                            0.9


                                                                                                       Load (Fraction of Annual Peak)
                                                                                                 0.8
                50000
                                                                                                 0.7
    Load (MW)


                40000                                                                            0.6

                                                                                                 0.5
                30000
                                                                                                 0.4

                20000                                                                            0.3

                            Summer Maximum               Winter      Spring Minimum              0.2
                10000
                                                                                                 0.1

                   0                                                                             0.0
                        0   24         48       72          96      120        144         168
                                                     Hour
                                 Figure 2.1. Hourly loads from ERCOT 2005


2
  Most of Texas (about 85% of the population) is within the ERCOT grid, which is largely independent of
the two larger U.S. grids.

                                                     2
In addition to meeting the predictable daily, weekly, and seasonal variation in demand,
utilities must keep additional plants available to meet unforeseen increases in demand,
losses of conventional plants and transmission lines, and other contingencies. This class
of responsive reserves is often referred to as operating reserves and includes meeting
frequency regulation (the ability to respond to small, random fluctuations around normal
load), load-forecasting errors (the ability to respond to a greater or less than predicted
change in demand), and contingencies (the ability to respond to a major contingency such
as an unscheduled power plant or transmission line outage) (NERC 2008). 3 Both
frequency regulation and contingency reserves are among a larger class of services often
referred to as ancillary services, which require units that can rapidly change output.
Figure 2.2 illustrates the need for rapidly responding frequency regulation (red) in
addition to the longer term ramping requirements (blue). In this utility system, the
morning load increases smoothly by about 400 megawatts (MW) in two hours. During
this period, however, there are rapid short-term ramps of +/- 50 (MW) within a few
minutes.


    Figure 2.2. System load following and regulation. Regulation (red) is the fast fluctuating
         component of total load (green) while load following (blue) is the slower trend
                                         (Kirby 2004)
Because of the rapid response needed by both regulation and contingency reserves, a
large fraction of these reserves are provided by plants that are online and “spinning” (as a
result, operating reserves met by spinning units are sometimes referred to as spinning
reserves.) 4 Spinning reserves are provided by a mix of partially loaded power plants or
responsive loads. The need for reserves increases the costs and decreases the efficiency of

3
  Operating reserves are primarily capacity services (the ability to provide energy on demand) as opposed to
actual energy services.
4
  The nomenclature around various ancillary services (especially spinning reserves) varies significantly.
While the NERC glossary indicates that spinning reserve applies to both contingency and frequency
regulation, the term spinning reserve often is used to refer to only contingency reserves. For additional
discussion of nomenclature around contingency and spinning reserves, see Rebours and Kirschen 2005.

                                                     3
an electric power system compared to a system that is perfectly predictable and does not
experience unforeseen contingencies. These costs result from several factors. First, the
need for fast-responding units results in uneconomic dispatch – because plants providing
spinning reserve must be operated at part load, they potentially displace more economic
units. 5 (Flexible load-following units are often either less efficient or burn more
expensive fuel than “baseload” coal or nuclear units.) Second, partial loading can reduce
the efficiency of individual power plants. Finally, the reserve requirements increase the
number of plants that are online at any time, which increases the capital and O&M costs.

Figure 2.3 provides a simplified illustration of the change in dispatch (and possible cost
impacts) needed to provide operating reserves. The figure on the left shows an “ideal”
dispatch of a small electric power system. Two baseload units provide most of the
energy, while an intermediate load and two peaking units provide load following. In the
“ideal” dispatch, it is possible that the intermediate load unit cannot rapidly increase
output to provide operating reserves. Furthermore, during the transition periods when the
load-following units are nearing their full output – but before additional units are turned
on – there may be insufficient capacity left in the load-following units to provide
necessary operating capacity for regulation or contingencies. A dispatch that provides the
necessary reserves is provided on the right. In this case, lower-cost units reduce output to
accommodate the more flexible units providing reserves. This increases the overall cost
of operating the entire system.


5
 This “opportunity cost” associated with uneconomic dispatch is the dominant source of reserve costs
(Kirby 2004).

                                                    4
3000

              2500
                                               Insufficient              Peak 2
              2000                              Reserve
  Load (MW)


                                                                         Peak 1
                                                Capacity
              1500                                                       Int
                                                                         Base2
              1000                                                                                Higher Cost Unit Started
                            Insufficient                                 Base 1                   Early To Provide Reserve
              500           Flexibility to                                                                Capacity
                         Provide Reserves
                0                                                                  3000
                     0      4      8    12    16    20        24
                                       Hour                                        2500

                                “Ideal” Dispatch                                   2000


                                                                       Load (MW)
                                                                                   1500

                                                                                   1000

                             Lower Cost Unit Backed Off                            500
                              To Accommodate Higher
                               Cost Flexible Generator                               0
                                                                                          0   4      8     12   16    20     24
                                                         Reserve Constrained                             Hour
                                                              Dispatch
                                 Figure 2.3. Optimal and reserve constrained dispatch
The need for operating reserves and the large variation in demand restricts the
contribution from low-cost baseload units and increases the need for units that can vary
output to provide both load-following and ancillary services. As a consequence, utility
operators have long pursued energy storage as one potential method of better utilizing
baseload plants and providing an alternative to lower efficiency thermal generators for
meeting variations in demand.


                                                                   5
3 Electricity Storage in the Existing Grid
The challenges associated with meeting the variation in demand while providing reliable
services has motivated historical development of energy storage. While a number of
pumped hydro storage (PHS) plants 6 were built in the United States before 1970,
significant interest, research, and funding for new storage technologies began in the early
1970s, associated with dramatic increases in oil prices. This period also saw the largest
deployment of PHS based on its competitive economics compared to alternative sources
of intermediate load and peaking energy.

3.1 Development of Energy Storage in Regulated Markets
Deployment of energy storage is dependent on the economic merits of storage
technologies compared to the more conventional alternatives used to follow load. Before
the advent of low-cost, efficient gas turbines now typically used to follow load and
provide reserves, utilities often relied on oil- and gas-fired steam turbines (and
hydroelectric dams where available). In the 1970s, dramatic price increases in oil and
natural gas occurred, along with concerns about security of supply. This led to the
Powerplant and Industrial Fuel Use Act, restricting use of oil and gas in new power plants
(EIA 2009b). Utilities expected to bring online many new coal and nuclear plants to meet
baseload demand, but were left with limited options to provide load-following and
peaking services. 7 This led utilities to actively evaluate pumped hydro (along with other
storage technologies) as alternatives to fossil-fueled intermediate load and peaking units.
The economic analysis and justification of new energy storage facilities during this
period was based on a direct comparison of the energy and capacity provided by energy
storage to an equivalently sized fossil plant, (choosing the lower net-cost option) which
largely ignored any additional operational benefits energy storage can provide. 8
Figure 3.1 provides a simple framework of comparing these technologies over time. In
the figure, the variable (fuel-related) costs are shown for a storage device and fossil-
fueled alternatives. In this figure, the storage technology is assumed to be fueled with off-
peak coal and has an effective round-trip efficiency of 75%. 9


6
  PHS stores energy by pumping water from a lower reservoir to an upper reservoir and releasing that
stored water through a conventional hydroelectric generator. Additional information about PHS is provided
in Section 5.
7
  Concerns about the availability of oil and other peaking fuels in this period was so great that an
international conference (including the U.S. National Academy of Sciences) on the subject in 1979
described energy storage as “a vital element in mankind’s quest for survival and progress” (Silverman
1980).
8
  See, for example, EPRI 1976. Here, the proposed method for comparing energy storage to conventional
alternatives is based solely on the value of energy and firm capacity value without any actual quantification
of operational benefits.
9
  This would be a typical assumption for a pumped hydro plant built during the 1970s and 1980s (EPRI
1976).

                                                      6
14.0
                                                                                   Gas Steam
                                                                                   Oil Steam
                                  12.0                                             Gas CCGT
                                                                                   Storage (Coal Charging)

                                  10.0
     Fuel Cost (2008 Cents/kWh)


                                   8.0


                                   6.0


                                   4.0


                                   2.0


                                   0.0
                                         1976
                                         1977
                                         1978
                                         1979
                                         1980
                                         1981
                                         1982
                                         1983
                                         1984
                                         1985
                                         1986
                                         1987
                                         1988
                                         1989
                                         1990
                                         1991
                                         1992
                                         1993
                                         1994
                                         1995
                                         1996
                                         1997
                                         1998
                                         1999
                                         2000
                                         2001
                                         2002
                                         2003
                                         2004
                                         2005
                                         2006
                                         2007
                                         2008
                                                                        Year


                                         Figure 3.1. Historical fuel costs for intermediate load power plants 10


Figure 3.1 shows that the variable cost of providing energy from a storage device was
much lower than alternatives available in the mid-1970s and early 1980s. While
Figure 3.1 provides the fuel costs, the total economics of storage must also consider the
fixed costs. During the mid- to late 1970s, gas-fired combined cycle plants were not
significantly less expensive than pumped hydro, with cost estimates of $110-$280/kW for
a 10-hour PHS device and $175-275/kW for a combined-cycle generator (EPRI 1976).
As a result, pumped hydro appeared more economic than alternative generation sources
during this time period, even without considering additional operation benefits. It was
expected that oil and gas prices would remain high, and that off-peak energy would be
widely available (and even less expensive) due to anticipated large-scale deployment of
nuclear power plants.

During the mid- to late 1970s, much of the nation’s 20 GW of pumped hydro storage was
initiated (ASCE 1993), along with significant research and development in a variety of
other storage technologies including several battery types, capacitors, flywheels, and
superconducting magnetic storage (DOE 1977). Growth projections for energy storage
during this period included significant increases of several types (Boyd et al. 1983).
However, most PHS development, along with interest in and deployment of other
10
  This figure is intended to represent general trends as opposed to absolute costs. In this figure, fuel prices
and generation characteristics are derived from various data sets from the Energy Information
Administration.

                                                                               7
emerging storage technologies, ended in the 1980s after dramatic reduction in the price of
natural gas, increased efficiency and reduced costs of flexible combined-cycle and
simple-cycle natural gas turbines, and repeal of the Fuel Use Act in 1987. While
estimates from the 1970s place combined-cycle gas turbine (CCGT) units and PHS at
similar costs, by the early 2000s, PHS was estimated to be about twice the cost of a
CCGT. As a result, even with the increased cost of gas, this dramatic increase in PHS
cost (along with the many other factors discussed previously) limited the economic
competitiveness of PHS vs. gas-fired generators. 11 Furthermore, while coal prices
continued to drop, the limited nuclear build-out eliminated a source of low-cost off-peak
electricity. Finally, the simplistic treatment of the economic benefits of energy storage
technologies was also a limiting factor. One of the main benefits of energy storage is its
ability to provide multiple services, including load leveling (and associated benefits such
as a reduction in cycling-induced maintenance) along with regulation and contingency
reserves and firm capacity. 12 However, it has always been somewhat difficult to quantify
these various value streams without fairly sophisticated modeling and simulation
methods, (especially before the advent of energy and ancillary service markets, which
will be discussed in the next section). Because the economic analysis is difficult, and
benefits of storage are often uncertain, utilities tend to rely on more traditional generation
assets, especially in regulated utilities where risk is minimized and new technologies are
adopted relatively slowly. 13

Combined, these factors have restricted deployment of utility-scale energy storage in the
United States. Besides PHS, deployment has been limited to a single 110 MW
compressed-air energy storage (CAES) facility, and a variety of small projects. 14 A more
comprehensive discussion of energy storage technologies and their status is provided in
Section 5.

3.2 The Economics of Energy Storage in Restructured Markets
Despite the lack of significant new construction, interest in energy storage never
completely disappeared during the period of low-cost peaking fuels. Research and
development has continued, along with an increasing number of proposed projects.

11
   PHS also takes longer to build (increasing the risk for investors), requires additional permits, and is
typically located farther from load centers, which requires more transmission than gas-fired generators.
PHS may also face greater environmental opposition (Strauss 1991).
12
   This problem has been noted many times. For example, “traditionally, when electric utilities evaluate
generating additions to their facilities, the evaluation process considers the contribution of each alternative
to both capacity and energy requirements. However, the evaluation process often neglects or inaccurately
measure potential costs and benefits not directly related to capacity and energy. Operating considerations
that reflect the ability (or inability) of a generation resource to respond to the electric system’s dynamic
operating needs usually fall into this category.” (Jabbour and Wells 1992).
13
   Private investors tend to favor lower capital cost investments with faster construction times (i.e.,
combustion turbines and combined-cycle plants), even if they have higher operating costs, because this
reduces perceived economic risk.
14
   To place these values in perspective, between 1993 and 2008, more than 320 GW of conventional
capacity was constructed in the United States. With the exception of the completion of previously started
PHS facilities and a few demonstration projects, no significant storage capacity was added. The total U.S.
utility storage capacity of about 20 GW in 2008 is less than 2% of the total installed generation capacity
(EIA 2009a).

                                                       8
Recent renewed interest in energy storage has been motivated by at least five factors:
advances in storage technologies, an increase in fossil fuel prices, the development of
deregulated energy markets including markets for high-value ancillary services,
challenges to siting new transmission and distribution facilities, and the perceived need
and opportunities for storage with variable renewable generators.

Emergence of wholesale electricity markets along with increased volatility in natural gas
prices has created new opportunities and interest in energy storage. As shown in Figure
3.1, rising natural gas prices in the early 2000s increased the cost-competitiveness of
energy storage. However, perhaps the single greatest motivation for proposals to build
new energy storage is the creation of markets for both energy and ancillary services
including regulation, contingency reserves, and capacity. As of 2009, wholesale energy
markets exist in parts of more than 30 states and cover about two-thirds of the U.S.
population (IRC 2009). The markets provide real, transparent data for both utilities and
independent power producers to consider the opportunities for energy storage. Market
data allows evaluation of both the economic yield and optimum location of energy
storage devices for arbitrage – the ability to purchase low-cost off-peak energy and re-sell
this energy during on-peak periods. Furthermore, the benefits of providing operating
reserves and other ancillary services from energy storage can now be evaluated.
Previously, the value of these services was largely “hidden” in utilities’ cost of service,
and the cost of providing operating reserves, for example, was rarely calculated. The
high value of these services is now recognized, and the advantages of energy storage in
providing these services is evident, especially because these services generally require
fast response and limited actual energy delivery, two qualities that are well-suited to
many energy storage devices.

Historical market data can be used to evaluate the potential profitability of energy storage
devices that provide various services. Table 3.1 provides the results of several studies of
U.S. electricity markets.


                                             9
Table 3.1. Historical Values of Energy Storage in Restructured Electricity Markets
    Market        Location     Years          Annual          Assumptions
    Evaluated                  Evaluated      Value
                                              ($/kW)
    Energy        PJMa         2002-          $60-$115        12 hour, 80% efficient device. Range of
    Arbitrage                  2007                           efficiencies and sizes evaluated 15
                  NYISOb       2001-          $87-$240        10 hour, 83% efficient device. Range of
                               2005           (NYC)           efficiencies and sizes evaluated.
                                              $29-$84
                                              (rest)
                  USAc         1997-          $37-$45         80% efficient device, Covers NE, No Cal,
                               2001                           PJM
                  CAd          2003           $49             10 hour, 90% efficient device.
    Regulation    NYISOb       2001-          $163-248
                               2005
                  USAe         2003-          $236-$429       PJM, NYISO, ERCOT, ISONE
                               2006
    Contingency   USAe         2004-          $66-$149        PJM, NYISO, ERCOT, ISONE
    Reserves                   2005
a
  Sioshansi et al. 2009
b
  Walawalkar et al. 2007
c
  Figueiredo et al. 2006
d
  Eyer et al. 2004
e
  Denholm and Letendre 2007

The values in Table 3.1 can be translated into a maximum capital cost for the applicable
storage technology (equal to the maximum cost of a storage device that can be supported
by the revenues available). Figure 3.2 provides a generic conversion between annual
costs and total capital costs. This conversion is performed by dividing the annual
revenues by the capital charge rate, which produces a total capital cost. 16 The capital
charge rate (also referred to as a fixed-charge rate or capital recovery factor) refers to the
fraction of the total capital cost that is paid each year to finance the plant. It should be
noted that this cost does not include any operation and maintenance costs. 17


15
   This study analyzed devices up to 40 hours, and found rapidly diminishing returns for devices with
storage capacity greater than about 10 hours. The majority of arbitrage benefits are within a day, as
opposed to over larger time periods. In addition, while short-term price variation is highly predictable,
long-term variations are less predictable, which reduces the certainty of long-term arbitrage opportunities.
16
   This is the inverse of the process of calculating an annualized cost from a capital cost by multiplying by
the capital charge rate.
17
   These values also assume that frequency regulation is an energy- and cost-neutral service.

                                                     10
4000
                                                         Capital
                                                       Charge Rate
                                            3500
     Required Storage Capital Cost ($/kW)

                                                            9.8%
                                            3000            12.0%
                                                            13.9%
                                            2500


                                            2000

                                            1500          Arbitrage Only
                                                                                                        Regulation Only
                                            1000

                                            500
                                                                      Contingency Only
                                              0
                                                   0         50       100           150       200        250      300     350
                                                                           Annual Benefit of Storage ($/kW)


           Figure 3.2. Relationship between the annual benefit of storage and capital cost using
                                       different capital charge rates 18
Figure 3.2 shows the range of values and corresponding capital costs for three types of
operation: energy arbitrage, contingency reserves, and frequency regulation. In general,
energy arbitrage provides the least value. Outside of New York City, the maximum
annual value in Table 3.1 for arbitrage was $115/kW (for a 20-hour device), which would
translate into a capital cost of $827-1,170/kW – this is below current estimates for most
energy storage technologies. While there is significant uncertainty in costs, most energy
storage assessments indicate that few commercially available bulk energy storage
technologies are deployable for less than $1,000/kW. 19 This reveals the same challenging
economics as comparing a storage device to a conventional generator as discussed in
Section 3-1. The value of energy arbitrage alone does not appear to justify the
deployment of energy storage at current technology costs and electricity prices.

The value of energy storage increases when taking advantage of other individual sources
of revenue or even combined services. A device with sufficient energy capacity for
energy arbitrage would likely be able to receive capacity payments in locations where


18
   Capital charge rate (CCR) of 9.8% from EPRI 2003, CCR of 12% from Butler et al. 2003, CCR of 13.9%
from Eyer et al. 2004.
19
   CAES is one possible exception, but requires analysis of both the electricity price and natural gas prices.
See Section 5 and the references in the Bibliography for additional discussion of storage costs.

                                                                                      11
capacity markets now exist; recent data in the PJM market indicates an additional
potential value of $40-90/kW-year. 20

Alternatively, contingency reserves offer a higher value 21 than energy arbitrage and also
require less energy capacity. Obtaining the values for energy arbitrage in Table 3.1
generally requires a device with at least 10 hours of storage capacity; contingency
reserves can require as little as 30 minutes, depending on the market and market
reliability rules (PJM 2009b). The challenge for a device providing contingency reserves
is that the device must be able to respond rapidly, typically in a few minutes or less.
Frequency regulation is even more demanding, requiring continuous changes in output,
frequent cycling, and fast response. It is also the highest-value opportunity for an energy
storage device, and has been the focus of many potential energy storage applications,
especially given its fairly small energy requirements. 22

3.3 Other Applications of Energy Storage
In addition to energy arbitrage and operating reserves, there are several other services that
energy storage has provided or could provide in the current grid. Several of these
applications are discussed below.

Transmission and Distribution
In addition to generation, storage can act as an alternative or supplement to new
transmission and distribution (T&D). Distribution systems must be sized for peak
demand; as demand grows, new systems (both lines and substations) must be installed,
often only to meet the peak demand for a few hours per year. New distribution lines may
be difficult or expensive to build, and can be avoided or deferred by deploying distributed
storage located near the load (Nourai 2007). (Energy can be stored during off-peak
periods when the distribution system is lightly loaded, and discharged during peak
periods when the system may otherwise be overloaded.) Energy storage can also reduce
the high line-loss rates that occur during peak demand (Nourai et al. 2008).


20
   PJM’s capacity market (Reliability Pricing Model) data derived from http://www.pjm.com/markets-and-
operations/rpm.aspx.
21
   More recent data shows a greater range of value for contingency reserves. For example, in 2008, the
average value for spinning reserves in NYISO was $10.1 in the east and $6.2 in the west, corresponding to
as little as $54/kW-yr. In the same year, the average price in ERCOT was $27.1, corresponding to
$237/kW-yr. In 2009, these values fell substantially to $36/kW-yr in NYISO west, and $87/kW-yr in
ERCOT.
22
   Frequency regulation theoretically is a net zero energy service over relatively short time scales, meaning
the energy capacity of the device can be much smaller than those providing operating reserves and energy
arbitrage. Several markets in the United States have changed or have proposed to change their treatment of
regulation to accommodate energy-limited storage technologies. Furthermore, it has been suggested that
fast-responding storage devices could receive a greater value per unit of capacity actually bid, because they
could actually reduce the amount of reserves needed. For example, “faster responsive resources can help to
reduce California ISO’s regulation procurement by up to 40% (on average)” and “California ISO may
consider creating better market opportunities and incentives for fast responsive resources.” (Makarov et al.
2008).

                                                     12
Black-Start
Black-start provides capacity and energy after a system failure. A black-start unit
provides energy to help other units restart and provide a reference frequency for
synchronization. Pumped hydro units have been used for this application. 23

Power Quality and Stability
Energy storage can be used to assist in a general class of services referred to as power
quality and stability. Power quality refers to voltage spikes, sags, momentary outages,
and harmonics. Storage devices are often used at customer load sites to buffer sensitive
equipment against power quality issues. Electric power systems can also experience
oscillations of frequency and voltage. Unless damped, these disturbances can limit the
ability of utilities to transmit power and affect the stability and reliability of the entire
system. System stability requires response times of less than a second, and can be met by
a variety of devices including fast-responding energy storage.

End-Use/Remote Applications
Other applications for energy storage are at the end use. Storage can provide firm power
for off-grid homes, but also can provide value when grid-tied through management of
time-of-use rates, or demand charges in large commercial and industrial buildings.
Energy storage also provides emergency and backup power for increased reliability. In
many cases, end-use applications have analogous applications in the grid as a whole (and
potentially compete with these applications). For example, using energy storage to time-
shift end use is functionally equivalent to energy arbitrage, and a flatter load on the
demand side reduces the potential need for load-leveling in central storage applications
(and vice-versa). To be economic, end-use applications require time-varying prices and
are extremely site-specific.

3.4 Summary of Energy Storage Applications in the Current Grid
Table 3.2 provides a summary of the various applications of energy storage commonly
discussed in the literature. Each of these applications provides a potential value to a
merchant storage operator in a restructured market or a source of cost reduction to the
system.


23
  Large PHS units or other black-start generators must themselves be “black-started” and may use batteries
or small generators for this purpose. Many transmission substations also use batteries partly to maintain
reliability during power failures.

                                                   13
Table 3.2. Traditional Major Grid Applications of Energy Storage
 Application           Description                                 System Benefits when Provided by                Timescale of Operation
                                                                   Storage
 Load Leveling/        Purchasing low-cost off-peak energy         Increases utilization of baseload power         Response in minutes to hours.
 Arbitrage             and selling it during periods of high       plants and decrease use of peaking              Discharge time of hours.
                       prices.                                     plants. Can lower system fuel costs, and
                                                                   potentially reduce emissions if peaking
                                                                   units have low efficiency.
 Firm Capacity         Provide reliable capacity to meet           Replace (or function as) peaking                Must be able to discharge continuously
                       peak system demand.                         generators.                                     for several hours or more.
 Operating
 Reserves

     Regulation        Fast responding increase or                 Reduces use of partially loaded thermal         Unit must be able to respond in
                       decrease in generation (or load) to         generators, potentially reducing both fuel      seconds to minutes. Discharge time is
                       respond to random, unpredictable            use and emissions.                              typically minutes. Service is
                       variations in demand.                                                                       theoretically “net zero” energy over
                                                                                                                   extended time periods.

     Contingency       Fast response increase in generation        Same as regulation.                             Unit must begin responding immediately
     Spinning          (or decrease load) to respond to a                                                          and be fully responsive within 10
             24
     Reserve           contingency such as a generator                                                             minutes. Must be able to hold output for
                       failure.                                                                                    30 minutes to 2 hours depending on the
                                                                                                                                                           25
                                                                                                                   market. Service is infrequently called.

     Replacement/      Units brought on-line to replace            Limited. Replacement reserve is typically       Typical response time requirement of
     Supplemental      spinning units.                             a low-value service.                            30-60 minutes depending on market
                                                                                                                   minutes. Discharge time may be several
                                                                                                                   hours.


24
   Contingency reserves may be provided by both spinning and non-spinning units, depending on the market. The requirements for non-spinning reserves are the
same except the resource does not need to “begin responding immediately.” Full response is still within 10 minutes.
25
   For example, in the PJM regional transmission organization (RTO) in 2008 (covering about 50 million people), synchronized reserves were called a total of 40
times with an average duration of 10 minutes. See http://www.pjm.com/markets-and-operations/ancillary-services.aspx


                                                                              14
Ramping/Load             Follow longer term (hourly) changes          Reduces use of partially loaded thermal          Response time in minutes to hours.
 Following                in electricity demand.                       generators, potentially reducing both fuel       Discharge time may be minutes to
                                                                       use and emissions. Price is “embedded”           hours.
                                                                       in existing energy markets, but not
                                                                       explicitly valued, so somewhat difficult to
                                                                       capture.
 T&D                      Reduce loading on T&D system                 Provides an alternative to expensive and         Response in minutes to hours.
 Replacement              during peak times.                           potentially difficult to site transmission       Discharge time of hours.
 and Deferral                                                          and distribution lines and substations.
                                                                       Distribution deferral is not captured in
                                                                       existing markets.
 Black-Start              Units brought online to start system         Limited. May replace conventional                Response time requirement is several
                          after a system-wide failure (blackout).      generators such as combustion turbines           minutes to over an hour. Discharge time
                                                                       or diesel generators.                            requirement may be several to many
                                                                                                                        hours. 26
 End-Use
 Applications

     TOU Rates            Functionally the same as arbitrage,          Same as arbitrage.                               Same as arbitrage.
                          just at the customer site.

     Demand               Functionally the same as firm                Same as firm capacity.                           Same as firm capacity.
     Charge               capacity, just at the customer site.
     Reduction
                          Functionally the same as contingency         Benefits are primarily to the customer.          Instantaneous response. Discharge
     Backup Power/        reserve, just at the customer site.                                                           time depends on level of reliability
     UPS/Power                                                                                                          needed by customer.
     Quality


26
     The black-start performance standard in PJM is 90 minutes to start, with an ability to run for 16 hours (PJM 2009a).


                                                                                  15
It should be noted that Table 3.2 does not include any dedicated renewables applications.
Historical motivations for energy storage deployment were based on the challenges of
meeting variations in demand using conventional thermal generators. Much of the current
attention for energy storage is based on its potential application with renewable energy
(primarily solar and wind). Energy storage is seen as a means to “firm” or “shape” the
output from variable renewable generators. However, the actual need for storage to
perform these roles has yet to be quantified. In addition, it is unclear whether the electric
power industry must create entirely new “classes” of energy and capacity services to deal
with the increased uncertainty and variability created by large-scale deployment of
variable renewables. Determining the role of energy storage with renewables first
requires examining the impacts of variable generators on the grid and how these impacts
may require the use of various enabling technologies.


                                             16
4 Impacts of Renewables on the Grid and the Role of
  Enabling Technologies
The introduction of variable renewables is now one of the primary drivers behind
renewed interest in energy storage. A common claim is that renewables such as wind and
solar are intermittent and unreliable, and require backup and firming to be useful in a
utility system – energy produced by wind and solar should be “smoothed” or shifted to
times when the wind is not blowing or the sun is not shining using energy storage. These
statements are generally qualitative in nature and provide little insight into the actual role
of renewables in the grid, (including their costs and benefits) or the potential use of
energy storage or other enabling technologies.

To evaluate the actual role of energy storage in a grid with large amounts of variable
renewable generation, we must first return to our previous discussion of the variability of
electric demand, and how the conventional generators currently meet this demand. As
discussed in Section 2, tremendous variation in daily demand is met by the constant up-
and-down cycling of generators. In addition to this daily cycling, frequency regulation
and contingency reserves are provided by partly loaded generators and responsive load. 27
Most of these “flexible” generators are hydro units, combustion turbines, some
combined-cycle plants, and even large thermal generators, as well as the existing PHS.

Variable generation (VG) 28 will change how the existing power plant mix is operated,
because its output is unlike conventional dispatchable generators. It is easiest to
understand the impact of VG technologies on the grid by considering them as a source of
demand reduction with unique temporal characteristics. Instead of considering wind or
PV as a source of generation, they can be considered a reduction in load with
conventional generators meeting the “residual load” of normal demand minus the
electricity produced by renewable generators.

Figure 4.1 illustrates this framework for understanding the impacts of variable
renewables. In this figure, renewable generation is subtracted from the normal load,
showing the “residual” or net load that the utility would need to meet with conventional
sources. 29 The benefits to the utility include reduced fuel use (and associated emissions) 30
and a somewhat reduced need for overall system capacity (this is relatively small for
wind but can be significant for solar given its coincidence with load.) 31 There are also
four significant impacts that change how the system must be operated and affect costs.

27
   In some locations such as Texas, demand response typically provides half of the contingency reserve
requirements. Other regions also use (or are evaluating) load to provide regulation.
28
   From this point on, variable renewable generators will be referred to as variable generation (VG)
following NERC 2009.
29
   This figure uses ERCOT load data from 2005 along with 15 GW of spatially diverse simulated wind data
from the same year. See Section 4.2 for more details about the data used.
30
   A reduction in demand from VG or load will reduce the total marginal cost of generation, which includes
fuel, emissions costs, and variable O&M. This ignores any additional cost impacts of variability on the
remaining generation fleet, which is discussed in the next section.
31
   There are a number of other benefits provided by renewable energy sources such as reduced volatility of
fuel prices. This work is not intended to be an analysis of the total benefits of renewables or VG.

                                                   17
First is the increased need for frequency regulation, because wind can increase the short-
term variability of the net load (not illustrated on the chart). 32 Second is the increase in
the ramping rate, or the speed at which load-following units must increase and decrease
output. The third impact is the uncertainty in the wind resource and resulting net load. 33
The final impact is the increase in overall ramping range – the difference between the
daily minimum and maximum demand – and the associated reduction in minimum load,
which can force baseload generators to reduce output; and in extreme cases, force the
units to cycle off during periods of high wind output. Together, the increased variability
of the net load requires a greater amount of flexibility and operating reserves in the
system, with more ramping capability to meet both the predicted and unpredicted
variability. The use of these variable and uncertain resources will require changes in the
operation of the remaining system, and this will incur additional costs, typically referred
to as integration costs.

                                                                                              Ramp Range (Increases in
      50000                                                                                   this two-week period from
                                  Load         Wind          Net Load                            19.3 GW/day to 26.2
      45000                                                                                            GW/day)
      40000

      35000

      30000
 MW


      25000

      20000

      15000

      10000

       5000

          0
          1-Apr                                    8-Apr                                  15-Apr
                                                            Uncertainty in wind output
                Variation in wind output increases net     increases uncertainty in net
               load ramp ate (Increases in this period         load to be met with
              from 4,052 MW/hour to 4,560 MW/hour)           conventional generators


                Figure 4.1. Impact of net load from increased use of renewable energy


32
   As discussed later, the impact of short-term wind variability is often overstated, especially considering
the benefits of spatial diversity. The impact on minute-to-minute regulation requirements is mitigated by
aggregating large amounts of wind because individual wind plant variability is uncorrelated in the
regulation time frame. Furthermore, the limited ability to forecast wind and use of persistence forecasts
may be a major factor in increased short-term variability of the net load. Finally, newer wind turbines
meeting “low-voltage ride-through” standards can add short-duration stability, and have the capability to
provide frequency regulation to the grid.
33
   This is actually the combination of the uncertainty in load and the uncertainty in wind. As VG
penetration increases, it begins to dominate the net load uncertainty.

                                                             18
4.1 Costs of Wind and Solar Integration from Previous Studies
Concerns about grid reliability and the cost impacts of wind have driven a large number
of wind integration studies. These studies use utility simulation tools 34 and statistical
analysis to model systems with and without wind and calculate the integration costs of
wind.

The basic methodology behind these studies is to compare a base case without wind to a
case with wind, evaluating technical impacts and costs. The studies calculate the
additional costs of adding operating reserves as well as the other system changes needed
to reliably address the increased uncertainty and variability associated with wind
generation.

Table 4.1 provides examples of several integration studies from various parts of the
United States. In these studies, integration costs are typically divided into three types,
based on the timescales important to reliable and economic power system operation.
These three types are the first three of the four impacts discussed previously:

Regulation – the increased costs that result from providing short-term ramping (seconds
to minutes) resulting from wind deployment.

Load following – the increased costs that result from providing the hourly ramping
requirements resulting from wind deployment.

Wind uncertainty – the increased costs that result from having a suboptimal mix of units
online because of errors in the wind forecast. This is typically called unit commitment or
scheduling cost because it involves costs associated with committing (turning on) too few
or too many slow-starting, but lower operational-cost units than would have been
committed if the wind forecast been more accurate.


34
  These tools have several names such as “production cost” or “security-constrained unit commitment and
economic dispatch” models.

                                                  19
Table 4.1. Summary of Recent Wind Integration Cost Studies (DeCesaro et al. 2009)
Date         Study                   Wind     Regula-        Load-       Unit    Other   Tot Oper.
                                     Capacity tion Cost      Following   Commit- ($/MWh) Cost Impact
                                     Penetra- ($/MWh)        Cost        ment            ($/MWh)
                                     tion (%)                ($/MWh)     Cost
                                                                         ($/MWh)
2003         Xcel-UWIG                  3.5       0             0.41       1.44      Na          1.85
2003         WE Energies                29       1.02           0.15       1.75      Na          2.92
2004         Xcel-MNDOC                 15       0.23            na        4.37      Na           4.6
2005         PacifiCorp-2004            11        0             1.48       3.16      Na          4.64
             Calif. (multi-
2006         year)a                      4       0.45          trace       trace     Na          0.45
                             b
2006         Xcel-PSCo                  15       0.2             na        3.32     1.45         4.97
                         c
2006         MN-MISO                    36        na             na         na       na          4.41
             Puget Sound
2007         Energy                     12        na             na         na       na          6.94
             Arizona Pub.
2007         Service                    15       0.37           2.65       1.06      na          4.08
                                 d
2007         Avista Utilities           30       1.43           4.4         3        na          8.84
2007         Idaho Power                20        na             na         na       na          7.92
2007         PacifiCorp-2007            18        na            1.1         4        na           5.1
                             e
2008         Xcel-PSCo                  20        na             na         na       na          8.56
a
  Regulation costs represent 3-year average.
b
  The Xcel/PSCO study also examine the cost of gas supply scheduling. Wind increases the uncertainty of
gas requirements and may increase costs of gas supply contracts.
c
  Highest over 3-year evaluation period. 30.7% capacity penetration corresponding to 25% energy
penetration
d
  Unit commitment includes cost of wind forecast error.
e
  This integration cost reflects a $10/MMBtu natural gas scenario. This cost is much higher than the
integration cost calculated for Xcel-PSCo in 2006, in large measure due to the higher natural gas price: had
the gas price from the 2006 study been used in the 2008 study, the integration cost would drop from
$8.56/MWh to $5.13/MWh.


                                                        20
The overall cost impact of accommodating wind variability in these studies is typically
less than $5/MWh (0.5 cents/kWh), adding less than 10% to the cost of wind energy. 35
The majority of these costs appear to be a result of wind forecasting errors and
uncertainty – resulting in “unit commitment” errors where too little or too much capacity
is kept online. It is worth noting that wind forecasting is an area of active research, and
these errors are expected to decrease in time, which could potentially lead to a
corresponding decrease in unit commitment errors and associated costs.

The explanation for this relatively modest impact on costs is largely based on the already
significant variation in normal load. The large amount of flexible generation already
available to meet the variability in demand has the ability to respond to the greater
variability caused by the large-scale deployment of wind. Furthermore, these studies have
found significant benefits of spatial diversity – just because the wind isn’t blowing in one
location, it may be in another. The combination of multiple wind sites tends to smooth
out the aggregated wind generation in a system, which reduces the per-unit size of ramps
and mitigates the range of flexibility required. 36

Far less work has been performed on the operational impacts of large-scale solar
generation due largely to lower deployment rates compared to wind. 37 In addition, there
is insufficient solar data available to estimate impacts on frequency regulation and
ramping (Lew et al. 2009.) One study of PV on the Xcel Colorado utility system found
integration costs of between $3.51/MWh and $7.14/MWh for a scenario examining 800
MW of solar in a 6,922 MW peaking system, with gas prices ranging from $7.83 to
$11.83/MMBTU (EnerNex 2009). Additional studies are ongoing, but it will be some
time until knowledge of solar’s impact on the grid and associated costs are understood to
the degree of wind. 38

In reality, while these studies divide the costs into three main categories, the source of
actual integration costs is largely associated with the fuel costs needed to provide the
additional required reserves, along with some variable operations and maintenance costs.
To provide regulation and load following, the additional variability requires that utilities
run more flexible generators (such as gas-fired units instead of coal units, or simple-cycle
turbines instead of combined-cycle turbines) to ensure that additional ramping
requirements can be met. This was illustrated previously in Figure 2.3 where a

35
   This actually oversimplifies the situation. Some research indicates that these costs are not entirely
integration costs but a modeling artifact of how the “base case” in these studies is actually simulated
(Milligan and Kirby 2009).
36
   “Combining geographically diverse wind and solar resources into a single portfolio tends to reduce
hourly and sub-hourly variations in real-time output. This would result in a more consistent level of output
over a longer time frame, which could reduce the cost of wind integration” (Hurlbut 2009). For additional
analysis of spatial diversity, see also Palmintier et al. 2008.
37
   In 2008, more than 8.5 GW of wind was installed in the United States, reaching a total capacity of about
25.3 GW by the end of the year (AWEA 2009). In the same year, 0.3 GW of solar PV was installed,
reaching a total capacity of about 1 GW (Sherwood 2009).
38
   The impacts of CSP are largely unquantified as well. However, it is expected that the impact of CSP on
short time scales will be significantly less than PV, because CSP has significant “thermal inertia” in the
system that will minimize high-frequency ramping events. Furthermore, CSP has the potential advantage of
utilizing high-efficiency thermal storage discussed in Section 5.

                                                    21
“nonoptimal” mix of generators was needed to provide the ability to adjust output in
response to contingencies and other variations in demand. This combination of higher
fuel costs and lower-efficiency units results in increased cost of fuel per unit of electricity
generated as opposed to the “no-wind” cases. 39 Additional fuel costs occur from keeping
units at part-load, ready to respond to the variability, or from more frequent unit starts.
The costs associated with unit commitment or scheduling are also largely captured in
increased fuel costs. Most large thermal generators must be scheduled several hours (or
even days) in advance to be ready when needed. Ideally, utilities schedule and operate
only as many plants as needed to meet energy and reserve requirements at each moment
in time. If utilities over-schedule (turn on too many plants), they will have many plants
running at part-load, and have incurred higher than needed start-up costs. So, if they
under-predict the wind, they will commit and start up too many plants, which incurs
greater fuel (and other) costs than needed if the wind and corresponding net load had
been forecasted accurately. Conversely, if the wind forecast is too high and the net load is
higher than expected, insufficient thermal generation may be committed to cover the
unexpected shortfall in capacity. A worst-case scenario would be a partial blackout; but
the likely result is the use of high-cost “quick-start” units in real-time, purchasing
expensive energy from neighboring utilities (if available), or paying customers a
premium to curtail load – all while lower cost units are sitting idle. An example of this is
the ERCOT event of Feb. 26, 2008 (Ela and Kirby 2008). On this date, a combination of
events – including a greater than predicted demand for energy, a forced outage of a
conventional unit, the wind forecast not being given to the system operators, and a lower
than expected wind output – resulted in too little capacity online to meet load. As a
result, the ERCOT system needed to deploy high-cost quick-start units, as well as pay
customers to curtail load through its “load acting as a resource” program. 40 All of this
occurred while lower-cost units were idle because the combination of events was
unanticipated. 41


39
   It should be noted that these increased costs are associated with the “residual” part of the system that
provides the load not met by VG. This is often a source of confusion and is sometimes interpreted as an
increase in fuel use and emissions of the total system – implying that the additional reserve requirements of
VG somehow actually increase fuel use and emissions of the system, or that VG has a net negative impact
on emissions. This is not the case, and integration studies have universally concluded that any increase in
fuel use associated with reserves for VG is much smaller than overall avoided fuel and emissions from
displaced conventional generation.
40
   Customers with interruptible loads that can meet certain performance requirements may be qualified to
provide operating reserves under the Load Acting as a Resource (LaaR) program. In eligible ancillary
services (AS) markets, the value of the LaaR load reduction is equal to that of an increase in generation by
a generating plant. See http://www.ercot.com/services/programs/load/laar/
41
   This issue has important implications for the use of storage or any other device used to mitigate
uncertainty. Energy storage, like any other generator, needs to be scheduled – a storage device used for
load leveling may not be able to simultaneously provide hedging against under-forecasted wind, because it
may already be discharging.

                                                     22
While the bulk of the costs associated with wind integration are due to fuel use, the
increased cycling also increases wear and tear on generators, which imposes extra
maintenance costs. 42

Results from wind integration studies almost universally come to the conclusion that at
the penetrations studied to date (up to about 30% on an energy basis), the analyzed
systems do not need additional energy storage to accommodate wind’s variability and
maintain reliable service. 43 In the studied systems, no new generation technologies are
required; but there are some potentially significant operational changes needed to
maintain the present level of reliability (along with significant transmission additions
needed to exchange resources over larger areas). 44 However, they do not necessarily find
the “cost optimal” solution, which may include energy storage or some alternative mix of
generation to further reduce the cost of wind integration. Furthermore, these studies have
not evaluated much higher penetration levels of RE, where additional system constraints
may require additional enabling technologies such as energy storage.

4.2 Limiting Factors for Integration of Wind and Solar Energy
To date, integration studies in the United States have found that variable generation
sources can be incorporated into the grid by changing operational practices to address the
increased ramping requirements over various timescales. At higher penetrations (beyond
those already studied), the required ramp ranges will increase, which adds additional
costs and the need for fast-responding generation resources. However, there are
additional constraints on the system that will present additional challenges. These
constraints are based on the simple coincidence of renewable energy supply and demand
for electricity, combined with the operational limits on generators providing baseload
power and operating reserves. Of the four operational cost impacts listed in the beginning
of Section 4 (regulation, load following, scheduling, and ramping range), only the first
three present major quantifiable costs in U.S. studies as of the end of 2009. Yet, it is the
fourth constraint that may present an economic upper limit on variable renewable
penetration without the use of enabling technologies. 45

As discussed in Section 1, in current electric power systems, electricity is generated by
two general types of generators: baseload generators, which run at nearly constant output;
and load-following units (including both intermediate load and peaking plants), which
meet the variation in demand as well as provide operating reserves. At current
penetrations of wind and solar in the United States, and at the levels studied in most
integration studies, wind and solar generation primarily displaces flexible load-following
42
   A number of utilities have expressed the opinion that these costs are not well-captured in previous wind
integration studies. This issue is discussed later in this report.
43
   This also explains why no significant new storage has been developed in the United States or Europe
despite the 25 GW and 65 GW of wind development, respectively, as of the end of 2008 (EWEA 2009).
44
   The more recent U.S. studies of very high penetration (the Western Wind and Solar Integration Study
and the Eastern Wind Integration Study) require power and energy exchanges over larger areas than
typically occur in the existing system (Milligan et al. 2009a).
45
   One additional challenge in a high-VG grid is the potential decrease in mechanical inertia that helps
maintain system frequency. This concern is not well understood and could be mitigated by a variety of
technologies including improved controls on wind generators, or other sources of real or virtual inertia that
could include energy storage. See, for example, Doherty et al. (forthcoming).

                                                     23
generators. Figures 4.2 and 4.3 illustrate this issue by providing the impacts of increasing
amounts of wind generation in a simulated grid. 46 In Figure 4.2, wind provides 8.5 % of
the energy in this four-day period and displaces the output from a mix of gas-fired units,
which are already typically used to follow load. Because these generators are designed to
vary output, they can do this with modest cost penalties as analyzed in the wind
integration studies discussed previously.


                      Load      Net Load           Load Met by Inflexible Generation          Wind
          70000

          60000

          50000

          40000
     MW


          30000

          20000

          10000

              0
                  0                  24                   48                   72                    96
                                                       Hours

          Figure 4.2. Dispatch with low VG penetration (wind providing 8.5% of load)


At higher penetration of RE, the ability of conventional generators to reduce output
becomes an increasing concern. In Figure 4.3, wind now provides 16% of the total
demand in this four-day period. Variable renewables begin to displace units that are
traditionally not cycled, and the ability of these thermal generators to reduce output may
become constrained. If the baseload generators cannot reduce output (and some other use
cannot be found for this “excess generation”), 47 then wind energy will need to be
curtailed – this occurs in the overnight periods in the first two days of this scenario.


46
   This simulation uses historical load data from ERCOT from 2005 and simulated wind data for the same
year provided by AWS Truewinds. While the wind and load data is from ERCOT, the mix of generators
(flexible and inflexible) is hypothetical and used only to illustrate the impact of VG. For additional
discussion of the wind data, see GE Energy 2008.
47
   The alternative to curtailment is finding some alternative use for this energy through enabling techniques
and technologies, which may include energy storage. These options are discussed in Section 5.

                                                     24
Wind                                 Net Load Met by Inflexible Generation

          70000       Curtailed Wind                       Net Load Met by Flexible Generation

                      Load
          60000

          50000

          40000
     MW


          30000

          20000

          10000

             0
                  0                    24             48                      72                   96
                                                   Hours

           Figure 4.3. Dispatch with higher VG penetration (wind providing 16% of load)
Utilities in the United States have expressed concern about their systems “bottoming out”
due to the minimum generation requirements during overnight hours, and being unable to
accommodate more variable generation during these periods. Minimum generation
constraints (and resulting wind curtailment) are already a real occurrence in the Danish
power system, which has a large installed base of wind generation (Ackermann et al.
2009). Due to its reliance on combined heat and power electricity plants for district
heating, the Danish system needs to keep many of its power plants running for heat.
Large demand for heat sometimes occurs during cold, windy evenings, when electricity
demand is low and wind generation is high. This combination sometimes results in an
oversupply of generation, which forces curtailment of wind energy production. The need
to curtail wind due to minimum load constraints has also been identified as an important
component of future power systems in the United States. 48 Modern wind turbines can
reliably curtail output, but this is largely undesirable because curtailment throws away
cost-free and emissions-free energy. 49

The actual minimum load is a function of several factors including the mix of
conventional generation, as well as the amount of reserves and the types of generators
providing those reserves. The ability to cycle conventional units is both a technical and
economic issue – there are technical limits to how much power plants of all types can be

48
   “During over-generation periods, when dispatchable generation plants are already operating at their
minimum levels, the California ISO needs to have an ability to curtail wind generation on an as-needed
basis.” (CAISO 2007)
49
   When curtailing output, wind or other VG can supply operating reserves. In some cases, the value of
curtailed energy may actually exceed the value of energy, but the primary value of VG is displacing
conventional generation. While Figure 4.3 curtails renewable generation, it not clear which plant “should”
be curtailed. Ignoring operational constraints, from a strict economic sense, VG has a lower cost of energy
and lower emissions; therefore, it should be curtailed last.

                                                    25
turned down. Large coal plants are often restricted to operating in the range of 50-100%
of full capacity, but there is significant uncertainty about this limit. This is partly because
utilities often have limited experience with cycling large coal plants, and have expressed
concern about potentially excessive maintenance impacts 50 and even safety. It should be
noted that because cycling costs are not universally captured in operational models, they
may be ignored or underestimated in wind and solar integration studies. 51 The impact of
VG on power plant cycling is an active area of research, especially considering the
evolving grid and introduction of more responsive generation. 52

It is unclear what changes in operation practices or generator modification utilities will
need to make to cycle below their current minimum load points, which now typically
occur during the early morning in spring. In a number of markets, energy prices have
dropped below the actual variable (fuel) cost of producing electricity on a number of
occasions. This indicates that power plant operators are willing to sell energy at a loss to
avoid further reducing output. Figure 4.4 provides one example in the PJM market in
2002, where the price of electricity fell below the variable cost of generation (indicated
by the dotted line) 53 from coal-fired units for about 100 hours during periods near the
annual minimum. While not definitive, this indicates that under current operational
practices, utilities in some systems may be uncomfortable or unable to cycle much below
current minimum load levels. 54 In other locations, there may be a greater operating range
if plant operators become more comfortable with cycling individual units. As an example,
a recent wind integration study of the existing ERCOT system suggested the capability of
the system to cycle down to a net load of about 13 GW, compared to the recent annual
minimum loads of about 20 GW. However, this would require the coal fleet to cycle to
below 50% of rated capacity, and gas plants to perform over an even greater cycling
range (GE Energy 2008).


50
   “Cycling operations, that include on/off startup/shutdown operations, on-load cycling, and high
frequency MW changes for automatic generation control (AGC), can be very damaging to power
generation equipment.” However, these costs can be very difficult to quantify, especially isolating the
additional costs associated with cycling above and beyond normal operations (Lefton et al. 2006).
51
   Wind integration studies typically use proprietary software and data sets, and do not always state which
costs are and are not included. However, in the Western Wind and Solar Integration Study (the highest
penetration U.S. integration study as of 2009) the study states: “‘Wear and tear’ costs due to increased or
harder cycling of units were not taken into account because these have not been adequately quantified.”
(Lew et al. 2009).
52
   A more detailed analysis of the relationship between wind penetration and plant cycling is provided by
Troy et al. (forthcoming).
53
   During this year, the average price paid for coal in this region was about $31/ton. With a typical heat rate
of about 10,500 BTU, this translates into a variable cost of $12-14/MWh. This cost can be observed in
Figure 4.4 as the “floor” cluster of points at this level. Points below this level represent bids that are less
than the cost of generation, but not necessarily uneconomic if the alternative is excessive cycling-induced
maintenance or even a forced shutdown and very expensive restart of a coal generator.
54
   Minimum load points would be less of a constraint if power plants could be quickly shut down and
started up at low costs. With the exception of certain peaking plants such as aeroderivative turbines and
fast-starting reciprocating engines, most plants have minimum up-and-down times, and require several
hours to restart (at considerable cost).

                                                      26
250

 Wholesale Price ($/MWh)   200

                           150

                           100

                           50

                            0
                                 0   10000   20000     30000     40000   50000                           60000
                                                     Load (MW)
                                                                                                    35

                                                                                                    30


                                                                          Wholesale Price ($/MWh)
                                                                                                    25

                                                                                                    20

                                                                                                    15

                                                                                                    10

                                                                                                    5

                                                                                                    0
                                                                                                    18000        20000     22000     24000   26000
                                                                                                                         Load (MW)


                                        Figure 4.4. Relationship between price and load in PJM in 2002


Overall, the ability to accommodate a variable and uncertain net load has been described
as a system’s flexibility. System flexibility varies by system and over time as new
technologies are developed and power plants are retired. In addition, VG deployment in
the United States is still relatively small, and utilities have yet to evaluate the true cycling
limits on conventional generators and their associated costs. Also, the additional reserve
requirements due to VG at high penetration are still uncertain. As a result, it is not
possible to precisely estimate the costs of VG integration or the amount of curtailment at
very high penetration; it is also difficult to define with certainty the value of energy
storage or other enabling technologies. It is clear, however, that substantial increase in the
penetration of wind energy without storage will require changes in grid operation to
reduce curtailment.

Figure 4.5 illustrates the fraction of a system’s peak load derived from inflexible units as
a function of the minimum load point. This is also expressed more generally as the
system’s “flexibility factor,” which is defined as the fraction below the annual peak to
which conventional generators can cycle (Denholm and Margolis 2007a and 2007b). In
the current grid, the annual minimum load point is typically 30%-40% of annual peak
load (or a flexibility factor of 60%-70%). If units cannot be cycled below this point, they
will provide 55%-70% of a system’s energy; and even with storage, this level of
inflexibility leaves only 30%-40% of a system’s energy for variable resources. One of the
major conclusions of wind integration studies looking at higher penetrations is that


                                                                                                          27
minimum load points will need to be lowered substantially below their current annual
minimums. 55


                                                                 Flexibility Factor
                                             100%       90%       80%        70%       60%        50%
                                          100%
            % of Energy From Inflexible

                                                                                  Typical
                                           90%
                                                                               Minimum Load
                                           80%
                                           70%
                    Generators


                                           60%
                                           50%
                                           40%
                                           30%
                                           20%
                                           10%
                                            0%
                                                 0%     10%       20%        30%       40%        50%
                                                      Minimum Load as a Fraction of Peak Load


                                            Figure 4.5. Contribution from inflexible generation
Alternatively, it is possible to evaluate the relationship between system flexibility and
large-scale penetration of VG, both with and without energy storage or other enabling
technologies. Figure 4.6 shows an example of how flexibility affects the potential
curtailment of wind and solar energy when deployed without storage. These two charts
superimpose load data in ERCOT from 2005 with a spatially diverse set of simulated
wind and solar data from the same year. 56,57 The simulation places 19 GW of wind and
11 GW of solar (representing an 80%/20% mix of wind and solar on an energy basis) into
the 2005 ERCOT system, which had a peak demand of 60.3 GW. In the left chart, the
system is assumed to be unable to cycle below the 2005 minimum point of 21 GW,
resulting in substantial VG curtailment. In this simulation, wind and solar provide 20% of
the grid’s annual energy, and 21% of the total renewable energy production is curtailed.
The right graph shows the result of increasing flexibility, allowing for a minimum load
point of 13 GW. Curtailment has been reduced to less than 3%, and the same amount of
variable renewables now provides about 25% of the system’s annual energy.


55
   This is noted in previous wind integration studies such as the ERCOT study (GE 2008), and the more
recent Eastern and Western Interconnect studies. “As the penetration of wind and solar increase, the impact
on base-load coal increases, becoming very challenging at the 30% penetration.” (Milligan et al. 2009b).
56
   Historically, many estimates of the limits of wind penetration have used data from a single or very small
set of wind power plants, and often a small balancing area. Without spatial diversity of resource and load,
this leads to both excessive ramp rates and excessive curtailment.
57
   The data set is the same as from Figures 4.2 and 4.3, with solar data derived from the National Solar
Radiation Database. See Denholm and Margolis 2008 for additional details. The data was processed using
the REFlex Model, which compares hourly electricity demand with VG supply and calculates curtailments
as a function of system flexibility based on minimum load constraints. The model is described in more
detail in Denholm and Margolis 2007a and 2007b.

                                                                    28
Load Met by Renewable Energy                Net Load Met by Flexible Generation
      50000       Curtailed Renewable Energy                  Net Load Met by Inflexible Generation
      45000       Renewable Energy
      40000
      35000
      30000

                                                                                                                Inflexible System -
 MW


      25000
      20000                                                                                                      Minimum Load of
      15000                                                                                                            21 GW
      10000
      5000
         0                                                                                                             Decreased
              0                 24                     48                       72                  96                 curtailment
                                                   Hours

                                                            Net Load Met by Inflexible Generation        Curtailed Renewable Energy

                                          50000             Net Load Met by Flexible Generation          Load Met by Renewable Energy
                                                            Renewable Energy
                                          45000
                                          40000
                                          35000
                                          30000
                                     MW


                                          25000
      More Flexible                       20000
        System -                          15000
      Minimum Load                        10000
        of 13 GW                           5000
                                               0
                                                   0                       24                  48                    72                 96
                                                                                            Hours

          Figure 4.6. Effect of decreasing minimum load point on increased use of RE
These results can be evaluated more generally by examining the amount of curtailment
that will result without energy storage as a function of system flexibility. Figure 4.7
shows example results, with three different minimum load/flexibility factors. The first
curve illustrates the curtailment that would result if the system could not cycle below its
2005 annual minimum load of 21 GW. The second curve uses a minimum load of 12
GW, which corresponds roughly to the assumptions used in the 2008 ERCOT wind study
(GE 2008). The third curve corresponds to a 6 GW minimum load, which largely
eliminates baseload units from the generation mix, replacing them with more flexible
units. 58


58
   It should be noted that significant changes in the generation mix and corresponding changes in system
flexibility could result from CO2 emissions constraints. Increased cost of carbon could motivate greater use
of natural gas generation, and reduce use of coal, both of which would tend to increase system flexibility,
and allow greater economic use of VG. This, in turn, would decrease fuel use and the capacity factor of
thermal generators, which would also tend to increase the use of gas-fired generation and decrease the use
of coal as the economic optimal mix of generation. For additional discussion, see Lamont 2008.

                                                                      29
The role of energy storage with renewable electricity generation

More Related Content

What's hot

Project 2011 April
Project 2011 AprilProject 2011 April
Project 2011 AprilCGC CGC
 
20 20 Vision Cleantech
20 20 Vision Cleantech20 20 Vision Cleantech
20 20 Vision Cleantechmnewson
 
Smart Power: the Future of Electric Utilities in the US and China, Peter Fox-...
Smart Power: the Future of Electric Utilities in the US and China, Peter Fox-...Smart Power: the Future of Electric Utilities in the US and China, Peter Fox-...
Smart Power: the Future of Electric Utilities in the US and China, Peter Fox-...Beijing Energy Network
 
xcel energy 2D SNSPMPlan_Xcel_Energy_12052007
xcel energy  2D SNSPMPlan_Xcel_Energy_12052007xcel energy  2D SNSPMPlan_Xcel_Energy_12052007
xcel energy 2D SNSPMPlan_Xcel_Energy_12052007finance26
 
Eaton U.S. Blackout Tracker 2011 Annual Report
Eaton U.S. Blackout Tracker 2011 Annual ReportEaton U.S. Blackout Tracker 2011 Annual Report
Eaton U.S. Blackout Tracker 2011 Annual ReportMike DeCamp
 

What's hot (7)

Project 2011 April
Project 2011 AprilProject 2011 April
Project 2011 April
 
20 20 Vision Cleantech
20 20 Vision Cleantech20 20 Vision Cleantech
20 20 Vision Cleantech
 
xel_021104
xel_021104xel_021104
xel_021104
 
XEL_052406
XEL_052406XEL_052406
XEL_052406
 
Smart Power: the Future of Electric Utilities in the US and China, Peter Fox-...
Smart Power: the Future of Electric Utilities in the US and China, Peter Fox-...Smart Power: the Future of Electric Utilities in the US and China, Peter Fox-...
Smart Power: the Future of Electric Utilities in the US and China, Peter Fox-...
 
xcel energy 2D SNSPMPlan_Xcel_Energy_12052007
xcel energy  2D SNSPMPlan_Xcel_Energy_12052007xcel energy  2D SNSPMPlan_Xcel_Energy_12052007
xcel energy 2D SNSPMPlan_Xcel_Energy_12052007
 
Eaton U.S. Blackout Tracker 2011 Annual Report
Eaton U.S. Blackout Tracker 2011 Annual ReportEaton U.S. Blackout Tracker 2011 Annual Report
Eaton U.S. Blackout Tracker 2011 Annual Report
 

Viewers also liked

Energy storage technologies
Energy storage technologiesEnergy storage technologies
Energy storage technologiessrikanth reddy
 
infographic on Storage and integration of renewable energy
infographic on Storage and integration of renewable energyinfographic on Storage and integration of renewable energy
infographic on Storage and integration of renewable energySandra van Breugel-Bredewout
 
Landwirt als Energiewirt
Landwirt als EnergiewirtLandwirt als Energiewirt
Landwirt als Energiewirtsbvusp
 
Future towards renewable hydrogen storage and powered applications
Future towards renewable hydrogen storage and powered applicationsFuture towards renewable hydrogen storage and powered applications
Future towards renewable hydrogen storage and powered applicationsVijayalakshmi Ganesan
 
Cybercrime law in the philippines
Cybercrime law in the philippinesCybercrime law in the philippines
Cybercrime law in the philippinesian_oguis
 
MicroGrid and Energy Storage System COMPLETE DETAILS NEW PPT
MicroGrid and Energy Storage System COMPLETE DETAILS NEW PPTMicroGrid and Energy Storage System COMPLETE DETAILS NEW PPT
MicroGrid and Energy Storage System COMPLETE DETAILS NEW PPT Abin Baby
 
Biomass As A Renewable Energy Source: The case of Converting Municipal Solid...
Biomass As A Renewable Energy Source: The case of Converting Municipal Solid...Biomass As A Renewable Energy Source: The case of Converting Municipal Solid...
Biomass As A Renewable Energy Source: The case of Converting Municipal Solid...IEEE UKM Student Beanch
 
Renewable_energy__sources_and_methods__green_technology_
  Renewable_energy__sources_and_methods__green_technology_  Renewable_energy__sources_and_methods__green_technology_
Renewable_energy__sources_and_methods__green_technology_Frost & Sullivan
 
Comparing Wind Power and Other Renewable Energy Sources
Comparing Wind Power and Other Renewable Energy SourcesComparing Wind Power and Other Renewable Energy Sources
Comparing Wind Power and Other Renewable Energy SourcesWindTurbines.net
 
regenerative und erneuerbare Energien
regenerative und erneuerbare Energienregenerative und erneuerbare Energien
regenerative und erneuerbare Energienhochhuth
 
Erneuerbare Energien
Erneuerbare EnergienErneuerbare Energien
Erneuerbare Energiensocio190
 

Viewers also liked (15)

Energy storage technologies
Energy storage technologiesEnergy storage technologies
Energy storage technologies
 
infographic on Storage and integration of renewable energy
infographic on Storage and integration of renewable energyinfographic on Storage and integration of renewable energy
infographic on Storage and integration of renewable energy
 
BESS presentation
BESS presentationBESS presentation
BESS presentation
 
Landwirt als Energiewirt
Landwirt als EnergiewirtLandwirt als Energiewirt
Landwirt als Energiewirt
 
Future towards renewable hydrogen storage and powered applications
Future towards renewable hydrogen storage and powered applicationsFuture towards renewable hydrogen storage and powered applications
Future towards renewable hydrogen storage and powered applications
 
Cybercrime law in the philippines
Cybercrime law in the philippinesCybercrime law in the philippines
Cybercrime law in the philippines
 
MicroGrid and Energy Storage System COMPLETE DETAILS NEW PPT
MicroGrid and Energy Storage System COMPLETE DETAILS NEW PPTMicroGrid and Energy Storage System COMPLETE DETAILS NEW PPT
MicroGrid and Energy Storage System COMPLETE DETAILS NEW PPT
 
A Hybrid Wind and Solar Energy System with Battery Energy Storage for an Isol...
A Hybrid Wind and Solar Energy System with Battery Energy Storage for an Isol...A Hybrid Wind and Solar Energy System with Battery Energy Storage for an Isol...
A Hybrid Wind and Solar Energy System with Battery Energy Storage for an Isol...
 
Biomass As A Renewable Energy Source: The case of Converting Municipal Solid...
Biomass As A Renewable Energy Source: The case of Converting Municipal Solid...Biomass As A Renewable Energy Source: The case of Converting Municipal Solid...
Biomass As A Renewable Energy Source: The case of Converting Municipal Solid...
 
Energie
EnergieEnergie
Energie
 
PPT ON NON-CONVENTIONAL ENERGY SOURCES (Renewable energy resources)
PPT ON NON-CONVENTIONAL ENERGY SOURCES (Renewable energy resources)PPT ON NON-CONVENTIONAL ENERGY SOURCES (Renewable energy resources)
PPT ON NON-CONVENTIONAL ENERGY SOURCES (Renewable energy resources)
 
Renewable_energy__sources_and_methods__green_technology_
  Renewable_energy__sources_and_methods__green_technology_  Renewable_energy__sources_and_methods__green_technology_
Renewable_energy__sources_and_methods__green_technology_
 
Comparing Wind Power and Other Renewable Energy Sources
Comparing Wind Power and Other Renewable Energy SourcesComparing Wind Power and Other Renewable Energy Sources
Comparing Wind Power and Other Renewable Energy Sources
 
regenerative und erneuerbare Energien
regenerative und erneuerbare Energienregenerative und erneuerbare Energien
regenerative und erneuerbare Energien
 
Erneuerbare Energien
Erneuerbare EnergienErneuerbare Energien
Erneuerbare Energien
 

Similar to The role of energy storage with renewable electricity generation

בחינת הצללה ברמת המודול לאלקטרוניקת אנרגיה
בחינת הצללה ברמת המודול לאלקטרוניקת אנרגיהבחינת הצללה ברמת המודול לאלקטרוניקת אנרגיה
בחינת הצללה ברמת המודול לאלקטרוניקת אנרגיהTashtiot media
 
ORNL econ analysis of repurposed EV batteries for Stationary Applications
ORNL econ analysis of repurposed EV batteries for Stationary ApplicationsORNL econ analysis of repurposed EV batteries for Stationary Applications
ORNL econ analysis of repurposed EV batteries for Stationary ApplicationsUCSD-Strategic-Energy
 
Innovations In Wind And Solar Pv Financing
Innovations In Wind And Solar Pv FinancingInnovations In Wind And Solar Pv Financing
Innovations In Wind And Solar Pv FinancingGlenn Klith Andersen
 
Maintaining Reliability in the Modern Power System
Maintaining Reliability in the Modern Power System Maintaining Reliability in the Modern Power System
Maintaining Reliability in the Modern Power System Power System Operation
 
WIND INTEGRATION AND TRANSMISSION STUDY
WIND INTEGRATION AND TRANSMISSION STUDYWIND INTEGRATION AND TRANSMISSION STUDY
WIND INTEGRATION AND TRANSMISSION STUDYPower System Operation
 
economic-and-resiliency-impact-of-pv-and-storage
economic-and-resiliency-impact-of-pv-and-storageeconomic-and-resiliency-impact-of-pv-and-storage
economic-and-resiliency-impact-of-pv-and-storageTravis Simpkins
 
Operating Reserves and Variable Generation
Operating Reserves and Variable GenerationOperating Reserves and Variable Generation
Operating Reserves and Variable GenerationPower System Operation
 
Nrel western wind study
Nrel western wind studyNrel western wind study
Nrel western wind studyTCLABZ.com
 
2009 Wind Technologies market report us departm
2009 Wind Technologies market report   us departm2009 Wind Technologies market report   us departm
2009 Wind Technologies market report us departmGlenn Klith Andersen
 
Dr Dev Kambhampati | Cybersecurity Guide for Utilities
Dr Dev Kambhampati | Cybersecurity Guide for UtilitiesDr Dev Kambhampati | Cybersecurity Guide for Utilities
Dr Dev Kambhampati | Cybersecurity Guide for UtilitiesDr Dev Kambhampati
 

Similar to The role of energy storage with renewable electricity generation (20)

בחינת הצללה ברמת המודול לאלקטרוניקת אנרגיה
בחינת הצללה ברמת המודול לאלקטרוניקת אנרגיהבחינת הצללה ברמת המודול לאלקטרוניקת אנרגיה
בחינת הצללה ברמת המודול לאלקטרוניקת אנרגיה
 
Hydrogen Supply
Hydrogen SupplyHydrogen Supply
Hydrogen Supply
 
ORNL econ analysis of repurposed EV batteries for Stationary Applications
ORNL econ analysis of repurposed EV batteries for Stationary ApplicationsORNL econ analysis of repurposed EV batteries for Stationary Applications
ORNL econ analysis of repurposed EV batteries for Stationary Applications
 
Nrel
NrelNrel
Nrel
 
Innovations In Wind And Solar Pv Financing
Innovations In Wind And Solar Pv FinancingInnovations In Wind And Solar Pv Financing
Innovations In Wind And Solar Pv Financing
 
20% wind energy by 2030
20% wind energy by 203020% wind energy by 2030
20% wind energy by 2030
 
Maintaining Reliability in the Modern Power System
Maintaining Reliability in the Modern Power System Maintaining Reliability in the Modern Power System
Maintaining Reliability in the Modern Power System
 
WIND INTEGRATION AND TRANSMISSION STUDY
WIND INTEGRATION AND TRANSMISSION STUDYWIND INTEGRATION AND TRANSMISSION STUDY
WIND INTEGRATION AND TRANSMISSION STUDY
 
economic-and-resiliency-impact-of-pv-and-storage
economic-and-resiliency-impact-of-pv-and-storageeconomic-and-resiliency-impact-of-pv-and-storage
economic-and-resiliency-impact-of-pv-and-storage
 
Operating Reserves and Variable Generation
Operating Reserves and Variable GenerationOperating Reserves and Variable Generation
Operating Reserves and Variable Generation
 
Nrel western wind study
Nrel western wind studyNrel western wind study
Nrel western wind study
 
45834.pdf
45834.pdf45834.pdf
45834.pdf
 
2009 Wind Technologies market report us departm
2009 Wind Technologies market report   us departm2009 Wind Technologies market report   us departm
2009 Wind Technologies market report us departm
 
37358
3735837358
37358
 
Pnnl 16263
Pnnl 16263Pnnl 16263
Pnnl 16263
 
St. louis bus b20
St. louis bus b20St. louis bus b20
St. louis bus b20
 
St. louis bus b20
St. louis bus b20St. louis bus b20
St. louis bus b20
 
St. louis b20 bus evalution
St. louis b20 bus evalution St. louis b20 bus evalution
St. louis b20 bus evalution
 
Ze bs
Ze bsZe bs
Ze bs
 
Dr Dev Kambhampati | Cybersecurity Guide for Utilities
Dr Dev Kambhampati | Cybersecurity Guide for UtilitiesDr Dev Kambhampati | Cybersecurity Guide for Utilities
Dr Dev Kambhampati | Cybersecurity Guide for Utilities
 

More from Glenn Klith Andersen

Klimaborgertingets anbefalinger april 2021
Klimaborgertingets anbefalinger april 2021Klimaborgertingets anbefalinger april 2021
Klimaborgertingets anbefalinger april 2021Glenn Klith Andersen
 
Plantekatalog, planter der understøtter biodiversitet
Plantekatalog, planter der understøtter biodiversitetPlantekatalog, planter der understøtter biodiversitet
Plantekatalog, planter der understøtter biodiversitetGlenn Klith Andersen
 
Barcelona digital city plan - Putting technology at the service of people.
Barcelona digital city plan - Putting technology at the service of people.Barcelona digital city plan - Putting technology at the service of people.
Barcelona digital city plan - Putting technology at the service of people.Glenn Klith Andersen
 
Introduction to the Compassionate Systems Framework in Schools
Introduction to the Compassionate Systems Framework in SchoolsIntroduction to the Compassionate Systems Framework in Schools
Introduction to the Compassionate Systems Framework in SchoolsGlenn Klith Andersen
 
Verdensmål 11: Bæredygtige byer og lokalsamfund, jan. 2019
Verdensmål 11: Bæredygtige byer og lokalsamfund, jan. 2019Verdensmål 11: Bæredygtige byer og lokalsamfund, jan. 2019
Verdensmål 11: Bæredygtige byer og lokalsamfund, jan. 2019Glenn Klith Andersen
 
FN's 17 verdensmaal af Steen Hildebrandt
FN's 17 verdensmaal af Steen HildebrandtFN's 17 verdensmaal af Steen Hildebrandt
FN's 17 verdensmaal af Steen HildebrandtGlenn Klith Andersen
 
17. Sustainable Development Goals UN
17. Sustainable Development Goals UN17. Sustainable Development Goals UN
17. Sustainable Development Goals UNGlenn Klith Andersen
 
Gudenåens Passage ved Tangeværket
Gudenåens Passage ved TangeværketGudenåens Passage ved Tangeværket
Gudenåens Passage ved TangeværketGlenn Klith Andersen
 
Rebalancing Society by Henry Mintzberg
Rebalancing Society by Henry MintzbergRebalancing Society by Henry Mintzberg
Rebalancing Society by Henry MintzbergGlenn Klith Andersen
 
Innovators ecosystem by Vinod Khosla
Innovators ecosystem by Vinod KhoslaInnovators ecosystem by Vinod Khosla
Innovators ecosystem by Vinod KhoslaGlenn Klith Andersen
 
Black Swans thesis of energy transformation
Black Swans thesis of energy transformationBlack Swans thesis of energy transformation
Black Swans thesis of energy transformationGlenn Klith Andersen
 
Ellen mac arthur foundation towards the circular economy vol.2
Ellen mac arthur foundation towards the circular economy vol.2Ellen mac arthur foundation towards the circular economy vol.2
Ellen mac arthur foundation towards the circular economy vol.2Glenn Klith Andersen
 
Ellen mac arthur foundation towards the circular economy vol.1
Ellen mac arthur foundation towards the circular economy vol.1Ellen mac arthur foundation towards the circular economy vol.1
Ellen mac arthur foundation towards the circular economy vol.1Glenn Klith Andersen
 
Rethinking sustainable consumption consumer study 2012
Rethinking sustainable consumption consumer study 2012Rethinking sustainable consumption consumer study 2012
Rethinking sustainable consumption consumer study 2012Glenn Klith Andersen
 
The Future Quotient: 50 Stars in Seriously Long Term Innovation
The Future Quotient: 50 Stars in Seriously Long Term InnovationThe Future Quotient: 50 Stars in Seriously Long Term Innovation
The Future Quotient: 50 Stars in Seriously Long Term InnovationGlenn Klith Andersen
 
The impact of a corporate culture of sustainability on corporate behavior and...
The impact of a corporate culture of sustainability on corporate behavior and...The impact of a corporate culture of sustainability on corporate behavior and...
The impact of a corporate culture of sustainability on corporate behavior and...Glenn Klith Andersen
 
Regeneration Project: Unfinished Business - White Paper
Regeneration Project: Unfinished Business - White PaperRegeneration Project: Unfinished Business - White Paper
Regeneration Project: Unfinished Business - White PaperGlenn Klith Andersen
 

More from Glenn Klith Andersen (20)

Klimaborgertingets anbefalinger april 2021
Klimaborgertingets anbefalinger april 2021Klimaborgertingets anbefalinger april 2021
Klimaborgertingets anbefalinger april 2021
 
Plantekatalog, planter der understøtter biodiversitet
Plantekatalog, planter der understøtter biodiversitetPlantekatalog, planter der understøtter biodiversitet
Plantekatalog, planter der understøtter biodiversitet
 
Klimarådet 70% Reduktion 2030
Klimarådet 70% Reduktion 2030Klimarådet 70% Reduktion 2030
Klimarådet 70% Reduktion 2030
 
Barcelona digital city plan - Putting technology at the service of people.
Barcelona digital city plan - Putting technology at the service of people.Barcelona digital city plan - Putting technology at the service of people.
Barcelona digital city plan - Putting technology at the service of people.
 
Introduction to the Compassionate Systems Framework in Schools
Introduction to the Compassionate Systems Framework in SchoolsIntroduction to the Compassionate Systems Framework in Schools
Introduction to the Compassionate Systems Framework in Schools
 
Verdensmål 11: Bæredygtige byer og lokalsamfund, jan. 2019
Verdensmål 11: Bæredygtige byer og lokalsamfund, jan. 2019Verdensmål 11: Bæredygtige byer og lokalsamfund, jan. 2019
Verdensmål 11: Bæredygtige byer og lokalsamfund, jan. 2019
 
FN's 17 verdensmaal af Steen Hildebrandt
FN's 17 verdensmaal af Steen HildebrandtFN's 17 verdensmaal af Steen Hildebrandt
FN's 17 verdensmaal af Steen Hildebrandt
 
Omstilling frem mod 2030
Omstilling frem mod 2030Omstilling frem mod 2030
Omstilling frem mod 2030
 
17. Sustainable Development Goals UN
17. Sustainable Development Goals UN17. Sustainable Development Goals UN
17. Sustainable Development Goals UN
 
Omstilling med Omtanke - nov 2015
Omstilling med Omtanke - nov 2015Omstilling med Omtanke - nov 2015
Omstilling med Omtanke - nov 2015
 
Gudenåens Passage ved Tangeværket
Gudenåens Passage ved TangeværketGudenåens Passage ved Tangeværket
Gudenåens Passage ved Tangeværket
 
Rebalancing Society by Henry Mintzberg
Rebalancing Society by Henry MintzbergRebalancing Society by Henry Mintzberg
Rebalancing Society by Henry Mintzberg
 
Innovators ecosystem by Vinod Khosla
Innovators ecosystem by Vinod KhoslaInnovators ecosystem by Vinod Khosla
Innovators ecosystem by Vinod Khosla
 
Black Swans thesis of energy transformation
Black Swans thesis of energy transformationBlack Swans thesis of energy transformation
Black Swans thesis of energy transformation
 
Ellen mac arthur foundation towards the circular economy vol.2
Ellen mac arthur foundation towards the circular economy vol.2Ellen mac arthur foundation towards the circular economy vol.2
Ellen mac arthur foundation towards the circular economy vol.2
 
Ellen mac arthur foundation towards the circular economy vol.1
Ellen mac arthur foundation towards the circular economy vol.1Ellen mac arthur foundation towards the circular economy vol.1
Ellen mac arthur foundation towards the circular economy vol.1
 
Rethinking sustainable consumption consumer study 2012
Rethinking sustainable consumption consumer study 2012Rethinking sustainable consumption consumer study 2012
Rethinking sustainable consumption consumer study 2012
 
The Future Quotient: 50 Stars in Seriously Long Term Innovation
The Future Quotient: 50 Stars in Seriously Long Term InnovationThe Future Quotient: 50 Stars in Seriously Long Term Innovation
The Future Quotient: 50 Stars in Seriously Long Term Innovation
 
The impact of a corporate culture of sustainability on corporate behavior and...
The impact of a corporate culture of sustainability on corporate behavior and...The impact of a corporate culture of sustainability on corporate behavior and...
The impact of a corporate culture of sustainability on corporate behavior and...
 
Regeneration Project: Unfinished Business - White Paper
Regeneration Project: Unfinished Business - White PaperRegeneration Project: Unfinished Business - White Paper
Regeneration Project: Unfinished Business - White Paper
 

Recently uploaded

Interactive Powerpoint_How to Master effective communication
Interactive Powerpoint_How to Master effective communicationInteractive Powerpoint_How to Master effective communication
Interactive Powerpoint_How to Master effective communicationnomboosow
 
social pharmacy d-pharm 1st year by Pragati K. Mahajan
social pharmacy d-pharm 1st year by Pragati K. Mahajansocial pharmacy d-pharm 1st year by Pragati K. Mahajan
social pharmacy d-pharm 1st year by Pragati K. Mahajanpragatimahajan3
 
Student login on Anyboli platform.helpin
Student login on Anyboli platform.helpinStudent login on Anyboli platform.helpin
Student login on Anyboli platform.helpinRaunakKeshri1
 
Grant Readiness 101 TechSoup and Remy Consulting
Grant Readiness 101 TechSoup and Remy ConsultingGrant Readiness 101 TechSoup and Remy Consulting
Grant Readiness 101 TechSoup and Remy ConsultingTechSoup
 
SOCIAL AND HISTORICAL CONTEXT - LFTVD.pptx
SOCIAL AND HISTORICAL CONTEXT - LFTVD.pptxSOCIAL AND HISTORICAL CONTEXT - LFTVD.pptx
SOCIAL AND HISTORICAL CONTEXT - LFTVD.pptxiammrhaywood
 
Beyond the EU: DORA and NIS 2 Directive's Global Impact
Beyond the EU: DORA and NIS 2 Directive's Global ImpactBeyond the EU: DORA and NIS 2 Directive's Global Impact
Beyond the EU: DORA and NIS 2 Directive's Global ImpactPECB
 
The Most Excellent Way | 1 Corinthians 13
The Most Excellent Way | 1 Corinthians 13The Most Excellent Way | 1 Corinthians 13
The Most Excellent Way | 1 Corinthians 13Steve Thomason
 
Measures of Central Tendency: Mean, Median and Mode
Measures of Central Tendency: Mean, Median and ModeMeasures of Central Tendency: Mean, Median and Mode
Measures of Central Tendency: Mean, Median and ModeThiyagu K
 
Nutritional Needs Presentation - HLTH 104
Nutritional Needs Presentation - HLTH 104Nutritional Needs Presentation - HLTH 104
Nutritional Needs Presentation - HLTH 104misteraugie
 
Paris 2024 Olympic Geographies - an activity
Paris 2024 Olympic Geographies - an activityParis 2024 Olympic Geographies - an activity
Paris 2024 Olympic Geographies - an activityGeoBlogs
 
Disha NEET Physics Guide for classes 11 and 12.pdf
Disha NEET Physics Guide for classes 11 and 12.pdfDisha NEET Physics Guide for classes 11 and 12.pdf
Disha NEET Physics Guide for classes 11 and 12.pdfchloefrazer622
 
9548086042 for call girls in Indira Nagar with room service
9548086042  for call girls in Indira Nagar  with room service9548086042  for call girls in Indira Nagar  with room service
9548086042 for call girls in Indira Nagar with room servicediscovermytutordmt
 
Arihant handbook biology for class 11 .pdf
Arihant handbook biology for class 11 .pdfArihant handbook biology for class 11 .pdf
Arihant handbook biology for class 11 .pdfchloefrazer622
 
Separation of Lanthanides/ Lanthanides and Actinides
Separation of Lanthanides/ Lanthanides and ActinidesSeparation of Lanthanides/ Lanthanides and Actinides
Separation of Lanthanides/ Lanthanides and ActinidesFatimaKhan178732
 
Organic Name Reactions for the students and aspirants of Chemistry12th.pptx
Organic Name Reactions  for the students and aspirants of Chemistry12th.pptxOrganic Name Reactions  for the students and aspirants of Chemistry12th.pptx
Organic Name Reactions for the students and aspirants of Chemistry12th.pptxVS Mahajan Coaching Centre
 
BASLIQ CURRENT LOOKBOOK LOOKBOOK(1) (1).pdf
BASLIQ CURRENT LOOKBOOK  LOOKBOOK(1) (1).pdfBASLIQ CURRENT LOOKBOOK  LOOKBOOK(1) (1).pdf
BASLIQ CURRENT LOOKBOOK LOOKBOOK(1) (1).pdfSoniaTolstoy
 
POINT- BIOCHEMISTRY SEM 2 ENZYMES UNIT 5.pptx
POINT- BIOCHEMISTRY SEM 2 ENZYMES UNIT 5.pptxPOINT- BIOCHEMISTRY SEM 2 ENZYMES UNIT 5.pptx
POINT- BIOCHEMISTRY SEM 2 ENZYMES UNIT 5.pptxSayali Powar
 
1029 - Danh muc Sach Giao Khoa 10 . pdf
1029 -  Danh muc Sach Giao Khoa 10 . pdf1029 -  Danh muc Sach Giao Khoa 10 . pdf
1029 - Danh muc Sach Giao Khoa 10 . pdfQucHHunhnh
 

Recently uploaded (20)

Interactive Powerpoint_How to Master effective communication
Interactive Powerpoint_How to Master effective communicationInteractive Powerpoint_How to Master effective communication
Interactive Powerpoint_How to Master effective communication
 
social pharmacy d-pharm 1st year by Pragati K. Mahajan
social pharmacy d-pharm 1st year by Pragati K. Mahajansocial pharmacy d-pharm 1st year by Pragati K. Mahajan
social pharmacy d-pharm 1st year by Pragati K. Mahajan
 
Student login on Anyboli platform.helpin
Student login on Anyboli platform.helpinStudent login on Anyboli platform.helpin
Student login on Anyboli platform.helpin
 
Grant Readiness 101 TechSoup and Remy Consulting
Grant Readiness 101 TechSoup and Remy ConsultingGrant Readiness 101 TechSoup and Remy Consulting
Grant Readiness 101 TechSoup and Remy Consulting
 
SOCIAL AND HISTORICAL CONTEXT - LFTVD.pptx
SOCIAL AND HISTORICAL CONTEXT - LFTVD.pptxSOCIAL AND HISTORICAL CONTEXT - LFTVD.pptx
SOCIAL AND HISTORICAL CONTEXT - LFTVD.pptx
 
Beyond the EU: DORA and NIS 2 Directive's Global Impact
Beyond the EU: DORA and NIS 2 Directive's Global ImpactBeyond the EU: DORA and NIS 2 Directive's Global Impact
Beyond the EU: DORA and NIS 2 Directive's Global Impact
 
The Most Excellent Way | 1 Corinthians 13
The Most Excellent Way | 1 Corinthians 13The Most Excellent Way | 1 Corinthians 13
The Most Excellent Way | 1 Corinthians 13
 
Measures of Central Tendency: Mean, Median and Mode
Measures of Central Tendency: Mean, Median and ModeMeasures of Central Tendency: Mean, Median and Mode
Measures of Central Tendency: Mean, Median and Mode
 
Nutritional Needs Presentation - HLTH 104
Nutritional Needs Presentation - HLTH 104Nutritional Needs Presentation - HLTH 104
Nutritional Needs Presentation - HLTH 104
 
Paris 2024 Olympic Geographies - an activity
Paris 2024 Olympic Geographies - an activityParis 2024 Olympic Geographies - an activity
Paris 2024 Olympic Geographies - an activity
 
Mattingly "AI & Prompt Design: The Basics of Prompt Design"
Mattingly "AI & Prompt Design: The Basics of Prompt Design"Mattingly "AI & Prompt Design: The Basics of Prompt Design"
Mattingly "AI & Prompt Design: The Basics of Prompt Design"
 
Disha NEET Physics Guide for classes 11 and 12.pdf
Disha NEET Physics Guide for classes 11 and 12.pdfDisha NEET Physics Guide for classes 11 and 12.pdf
Disha NEET Physics Guide for classes 11 and 12.pdf
 
9548086042 for call girls in Indira Nagar with room service
9548086042  for call girls in Indira Nagar  with room service9548086042  for call girls in Indira Nagar  with room service
9548086042 for call girls in Indira Nagar with room service
 
Arihant handbook biology for class 11 .pdf
Arihant handbook biology for class 11 .pdfArihant handbook biology for class 11 .pdf
Arihant handbook biology for class 11 .pdf
 
Separation of Lanthanides/ Lanthanides and Actinides
Separation of Lanthanides/ Lanthanides and ActinidesSeparation of Lanthanides/ Lanthanides and Actinides
Separation of Lanthanides/ Lanthanides and Actinides
 
Organic Name Reactions for the students and aspirants of Chemistry12th.pptx
Organic Name Reactions  for the students and aspirants of Chemistry12th.pptxOrganic Name Reactions  for the students and aspirants of Chemistry12th.pptx
Organic Name Reactions for the students and aspirants of Chemistry12th.pptx
 
BASLIQ CURRENT LOOKBOOK LOOKBOOK(1) (1).pdf
BASLIQ CURRENT LOOKBOOK  LOOKBOOK(1) (1).pdfBASLIQ CURRENT LOOKBOOK  LOOKBOOK(1) (1).pdf
BASLIQ CURRENT LOOKBOOK LOOKBOOK(1) (1).pdf
 
POINT- BIOCHEMISTRY SEM 2 ENZYMES UNIT 5.pptx
POINT- BIOCHEMISTRY SEM 2 ENZYMES UNIT 5.pptxPOINT- BIOCHEMISTRY SEM 2 ENZYMES UNIT 5.pptx
POINT- BIOCHEMISTRY SEM 2 ENZYMES UNIT 5.pptx
 
Advance Mobile Application Development class 07
Advance Mobile Application Development class 07Advance Mobile Application Development class 07
Advance Mobile Application Development class 07
 
1029 - Danh muc Sach Giao Khoa 10 . pdf
1029 -  Danh muc Sach Giao Khoa 10 . pdf1029 -  Danh muc Sach Giao Khoa 10 . pdf
1029 - Danh muc Sach Giao Khoa 10 . pdf
 

The role of energy storage with renewable electricity generation

  • 1. The Role of Energy Technical Report NREL/TP-6A2-47187 Storage with Renewable January 2010 Electricity Generation Paul Denholm, Erik Ela, Brendan Kirby, and Michael Milligan
  • 2. The Role of Energy Storage Technical Report NREL/TP-6A2-47187 with Renewable Electricity January 2010 Generation Paul Denholm, Erik Ela, Brendan Kirby, and Michael Milligan Prepared under Task No. WER8.5005 National Renewable Energy Laboratory 1617 Cole Boulevard, Golden, Colorado 80401-3393 303-275-3000 • www.nrel.gov NREL is a national laboratory of the U.S. Department of Energy Office of Energy Efficiency and Renewable Energy Operated by the Alliance for Sustainable Energy, LLC Contract No. DE-AC36-08-GO28308
  • 3. NOTICE This report was prepared as an account of work sponsored by an agency of the United States government. Neither the United States government nor any agency thereof, nor any of their employees, makes any warranty, express or implied, or assumes any legal liability or responsibility for the accuracy, completeness, or usefulness of any information, apparatus, product, or process disclosed, or represents that its use would not infringe privately owned rights. Reference herein to any specific commercial product, process, or service by trade name, trademark, manufacturer, or otherwise does not necessarily constitute or imply its endorsement, recommendation, or favoring by the United States government or any agency thereof. The views and opinions of authors expressed herein do not necessarily state or reflect those of the United States government or any agency thereof. Available electronically at http://www.osti.gov/bridge Available for a processing fee to U.S. Department of Energy and its contractors, in paper, from: U.S. Department of Energy Office of Scientific and Technical Information P.O. Box 62 Oak Ridge, TN 37831-0062 phone: 865.576.8401 fax: 865.576.5728 email: mailto:reports@adonis.osti.gov Available for sale to the public, in paper, from: U.S. Department of Commerce National Technical Information Service 5285 Port Royal Road Springfield, VA 22161 phone: 800.553.6847 fax: 703.605.6900 email: orders@ntis.fedworld.gov online ordering: http://www.ntis.gov/ordering.htm Printed on paper containing at least 50% wastepaper, including 20% postconsumer waste
  • 4. Acknowledgments The authors wish to thank the following people for their review and other contributions: Doug Arent, Easan Drury, Vahan Gevorgian, Michelle Kubik, Jim Leyshon, Sean Ong, and Brian Parsons of the National Renewable Energy Laboratory (NREL); Jonah Levine of the University of Colorado; Mark O’Malley of the Electricity Research Center, University College Dublin; and Samir Succar of the Natural Resources Defense Council. iii
  • 5. List of Acronyms AC alternate current AGC automatic generation control AS ancillary services CAES compressed-air energy storage CCGT combined-cycle gas turbine CCR capital charge rate CSP concentrating solar power DC direct current ERCOT Electric Reliability Council of Texas EVs electric vehicles GW gigawatt ISO independent system operators LaaR Load Acting as a Resource (program) MW megawatt NERC North American Electric Reliability Corporation PHS pumped hydro storage PV photovoltaics RTO regional transmission organization RE renewable energy SMES superconducting magnetic energy storage T&D transmission and distribution V2G vehicle to grid VG variable generation iv
  • 6. Table of Contents 1 Introduction ..................................................................................................................................1 2 Operation of the Electric Grid ....................................................................................................2 3 Electricity Storage in the Existing Grid ..................................................................................... 6 3.1 Development of Energy Storage in Regulated Markets ....................................6 3.2 The Economics of Energy Storage in Restructured Markets .............................8 3.3 Other Applications of Energy Storage .............................................................12 3.4 Summary of Energy Storage Applications in the Current Grid .......................13 4 Impacts of Renewables on the Grid and the Role of Enabling Technologies ..................... 17 4.1 Costs of Wind and Solar Integration from Previous Studies ...........................19 4.2 Limiting Factors for Integration of Wind and Solar Energy............................23 5 Storage and Flexibility Options for Renewables-Driven Grid Applications ........................ 34 5.1 The Flexibility Supply Curve...........................................................................34 5.2 Deployment and Operational Balancing of Renewable Energy – Individual Plant Storage vs. Power System Storage ...............................................................36 5.3 Energy Storage Technologies and Applications ..............................................38 5.4 Electric Vehicles and the Role of Vehicle to Grid ...........................................44 6 Conclusions ............................................................................................................................... 46 Bibliography ..................................................................................................................................47 References ....................................................................................................................................48 v
  • 7. List of Tables Table 3.1. Historical Values of Energy Storage in Restructured Electricity Markets .......10 Table 3.2. Traditional Major Grid Applications of Energy Storage ..................................14 Table 4.1. Summary of Recent Wind Integration Cost Studies .........................................20 Table 5.1. Dedicated Renewable Applications of Energy Storage and Their Whole-Grid Counterpart ........................................................................................................................37 Table 5.2. Three Classes of Energy Storage .....................................................................38 List of Figures Figure 2.1. Hourly loads from ERCOT 2005 ......................................................................2 Figure 2.2. System load following and regulation ...............................................................3 Figure 2.3. Optimal and reserve constrained dispatch .........................................................5 Figure 3.1. Historical fuel costs for intermediate load power plants ...................................7 Figure 3.2. Relationship between the annual benefit of storage and capital cost using different capital charge rates ..............................................................................................11 Figure 4.1. Impact of net load from increased use of renewable energy ...........................18 Figure 4.2. Dispatch with low VG penetration ..................................................................24 Figure 4.3. Dispatch with higher VG penetration ..............................................................25 Figure 4.4. Relationship between price and load in PJM in 2002 .....................................27 Figure 4.5. Contribution from inflexible generation ..........................................................28 Figure 4.6. Effect of decreasing minimum load point on increased use of RE .................29 Figure 4.7. Average curtailment rate as a function of VG penetration for different flexibilities in ERCOT .......................................................................................................30 Figure 4.8. Marginal curtailment rate as a function of VG penetration for different system flexibilities in ERCOT .......................................................................................................30 Figure 4.9. Relative cost of VG as a function of VG penetration for different system flexibilities in ERCOT .......................................................................................................31 Figure 4.10. Option for increasing the use of VG by decreasing curtailment ...................32 Figure 4.11. Reduction of curtailment resulting from addition of energy storage ............33 Figure 5.1. Flexibility supply curve ...................................................................................34 Figure 5.2. Energy storage applications and technologies .................................................39 vi
  • 8. 1 Introduction Renewable energy sources, such as wind and solar, have vast potential to reduce dependence on fossil fuels and greenhouse gas emissions in the electric sector. Climate change concerns, state initiatives including renewable portfolio standards, and consumer efforts are resulting in increased deployments of both technologies. Both solar photovoltaics (PV) and wind energy have variable and uncertain (sometimes referred to as “intermittent”) 1 output, which are unlike the dispatchable sources used for the majority of electricity generation in the United States. The variability of these sources has led to concerns regarding the reliability of an electric grid that derives a large fraction of its energy from these sources as well as the cost of reliably integrating large amounts of variable generation into the electric grid. Because the wind doesn’t always blow and the sun doesn’t always shine at any given location, there has been an increased call for the deployment of energy storage as an essential component of future energy systems that use large amounts of variable renewable resources. However, this often-characterized “need” for energy storage to enable renewable integration is actually an economic question. The answer requires comparing the options to maintain the required system reliability, which include a number of technologies and changes in operational practices. The amount of storage or any other “enabling” technology used will depend on the costs and benefits of each technology relative to the other available options. To determine the potential role of storage in the grid of the future, it is important to examine the technical and economic impacts of variable renewable energy sources. It is also important to examine the economics of a variety of potentially competing technologies including demand response, transmission, flexible generation, and improved operational practices. In addition, while there are clear benefits of using energy storage to enable greater penetration of wind and solar, it is important to consider the potential role of energy storage in relation to the needs of the electric power system as a whole. In this report, we explore the role of energy storage in the electricity grid, focusing on the effects of large-scale deployment of variable renewable sources (primarily wind and solar energy). We begin by discussing the existing grid and the current role that energy storage has in meeting the constantly varying demand for electricity, as well as the need for operating reserves to achieve reliable service. The impact of variable renewables on the grid is then discussed, including how these energy sources will require a variety of enabling techniques and technologies to reach their full potential. Finally, we evaluate the potential role of several forms of enabling technologies, including energy storage. 1 The use of the term “intermittent” has been questioned by the wind energy community as being technically inaccurate. Intermittent implies a short-term “on-off” cycle while the output of wind experiences maximum variations more typically on the order of 10% per hour. Solar PV is perhaps somewhat more “intermittent” because it follows a daily on-off cycle. The description “variable” or “variable and uncertain” has been proposed as a more technically accurate description of the output of a wind power plant (Smith and Parsons 2007). 1
  • 9. 2 Operation of the Electric Grid The operation of electric power systems involves a complex process of forecasting the demand for electricity, and scheduling and operating a large number of power plants to meet that varying demand. The instantaneous supply of electricity must always meet the constantly changing demand, as indicated in Figure 2.1. It shows the electricity demand patterns for three weeks for the Electric Reliability Council of Texas (ERCOT) grid during 2005. 2 The seasonal and daily patterns are driven by factors such as the need for heating, cooling, lighting, etc. While the demand patterns in Figure 2.1 are for a specific region of the United States, many of the general trends shown in the demand patterns are common throughout the country. To meet this demand, utilities build and operate a variety of power plant types. Baseload plants are used to meet the large constant demand for electricity. In the United States, these are often nuclear and coal-fired plants, and utilities try to run these plants at full output as much as possible. While these plants (especially coal) can vary output, their high capital costs, and low variable costs (largely fuel), encourage continuous operation. Furthermore, technical constraints (especially in nuclear plants) restrict rapid change in output needed to follow load. Variation in load is typically met with load-following or “cycling” plants. These units are typically hydroelectric generators or plants fueled with natural gas or oil. These “load-following” units are further categorized as intermediate load plants, which are used to meet most of the day-to-day variable demand; and peaking units, which meet the peak demand and often run less than a few hundred hours per year. 1.0 60000 0.9 Load (Fraction of Annual Peak) 0.8 50000 0.7 Load (MW) 40000 0.6 0.5 30000 0.4 20000 0.3 Summer Maximum Winter Spring Minimum 0.2 10000 0.1 0 0.0 0 24 48 72 96 120 144 168 Hour Figure 2.1. Hourly loads from ERCOT 2005 2 Most of Texas (about 85% of the population) is within the ERCOT grid, which is largely independent of the two larger U.S. grids. 2
  • 10. In addition to meeting the predictable daily, weekly, and seasonal variation in demand, utilities must keep additional plants available to meet unforeseen increases in demand, losses of conventional plants and transmission lines, and other contingencies. This class of responsive reserves is often referred to as operating reserves and includes meeting frequency regulation (the ability to respond to small, random fluctuations around normal load), load-forecasting errors (the ability to respond to a greater or less than predicted change in demand), and contingencies (the ability to respond to a major contingency such as an unscheduled power plant or transmission line outage) (NERC 2008). 3 Both frequency regulation and contingency reserves are among a larger class of services often referred to as ancillary services, which require units that can rapidly change output. Figure 2.2 illustrates the need for rapidly responding frequency regulation (red) in addition to the longer term ramping requirements (blue). In this utility system, the morning load increases smoothly by about 400 megawatts (MW) in two hours. During this period, however, there are rapid short-term ramps of +/- 50 (MW) within a few minutes. Figure 2.2. System load following and regulation. Regulation (red) is the fast fluctuating component of total load (green) while load following (blue) is the slower trend (Kirby 2004) Because of the rapid response needed by both regulation and contingency reserves, a large fraction of these reserves are provided by plants that are online and “spinning” (as a result, operating reserves met by spinning units are sometimes referred to as spinning reserves.) 4 Spinning reserves are provided by a mix of partially loaded power plants or responsive loads. The need for reserves increases the costs and decreases the efficiency of 3 Operating reserves are primarily capacity services (the ability to provide energy on demand) as opposed to actual energy services. 4 The nomenclature around various ancillary services (especially spinning reserves) varies significantly. While the NERC glossary indicates that spinning reserve applies to both contingency and frequency regulation, the term spinning reserve often is used to refer to only contingency reserves. For additional discussion of nomenclature around contingency and spinning reserves, see Rebours and Kirschen 2005. 3
  • 11. an electric power system compared to a system that is perfectly predictable and does not experience unforeseen contingencies. These costs result from several factors. First, the need for fast-responding units results in uneconomic dispatch – because plants providing spinning reserve must be operated at part load, they potentially displace more economic units. 5 (Flexible load-following units are often either less efficient or burn more expensive fuel than “baseload” coal or nuclear units.) Second, partial loading can reduce the efficiency of individual power plants. Finally, the reserve requirements increase the number of plants that are online at any time, which increases the capital and O&M costs. Figure 2.3 provides a simplified illustration of the change in dispatch (and possible cost impacts) needed to provide operating reserves. The figure on the left shows an “ideal” dispatch of a small electric power system. Two baseload units provide most of the energy, while an intermediate load and two peaking units provide load following. In the “ideal” dispatch, it is possible that the intermediate load unit cannot rapidly increase output to provide operating reserves. Furthermore, during the transition periods when the load-following units are nearing their full output – but before additional units are turned on – there may be insufficient capacity left in the load-following units to provide necessary operating capacity for regulation or contingencies. A dispatch that provides the necessary reserves is provided on the right. In this case, lower-cost units reduce output to accommodate the more flexible units providing reserves. This increases the overall cost of operating the entire system. 5 This “opportunity cost” associated with uneconomic dispatch is the dominant source of reserve costs (Kirby 2004). 4
  • 12. 3000 2500 Insufficient Peak 2 2000 Reserve Load (MW) Peak 1 Capacity 1500 Int Base2 1000 Higher Cost Unit Started Insufficient Base 1 Early To Provide Reserve 500 Flexibility to Capacity Provide Reserves 0 3000 0 4 8 12 16 20 24 Hour 2500 “Ideal” Dispatch 2000 Load (MW) 1500 1000 Lower Cost Unit Backed Off 500 To Accommodate Higher Cost Flexible Generator 0 0 4 8 12 16 20 24 Reserve Constrained Hour Dispatch Figure 2.3. Optimal and reserve constrained dispatch The need for operating reserves and the large variation in demand restricts the contribution from low-cost baseload units and increases the need for units that can vary output to provide both load-following and ancillary services. As a consequence, utility operators have long pursued energy storage as one potential method of better utilizing baseload plants and providing an alternative to lower efficiency thermal generators for meeting variations in demand. 5
  • 13. 3 Electricity Storage in the Existing Grid The challenges associated with meeting the variation in demand while providing reliable services has motivated historical development of energy storage. While a number of pumped hydro storage (PHS) plants 6 were built in the United States before 1970, significant interest, research, and funding for new storage technologies began in the early 1970s, associated with dramatic increases in oil prices. This period also saw the largest deployment of PHS based on its competitive economics compared to alternative sources of intermediate load and peaking energy. 3.1 Development of Energy Storage in Regulated Markets Deployment of energy storage is dependent on the economic merits of storage technologies compared to the more conventional alternatives used to follow load. Before the advent of low-cost, efficient gas turbines now typically used to follow load and provide reserves, utilities often relied on oil- and gas-fired steam turbines (and hydroelectric dams where available). In the 1970s, dramatic price increases in oil and natural gas occurred, along with concerns about security of supply. This led to the Powerplant and Industrial Fuel Use Act, restricting use of oil and gas in new power plants (EIA 2009b). Utilities expected to bring online many new coal and nuclear plants to meet baseload demand, but were left with limited options to provide load-following and peaking services. 7 This led utilities to actively evaluate pumped hydro (along with other storage technologies) as alternatives to fossil-fueled intermediate load and peaking units. The economic analysis and justification of new energy storage facilities during this period was based on a direct comparison of the energy and capacity provided by energy storage to an equivalently sized fossil plant, (choosing the lower net-cost option) which largely ignored any additional operational benefits energy storage can provide. 8 Figure 3.1 provides a simple framework of comparing these technologies over time. In the figure, the variable (fuel-related) costs are shown for a storage device and fossil- fueled alternatives. In this figure, the storage technology is assumed to be fueled with off- peak coal and has an effective round-trip efficiency of 75%. 9 6 PHS stores energy by pumping water from a lower reservoir to an upper reservoir and releasing that stored water through a conventional hydroelectric generator. Additional information about PHS is provided in Section 5. 7 Concerns about the availability of oil and other peaking fuels in this period was so great that an international conference (including the U.S. National Academy of Sciences) on the subject in 1979 described energy storage as “a vital element in mankind’s quest for survival and progress” (Silverman 1980). 8 See, for example, EPRI 1976. Here, the proposed method for comparing energy storage to conventional alternatives is based solely on the value of energy and firm capacity value without any actual quantification of operational benefits. 9 This would be a typical assumption for a pumped hydro plant built during the 1970s and 1980s (EPRI 1976). 6
  • 14. 14.0 Gas Steam Oil Steam 12.0 Gas CCGT Storage (Coal Charging) 10.0 Fuel Cost (2008 Cents/kWh) 8.0 6.0 4.0 2.0 0.0 1976 1977 1978 1979 1980 1981 1982 1983 1984 1985 1986 1987 1988 1989 1990 1991 1992 1993 1994 1995 1996 1997 1998 1999 2000 2001 2002 2003 2004 2005 2006 2007 2008 Year Figure 3.1. Historical fuel costs for intermediate load power plants 10 Figure 3.1 shows that the variable cost of providing energy from a storage device was much lower than alternatives available in the mid-1970s and early 1980s. While Figure 3.1 provides the fuel costs, the total economics of storage must also consider the fixed costs. During the mid- to late 1970s, gas-fired combined cycle plants were not significantly less expensive than pumped hydro, with cost estimates of $110-$280/kW for a 10-hour PHS device and $175-275/kW for a combined-cycle generator (EPRI 1976). As a result, pumped hydro appeared more economic than alternative generation sources during this time period, even without considering additional operation benefits. It was expected that oil and gas prices would remain high, and that off-peak energy would be widely available (and even less expensive) due to anticipated large-scale deployment of nuclear power plants. During the mid- to late 1970s, much of the nation’s 20 GW of pumped hydro storage was initiated (ASCE 1993), along with significant research and development in a variety of other storage technologies including several battery types, capacitors, flywheels, and superconducting magnetic storage (DOE 1977). Growth projections for energy storage during this period included significant increases of several types (Boyd et al. 1983). However, most PHS development, along with interest in and deployment of other 10 This figure is intended to represent general trends as opposed to absolute costs. In this figure, fuel prices and generation characteristics are derived from various data sets from the Energy Information Administration. 7
  • 15. emerging storage technologies, ended in the 1980s after dramatic reduction in the price of natural gas, increased efficiency and reduced costs of flexible combined-cycle and simple-cycle natural gas turbines, and repeal of the Fuel Use Act in 1987. While estimates from the 1970s place combined-cycle gas turbine (CCGT) units and PHS at similar costs, by the early 2000s, PHS was estimated to be about twice the cost of a CCGT. As a result, even with the increased cost of gas, this dramatic increase in PHS cost (along with the many other factors discussed previously) limited the economic competitiveness of PHS vs. gas-fired generators. 11 Furthermore, while coal prices continued to drop, the limited nuclear build-out eliminated a source of low-cost off-peak electricity. Finally, the simplistic treatment of the economic benefits of energy storage technologies was also a limiting factor. One of the main benefits of energy storage is its ability to provide multiple services, including load leveling (and associated benefits such as a reduction in cycling-induced maintenance) along with regulation and contingency reserves and firm capacity. 12 However, it has always been somewhat difficult to quantify these various value streams without fairly sophisticated modeling and simulation methods, (especially before the advent of energy and ancillary service markets, which will be discussed in the next section). Because the economic analysis is difficult, and benefits of storage are often uncertain, utilities tend to rely on more traditional generation assets, especially in regulated utilities where risk is minimized and new technologies are adopted relatively slowly. 13 Combined, these factors have restricted deployment of utility-scale energy storage in the United States. Besides PHS, deployment has been limited to a single 110 MW compressed-air energy storage (CAES) facility, and a variety of small projects. 14 A more comprehensive discussion of energy storage technologies and their status is provided in Section 5. 3.2 The Economics of Energy Storage in Restructured Markets Despite the lack of significant new construction, interest in energy storage never completely disappeared during the period of low-cost peaking fuels. Research and development has continued, along with an increasing number of proposed projects. 11 PHS also takes longer to build (increasing the risk for investors), requires additional permits, and is typically located farther from load centers, which requires more transmission than gas-fired generators. PHS may also face greater environmental opposition (Strauss 1991). 12 This problem has been noted many times. For example, “traditionally, when electric utilities evaluate generating additions to their facilities, the evaluation process considers the contribution of each alternative to both capacity and energy requirements. However, the evaluation process often neglects or inaccurately measure potential costs and benefits not directly related to capacity and energy. Operating considerations that reflect the ability (or inability) of a generation resource to respond to the electric system’s dynamic operating needs usually fall into this category.” (Jabbour and Wells 1992). 13 Private investors tend to favor lower capital cost investments with faster construction times (i.e., combustion turbines and combined-cycle plants), even if they have higher operating costs, because this reduces perceived economic risk. 14 To place these values in perspective, between 1993 and 2008, more than 320 GW of conventional capacity was constructed in the United States. With the exception of the completion of previously started PHS facilities and a few demonstration projects, no significant storage capacity was added. The total U.S. utility storage capacity of about 20 GW in 2008 is less than 2% of the total installed generation capacity (EIA 2009a). 8
  • 16. Recent renewed interest in energy storage has been motivated by at least five factors: advances in storage technologies, an increase in fossil fuel prices, the development of deregulated energy markets including markets for high-value ancillary services, challenges to siting new transmission and distribution facilities, and the perceived need and opportunities for storage with variable renewable generators. Emergence of wholesale electricity markets along with increased volatility in natural gas prices has created new opportunities and interest in energy storage. As shown in Figure 3.1, rising natural gas prices in the early 2000s increased the cost-competitiveness of energy storage. However, perhaps the single greatest motivation for proposals to build new energy storage is the creation of markets for both energy and ancillary services including regulation, contingency reserves, and capacity. As of 2009, wholesale energy markets exist in parts of more than 30 states and cover about two-thirds of the U.S. population (IRC 2009). The markets provide real, transparent data for both utilities and independent power producers to consider the opportunities for energy storage. Market data allows evaluation of both the economic yield and optimum location of energy storage devices for arbitrage – the ability to purchase low-cost off-peak energy and re-sell this energy during on-peak periods. Furthermore, the benefits of providing operating reserves and other ancillary services from energy storage can now be evaluated. Previously, the value of these services was largely “hidden” in utilities’ cost of service, and the cost of providing operating reserves, for example, was rarely calculated. The high value of these services is now recognized, and the advantages of energy storage in providing these services is evident, especially because these services generally require fast response and limited actual energy delivery, two qualities that are well-suited to many energy storage devices. Historical market data can be used to evaluate the potential profitability of energy storage devices that provide various services. Table 3.1 provides the results of several studies of U.S. electricity markets. 9
  • 17. Table 3.1. Historical Values of Energy Storage in Restructured Electricity Markets Market Location Years Annual Assumptions Evaluated Evaluated Value ($/kW) Energy PJMa 2002- $60-$115 12 hour, 80% efficient device. Range of Arbitrage 2007 efficiencies and sizes evaluated 15 NYISOb 2001- $87-$240 10 hour, 83% efficient device. Range of 2005 (NYC) efficiencies and sizes evaluated. $29-$84 (rest) USAc 1997- $37-$45 80% efficient device, Covers NE, No Cal, 2001 PJM CAd 2003 $49 10 hour, 90% efficient device. Regulation NYISOb 2001- $163-248 2005 USAe 2003- $236-$429 PJM, NYISO, ERCOT, ISONE 2006 Contingency USAe 2004- $66-$149 PJM, NYISO, ERCOT, ISONE Reserves 2005 a Sioshansi et al. 2009 b Walawalkar et al. 2007 c Figueiredo et al. 2006 d Eyer et al. 2004 e Denholm and Letendre 2007 The values in Table 3.1 can be translated into a maximum capital cost for the applicable storage technology (equal to the maximum cost of a storage device that can be supported by the revenues available). Figure 3.2 provides a generic conversion between annual costs and total capital costs. This conversion is performed by dividing the annual revenues by the capital charge rate, which produces a total capital cost. 16 The capital charge rate (also referred to as a fixed-charge rate or capital recovery factor) refers to the fraction of the total capital cost that is paid each year to finance the plant. It should be noted that this cost does not include any operation and maintenance costs. 17 15 This study analyzed devices up to 40 hours, and found rapidly diminishing returns for devices with storage capacity greater than about 10 hours. The majority of arbitrage benefits are within a day, as opposed to over larger time periods. In addition, while short-term price variation is highly predictable, long-term variations are less predictable, which reduces the certainty of long-term arbitrage opportunities. 16 This is the inverse of the process of calculating an annualized cost from a capital cost by multiplying by the capital charge rate. 17 These values also assume that frequency regulation is an energy- and cost-neutral service. 10
  • 18. 4000 Capital Charge Rate 3500 Required Storage Capital Cost ($/kW) 9.8% 3000 12.0% 13.9% 2500 2000 1500 Arbitrage Only Regulation Only 1000 500 Contingency Only 0 0 50 100 150 200 250 300 350 Annual Benefit of Storage ($/kW) Figure 3.2. Relationship between the annual benefit of storage and capital cost using different capital charge rates 18 Figure 3.2 shows the range of values and corresponding capital costs for three types of operation: energy arbitrage, contingency reserves, and frequency regulation. In general, energy arbitrage provides the least value. Outside of New York City, the maximum annual value in Table 3.1 for arbitrage was $115/kW (for a 20-hour device), which would translate into a capital cost of $827-1,170/kW – this is below current estimates for most energy storage technologies. While there is significant uncertainty in costs, most energy storage assessments indicate that few commercially available bulk energy storage technologies are deployable for less than $1,000/kW. 19 This reveals the same challenging economics as comparing a storage device to a conventional generator as discussed in Section 3-1. The value of energy arbitrage alone does not appear to justify the deployment of energy storage at current technology costs and electricity prices. The value of energy storage increases when taking advantage of other individual sources of revenue or even combined services. A device with sufficient energy capacity for energy arbitrage would likely be able to receive capacity payments in locations where 18 Capital charge rate (CCR) of 9.8% from EPRI 2003, CCR of 12% from Butler et al. 2003, CCR of 13.9% from Eyer et al. 2004. 19 CAES is one possible exception, but requires analysis of both the electricity price and natural gas prices. See Section 5 and the references in the Bibliography for additional discussion of storage costs. 11
  • 19. capacity markets now exist; recent data in the PJM market indicates an additional potential value of $40-90/kW-year. 20 Alternatively, contingency reserves offer a higher value 21 than energy arbitrage and also require less energy capacity. Obtaining the values for energy arbitrage in Table 3.1 generally requires a device with at least 10 hours of storage capacity; contingency reserves can require as little as 30 minutes, depending on the market and market reliability rules (PJM 2009b). The challenge for a device providing contingency reserves is that the device must be able to respond rapidly, typically in a few minutes or less. Frequency regulation is even more demanding, requiring continuous changes in output, frequent cycling, and fast response. It is also the highest-value opportunity for an energy storage device, and has been the focus of many potential energy storage applications, especially given its fairly small energy requirements. 22 3.3 Other Applications of Energy Storage In addition to energy arbitrage and operating reserves, there are several other services that energy storage has provided or could provide in the current grid. Several of these applications are discussed below. Transmission and Distribution In addition to generation, storage can act as an alternative or supplement to new transmission and distribution (T&D). Distribution systems must be sized for peak demand; as demand grows, new systems (both lines and substations) must be installed, often only to meet the peak demand for a few hours per year. New distribution lines may be difficult or expensive to build, and can be avoided or deferred by deploying distributed storage located near the load (Nourai 2007). (Energy can be stored during off-peak periods when the distribution system is lightly loaded, and discharged during peak periods when the system may otherwise be overloaded.) Energy storage can also reduce the high line-loss rates that occur during peak demand (Nourai et al. 2008). 20 PJM’s capacity market (Reliability Pricing Model) data derived from http://www.pjm.com/markets-and- operations/rpm.aspx. 21 More recent data shows a greater range of value for contingency reserves. For example, in 2008, the average value for spinning reserves in NYISO was $10.1 in the east and $6.2 in the west, corresponding to as little as $54/kW-yr. In the same year, the average price in ERCOT was $27.1, corresponding to $237/kW-yr. In 2009, these values fell substantially to $36/kW-yr in NYISO west, and $87/kW-yr in ERCOT. 22 Frequency regulation theoretically is a net zero energy service over relatively short time scales, meaning the energy capacity of the device can be much smaller than those providing operating reserves and energy arbitrage. Several markets in the United States have changed or have proposed to change their treatment of regulation to accommodate energy-limited storage technologies. Furthermore, it has been suggested that fast-responding storage devices could receive a greater value per unit of capacity actually bid, because they could actually reduce the amount of reserves needed. For example, “faster responsive resources can help to reduce California ISO’s regulation procurement by up to 40% (on average)” and “California ISO may consider creating better market opportunities and incentives for fast responsive resources.” (Makarov et al. 2008). 12
  • 20. Black-Start Black-start provides capacity and energy after a system failure. A black-start unit provides energy to help other units restart and provide a reference frequency for synchronization. Pumped hydro units have been used for this application. 23 Power Quality and Stability Energy storage can be used to assist in a general class of services referred to as power quality and stability. Power quality refers to voltage spikes, sags, momentary outages, and harmonics. Storage devices are often used at customer load sites to buffer sensitive equipment against power quality issues. Electric power systems can also experience oscillations of frequency and voltage. Unless damped, these disturbances can limit the ability of utilities to transmit power and affect the stability and reliability of the entire system. System stability requires response times of less than a second, and can be met by a variety of devices including fast-responding energy storage. End-Use/Remote Applications Other applications for energy storage are at the end use. Storage can provide firm power for off-grid homes, but also can provide value when grid-tied through management of time-of-use rates, or demand charges in large commercial and industrial buildings. Energy storage also provides emergency and backup power for increased reliability. In many cases, end-use applications have analogous applications in the grid as a whole (and potentially compete with these applications). For example, using energy storage to time- shift end use is functionally equivalent to energy arbitrage, and a flatter load on the demand side reduces the potential need for load-leveling in central storage applications (and vice-versa). To be economic, end-use applications require time-varying prices and are extremely site-specific. 3.4 Summary of Energy Storage Applications in the Current Grid Table 3.2 provides a summary of the various applications of energy storage commonly discussed in the literature. Each of these applications provides a potential value to a merchant storage operator in a restructured market or a source of cost reduction to the system. 23 Large PHS units or other black-start generators must themselves be “black-started” and may use batteries or small generators for this purpose. Many transmission substations also use batteries partly to maintain reliability during power failures. 13
  • 21. Table 3.2. Traditional Major Grid Applications of Energy Storage Application Description System Benefits when Provided by Timescale of Operation Storage Load Leveling/ Purchasing low-cost off-peak energy Increases utilization of baseload power Response in minutes to hours. Arbitrage and selling it during periods of high plants and decrease use of peaking Discharge time of hours. prices. plants. Can lower system fuel costs, and potentially reduce emissions if peaking units have low efficiency. Firm Capacity Provide reliable capacity to meet Replace (or function as) peaking Must be able to discharge continuously peak system demand. generators. for several hours or more. Operating Reserves Regulation Fast responding increase or Reduces use of partially loaded thermal Unit must be able to respond in decrease in generation (or load) to generators, potentially reducing both fuel seconds to minutes. Discharge time is respond to random, unpredictable use and emissions. typically minutes. Service is variations in demand. theoretically “net zero” energy over extended time periods. Contingency Fast response increase in generation Same as regulation. Unit must begin responding immediately Spinning (or decrease load) to respond to a and be fully responsive within 10 24 Reserve contingency such as a generator minutes. Must be able to hold output for failure. 30 minutes to 2 hours depending on the 25 market. Service is infrequently called. Replacement/ Units brought on-line to replace Limited. Replacement reserve is typically Typical response time requirement of Supplemental spinning units. a low-value service. 30-60 minutes depending on market minutes. Discharge time may be several hours. 24 Contingency reserves may be provided by both spinning and non-spinning units, depending on the market. The requirements for non-spinning reserves are the same except the resource does not need to “begin responding immediately.” Full response is still within 10 minutes. 25 For example, in the PJM regional transmission organization (RTO) in 2008 (covering about 50 million people), synchronized reserves were called a total of 40 times with an average duration of 10 minutes. See http://www.pjm.com/markets-and-operations/ancillary-services.aspx 14
  • 22. Ramping/Load Follow longer term (hourly) changes Reduces use of partially loaded thermal Response time in minutes to hours. Following in electricity demand. generators, potentially reducing both fuel Discharge time may be minutes to use and emissions. Price is “embedded” hours. in existing energy markets, but not explicitly valued, so somewhat difficult to capture. T&D Reduce loading on T&D system Provides an alternative to expensive and Response in minutes to hours. Replacement during peak times. potentially difficult to site transmission Discharge time of hours. and Deferral and distribution lines and substations. Distribution deferral is not captured in existing markets. Black-Start Units brought online to start system Limited. May replace conventional Response time requirement is several after a system-wide failure (blackout). generators such as combustion turbines minutes to over an hour. Discharge time or diesel generators. requirement may be several to many hours. 26 End-Use Applications TOU Rates Functionally the same as arbitrage, Same as arbitrage. Same as arbitrage. just at the customer site. Demand Functionally the same as firm Same as firm capacity. Same as firm capacity. Charge capacity, just at the customer site. Reduction Functionally the same as contingency Benefits are primarily to the customer. Instantaneous response. Discharge Backup Power/ reserve, just at the customer site. time depends on level of reliability UPS/Power needed by customer. Quality 26 The black-start performance standard in PJM is 90 minutes to start, with an ability to run for 16 hours (PJM 2009a). 15
  • 23. It should be noted that Table 3.2 does not include any dedicated renewables applications. Historical motivations for energy storage deployment were based on the challenges of meeting variations in demand using conventional thermal generators. Much of the current attention for energy storage is based on its potential application with renewable energy (primarily solar and wind). Energy storage is seen as a means to “firm” or “shape” the output from variable renewable generators. However, the actual need for storage to perform these roles has yet to be quantified. In addition, it is unclear whether the electric power industry must create entirely new “classes” of energy and capacity services to deal with the increased uncertainty and variability created by large-scale deployment of variable renewables. Determining the role of energy storage with renewables first requires examining the impacts of variable generators on the grid and how these impacts may require the use of various enabling technologies. 16
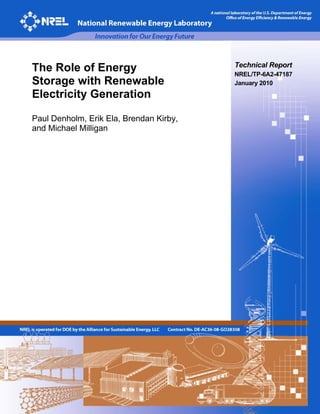
  • 24. 4 Impacts of Renewables on the Grid and the Role of Enabling Technologies The introduction of variable renewables is now one of the primary drivers behind renewed interest in energy storage. A common claim is that renewables such as wind and solar are intermittent and unreliable, and require backup and firming to be useful in a utility system – energy produced by wind and solar should be “smoothed” or shifted to times when the wind is not blowing or the sun is not shining using energy storage. These statements are generally qualitative in nature and provide little insight into the actual role of renewables in the grid, (including their costs and benefits) or the potential use of energy storage or other enabling technologies. To evaluate the actual role of energy storage in a grid with large amounts of variable renewable generation, we must first return to our previous discussion of the variability of electric demand, and how the conventional generators currently meet this demand. As discussed in Section 2, tremendous variation in daily demand is met by the constant up- and-down cycling of generators. In addition to this daily cycling, frequency regulation and contingency reserves are provided by partly loaded generators and responsive load. 27 Most of these “flexible” generators are hydro units, combustion turbines, some combined-cycle plants, and even large thermal generators, as well as the existing PHS. Variable generation (VG) 28 will change how the existing power plant mix is operated, because its output is unlike conventional dispatchable generators. It is easiest to understand the impact of VG technologies on the grid by considering them as a source of demand reduction with unique temporal characteristics. Instead of considering wind or PV as a source of generation, they can be considered a reduction in load with conventional generators meeting the “residual load” of normal demand minus the electricity produced by renewable generators. Figure 4.1 illustrates this framework for understanding the impacts of variable renewables. In this figure, renewable generation is subtracted from the normal load, showing the “residual” or net load that the utility would need to meet with conventional sources. 29 The benefits to the utility include reduced fuel use (and associated emissions) 30 and a somewhat reduced need for overall system capacity (this is relatively small for wind but can be significant for solar given its coincidence with load.) 31 There are also four significant impacts that change how the system must be operated and affect costs. 27 In some locations such as Texas, demand response typically provides half of the contingency reserve requirements. Other regions also use (or are evaluating) load to provide regulation. 28 From this point on, variable renewable generators will be referred to as variable generation (VG) following NERC 2009. 29 This figure uses ERCOT load data from 2005 along with 15 GW of spatially diverse simulated wind data from the same year. See Section 4.2 for more details about the data used. 30 A reduction in demand from VG or load will reduce the total marginal cost of generation, which includes fuel, emissions costs, and variable O&M. This ignores any additional cost impacts of variability on the remaining generation fleet, which is discussed in the next section. 31 There are a number of other benefits provided by renewable energy sources such as reduced volatility of fuel prices. This work is not intended to be an analysis of the total benefits of renewables or VG. 17
  • 25. First is the increased need for frequency regulation, because wind can increase the short- term variability of the net load (not illustrated on the chart). 32 Second is the increase in the ramping rate, or the speed at which load-following units must increase and decrease output. The third impact is the uncertainty in the wind resource and resulting net load. 33 The final impact is the increase in overall ramping range – the difference between the daily minimum and maximum demand – and the associated reduction in minimum load, which can force baseload generators to reduce output; and in extreme cases, force the units to cycle off during periods of high wind output. Together, the increased variability of the net load requires a greater amount of flexibility and operating reserves in the system, with more ramping capability to meet both the predicted and unpredicted variability. The use of these variable and uncertain resources will require changes in the operation of the remaining system, and this will incur additional costs, typically referred to as integration costs. Ramp Range (Increases in 50000 this two-week period from Load Wind Net Load 19.3 GW/day to 26.2 45000 GW/day) 40000 35000 30000 MW 25000 20000 15000 10000 5000 0 1-Apr 8-Apr 15-Apr Uncertainty in wind output Variation in wind output increases net increases uncertainty in net load ramp ate (Increases in this period load to be met with from 4,052 MW/hour to 4,560 MW/hour) conventional generators Figure 4.1. Impact of net load from increased use of renewable energy 32 As discussed later, the impact of short-term wind variability is often overstated, especially considering the benefits of spatial diversity. The impact on minute-to-minute regulation requirements is mitigated by aggregating large amounts of wind because individual wind plant variability is uncorrelated in the regulation time frame. Furthermore, the limited ability to forecast wind and use of persistence forecasts may be a major factor in increased short-term variability of the net load. Finally, newer wind turbines meeting “low-voltage ride-through” standards can add short-duration stability, and have the capability to provide frequency regulation to the grid. 33 This is actually the combination of the uncertainty in load and the uncertainty in wind. As VG penetration increases, it begins to dominate the net load uncertainty. 18
  • 26. 4.1 Costs of Wind and Solar Integration from Previous Studies Concerns about grid reliability and the cost impacts of wind have driven a large number of wind integration studies. These studies use utility simulation tools 34 and statistical analysis to model systems with and without wind and calculate the integration costs of wind. The basic methodology behind these studies is to compare a base case without wind to a case with wind, evaluating technical impacts and costs. The studies calculate the additional costs of adding operating reserves as well as the other system changes needed to reliably address the increased uncertainty and variability associated with wind generation. Table 4.1 provides examples of several integration studies from various parts of the United States. In these studies, integration costs are typically divided into three types, based on the timescales important to reliable and economic power system operation. These three types are the first three of the four impacts discussed previously: Regulation – the increased costs that result from providing short-term ramping (seconds to minutes) resulting from wind deployment. Load following – the increased costs that result from providing the hourly ramping requirements resulting from wind deployment. Wind uncertainty – the increased costs that result from having a suboptimal mix of units online because of errors in the wind forecast. This is typically called unit commitment or scheduling cost because it involves costs associated with committing (turning on) too few or too many slow-starting, but lower operational-cost units than would have been committed if the wind forecast been more accurate. 34 These tools have several names such as “production cost” or “security-constrained unit commitment and economic dispatch” models. 19
  • 27. Table 4.1. Summary of Recent Wind Integration Cost Studies (DeCesaro et al. 2009) Date Study Wind Regula- Load- Unit Other Tot Oper. Capacity tion Cost Following Commit- ($/MWh) Cost Impact Penetra- ($/MWh) Cost ment ($/MWh) tion (%) ($/MWh) Cost ($/MWh) 2003 Xcel-UWIG 3.5 0 0.41 1.44 Na 1.85 2003 WE Energies 29 1.02 0.15 1.75 Na 2.92 2004 Xcel-MNDOC 15 0.23 na 4.37 Na 4.6 2005 PacifiCorp-2004 11 0 1.48 3.16 Na 4.64 Calif. (multi- 2006 year)a 4 0.45 trace trace Na 0.45 b 2006 Xcel-PSCo 15 0.2 na 3.32 1.45 4.97 c 2006 MN-MISO 36 na na na na 4.41 Puget Sound 2007 Energy 12 na na na na 6.94 Arizona Pub. 2007 Service 15 0.37 2.65 1.06 na 4.08 d 2007 Avista Utilities 30 1.43 4.4 3 na 8.84 2007 Idaho Power 20 na na na na 7.92 2007 PacifiCorp-2007 18 na 1.1 4 na 5.1 e 2008 Xcel-PSCo 20 na na na na 8.56 a Regulation costs represent 3-year average. b The Xcel/PSCO study also examine the cost of gas supply scheduling. Wind increases the uncertainty of gas requirements and may increase costs of gas supply contracts. c Highest over 3-year evaluation period. 30.7% capacity penetration corresponding to 25% energy penetration d Unit commitment includes cost of wind forecast error. e This integration cost reflects a $10/MMBtu natural gas scenario. This cost is much higher than the integration cost calculated for Xcel-PSCo in 2006, in large measure due to the higher natural gas price: had the gas price from the 2006 study been used in the 2008 study, the integration cost would drop from $8.56/MWh to $5.13/MWh. 20
  • 28. The overall cost impact of accommodating wind variability in these studies is typically less than $5/MWh (0.5 cents/kWh), adding less than 10% to the cost of wind energy. 35 The majority of these costs appear to be a result of wind forecasting errors and uncertainty – resulting in “unit commitment” errors where too little or too much capacity is kept online. It is worth noting that wind forecasting is an area of active research, and these errors are expected to decrease in time, which could potentially lead to a corresponding decrease in unit commitment errors and associated costs. The explanation for this relatively modest impact on costs is largely based on the already significant variation in normal load. The large amount of flexible generation already available to meet the variability in demand has the ability to respond to the greater variability caused by the large-scale deployment of wind. Furthermore, these studies have found significant benefits of spatial diversity – just because the wind isn’t blowing in one location, it may be in another. The combination of multiple wind sites tends to smooth out the aggregated wind generation in a system, which reduces the per-unit size of ramps and mitigates the range of flexibility required. 36 Far less work has been performed on the operational impacts of large-scale solar generation due largely to lower deployment rates compared to wind. 37 In addition, there is insufficient solar data available to estimate impacts on frequency regulation and ramping (Lew et al. 2009.) One study of PV on the Xcel Colorado utility system found integration costs of between $3.51/MWh and $7.14/MWh for a scenario examining 800 MW of solar in a 6,922 MW peaking system, with gas prices ranging from $7.83 to $11.83/MMBTU (EnerNex 2009). Additional studies are ongoing, but it will be some time until knowledge of solar’s impact on the grid and associated costs are understood to the degree of wind. 38 In reality, while these studies divide the costs into three main categories, the source of actual integration costs is largely associated with the fuel costs needed to provide the additional required reserves, along with some variable operations and maintenance costs. To provide regulation and load following, the additional variability requires that utilities run more flexible generators (such as gas-fired units instead of coal units, or simple-cycle turbines instead of combined-cycle turbines) to ensure that additional ramping requirements can be met. This was illustrated previously in Figure 2.3 where a 35 This actually oversimplifies the situation. Some research indicates that these costs are not entirely integration costs but a modeling artifact of how the “base case” in these studies is actually simulated (Milligan and Kirby 2009). 36 “Combining geographically diverse wind and solar resources into a single portfolio tends to reduce hourly and sub-hourly variations in real-time output. This would result in a more consistent level of output over a longer time frame, which could reduce the cost of wind integration” (Hurlbut 2009). For additional analysis of spatial diversity, see also Palmintier et al. 2008. 37 In 2008, more than 8.5 GW of wind was installed in the United States, reaching a total capacity of about 25.3 GW by the end of the year (AWEA 2009). In the same year, 0.3 GW of solar PV was installed, reaching a total capacity of about 1 GW (Sherwood 2009). 38 The impacts of CSP are largely unquantified as well. However, it is expected that the impact of CSP on short time scales will be significantly less than PV, because CSP has significant “thermal inertia” in the system that will minimize high-frequency ramping events. Furthermore, CSP has the potential advantage of utilizing high-efficiency thermal storage discussed in Section 5. 21
  • 29. “nonoptimal” mix of generators was needed to provide the ability to adjust output in response to contingencies and other variations in demand. This combination of higher fuel costs and lower-efficiency units results in increased cost of fuel per unit of electricity generated as opposed to the “no-wind” cases. 39 Additional fuel costs occur from keeping units at part-load, ready to respond to the variability, or from more frequent unit starts. The costs associated with unit commitment or scheduling are also largely captured in increased fuel costs. Most large thermal generators must be scheduled several hours (or even days) in advance to be ready when needed. Ideally, utilities schedule and operate only as many plants as needed to meet energy and reserve requirements at each moment in time. If utilities over-schedule (turn on too many plants), they will have many plants running at part-load, and have incurred higher than needed start-up costs. So, if they under-predict the wind, they will commit and start up too many plants, which incurs greater fuel (and other) costs than needed if the wind and corresponding net load had been forecasted accurately. Conversely, if the wind forecast is too high and the net load is higher than expected, insufficient thermal generation may be committed to cover the unexpected shortfall in capacity. A worst-case scenario would be a partial blackout; but the likely result is the use of high-cost “quick-start” units in real-time, purchasing expensive energy from neighboring utilities (if available), or paying customers a premium to curtail load – all while lower cost units are sitting idle. An example of this is the ERCOT event of Feb. 26, 2008 (Ela and Kirby 2008). On this date, a combination of events – including a greater than predicted demand for energy, a forced outage of a conventional unit, the wind forecast not being given to the system operators, and a lower than expected wind output – resulted in too little capacity online to meet load. As a result, the ERCOT system needed to deploy high-cost quick-start units, as well as pay customers to curtail load through its “load acting as a resource” program. 40 All of this occurred while lower-cost units were idle because the combination of events was unanticipated. 41 39 It should be noted that these increased costs are associated with the “residual” part of the system that provides the load not met by VG. This is often a source of confusion and is sometimes interpreted as an increase in fuel use and emissions of the total system – implying that the additional reserve requirements of VG somehow actually increase fuel use and emissions of the system, or that VG has a net negative impact on emissions. This is not the case, and integration studies have universally concluded that any increase in fuel use associated with reserves for VG is much smaller than overall avoided fuel and emissions from displaced conventional generation. 40 Customers with interruptible loads that can meet certain performance requirements may be qualified to provide operating reserves under the Load Acting as a Resource (LaaR) program. In eligible ancillary services (AS) markets, the value of the LaaR load reduction is equal to that of an increase in generation by a generating plant. See http://www.ercot.com/services/programs/load/laar/ 41 This issue has important implications for the use of storage or any other device used to mitigate uncertainty. Energy storage, like any other generator, needs to be scheduled – a storage device used for load leveling may not be able to simultaneously provide hedging against under-forecasted wind, because it may already be discharging. 22
  • 30. While the bulk of the costs associated with wind integration are due to fuel use, the increased cycling also increases wear and tear on generators, which imposes extra maintenance costs. 42 Results from wind integration studies almost universally come to the conclusion that at the penetrations studied to date (up to about 30% on an energy basis), the analyzed systems do not need additional energy storage to accommodate wind’s variability and maintain reliable service. 43 In the studied systems, no new generation technologies are required; but there are some potentially significant operational changes needed to maintain the present level of reliability (along with significant transmission additions needed to exchange resources over larger areas). 44 However, they do not necessarily find the “cost optimal” solution, which may include energy storage or some alternative mix of generation to further reduce the cost of wind integration. Furthermore, these studies have not evaluated much higher penetration levels of RE, where additional system constraints may require additional enabling technologies such as energy storage. 4.2 Limiting Factors for Integration of Wind and Solar Energy To date, integration studies in the United States have found that variable generation sources can be incorporated into the grid by changing operational practices to address the increased ramping requirements over various timescales. At higher penetrations (beyond those already studied), the required ramp ranges will increase, which adds additional costs and the need for fast-responding generation resources. However, there are additional constraints on the system that will present additional challenges. These constraints are based on the simple coincidence of renewable energy supply and demand for electricity, combined with the operational limits on generators providing baseload power and operating reserves. Of the four operational cost impacts listed in the beginning of Section 4 (regulation, load following, scheduling, and ramping range), only the first three present major quantifiable costs in U.S. studies as of the end of 2009. Yet, it is the fourth constraint that may present an economic upper limit on variable renewable penetration without the use of enabling technologies. 45 As discussed in Section 1, in current electric power systems, electricity is generated by two general types of generators: baseload generators, which run at nearly constant output; and load-following units (including both intermediate load and peaking plants), which meet the variation in demand as well as provide operating reserves. At current penetrations of wind and solar in the United States, and at the levels studied in most integration studies, wind and solar generation primarily displaces flexible load-following 42 A number of utilities have expressed the opinion that these costs are not well-captured in previous wind integration studies. This issue is discussed later in this report. 43 This also explains why no significant new storage has been developed in the United States or Europe despite the 25 GW and 65 GW of wind development, respectively, as of the end of 2008 (EWEA 2009). 44 The more recent U.S. studies of very high penetration (the Western Wind and Solar Integration Study and the Eastern Wind Integration Study) require power and energy exchanges over larger areas than typically occur in the existing system (Milligan et al. 2009a). 45 One additional challenge in a high-VG grid is the potential decrease in mechanical inertia that helps maintain system frequency. This concern is not well understood and could be mitigated by a variety of technologies including improved controls on wind generators, or other sources of real or virtual inertia that could include energy storage. See, for example, Doherty et al. (forthcoming). 23
  • 31. generators. Figures 4.2 and 4.3 illustrate this issue by providing the impacts of increasing amounts of wind generation in a simulated grid. 46 In Figure 4.2, wind provides 8.5 % of the energy in this four-day period and displaces the output from a mix of gas-fired units, which are already typically used to follow load. Because these generators are designed to vary output, they can do this with modest cost penalties as analyzed in the wind integration studies discussed previously. Load Net Load Load Met by Inflexible Generation Wind 70000 60000 50000 40000 MW 30000 20000 10000 0 0 24 48 72 96 Hours Figure 4.2. Dispatch with low VG penetration (wind providing 8.5% of load) At higher penetration of RE, the ability of conventional generators to reduce output becomes an increasing concern. In Figure 4.3, wind now provides 16% of the total demand in this four-day period. Variable renewables begin to displace units that are traditionally not cycled, and the ability of these thermal generators to reduce output may become constrained. If the baseload generators cannot reduce output (and some other use cannot be found for this “excess generation”), 47 then wind energy will need to be curtailed – this occurs in the overnight periods in the first two days of this scenario. 46 This simulation uses historical load data from ERCOT from 2005 and simulated wind data for the same year provided by AWS Truewinds. While the wind and load data is from ERCOT, the mix of generators (flexible and inflexible) is hypothetical and used only to illustrate the impact of VG. For additional discussion of the wind data, see GE Energy 2008. 47 The alternative to curtailment is finding some alternative use for this energy through enabling techniques and technologies, which may include energy storage. These options are discussed in Section 5. 24
  • 32. Wind Net Load Met by Inflexible Generation 70000 Curtailed Wind Net Load Met by Flexible Generation Load 60000 50000 40000 MW 30000 20000 10000 0 0 24 48 72 96 Hours Figure 4.3. Dispatch with higher VG penetration (wind providing 16% of load) Utilities in the United States have expressed concern about their systems “bottoming out” due to the minimum generation requirements during overnight hours, and being unable to accommodate more variable generation during these periods. Minimum generation constraints (and resulting wind curtailment) are already a real occurrence in the Danish power system, which has a large installed base of wind generation (Ackermann et al. 2009). Due to its reliance on combined heat and power electricity plants for district heating, the Danish system needs to keep many of its power plants running for heat. Large demand for heat sometimes occurs during cold, windy evenings, when electricity demand is low and wind generation is high. This combination sometimes results in an oversupply of generation, which forces curtailment of wind energy production. The need to curtail wind due to minimum load constraints has also been identified as an important component of future power systems in the United States. 48 Modern wind turbines can reliably curtail output, but this is largely undesirable because curtailment throws away cost-free and emissions-free energy. 49 The actual minimum load is a function of several factors including the mix of conventional generation, as well as the amount of reserves and the types of generators providing those reserves. The ability to cycle conventional units is both a technical and economic issue – there are technical limits to how much power plants of all types can be 48 “During over-generation periods, when dispatchable generation plants are already operating at their minimum levels, the California ISO needs to have an ability to curtail wind generation on an as-needed basis.” (CAISO 2007) 49 When curtailing output, wind or other VG can supply operating reserves. In some cases, the value of curtailed energy may actually exceed the value of energy, but the primary value of VG is displacing conventional generation. While Figure 4.3 curtails renewable generation, it not clear which plant “should” be curtailed. Ignoring operational constraints, from a strict economic sense, VG has a lower cost of energy and lower emissions; therefore, it should be curtailed last. 25
  • 33. turned down. Large coal plants are often restricted to operating in the range of 50-100% of full capacity, but there is significant uncertainty about this limit. This is partly because utilities often have limited experience with cycling large coal plants, and have expressed concern about potentially excessive maintenance impacts 50 and even safety. It should be noted that because cycling costs are not universally captured in operational models, they may be ignored or underestimated in wind and solar integration studies. 51 The impact of VG on power plant cycling is an active area of research, especially considering the evolving grid and introduction of more responsive generation. 52 It is unclear what changes in operation practices or generator modification utilities will need to make to cycle below their current minimum load points, which now typically occur during the early morning in spring. In a number of markets, energy prices have dropped below the actual variable (fuel) cost of producing electricity on a number of occasions. This indicates that power plant operators are willing to sell energy at a loss to avoid further reducing output. Figure 4.4 provides one example in the PJM market in 2002, where the price of electricity fell below the variable cost of generation (indicated by the dotted line) 53 from coal-fired units for about 100 hours during periods near the annual minimum. While not definitive, this indicates that under current operational practices, utilities in some systems may be uncomfortable or unable to cycle much below current minimum load levels. 54 In other locations, there may be a greater operating range if plant operators become more comfortable with cycling individual units. As an example, a recent wind integration study of the existing ERCOT system suggested the capability of the system to cycle down to a net load of about 13 GW, compared to the recent annual minimum loads of about 20 GW. However, this would require the coal fleet to cycle to below 50% of rated capacity, and gas plants to perform over an even greater cycling range (GE Energy 2008). 50 “Cycling operations, that include on/off startup/shutdown operations, on-load cycling, and high frequency MW changes for automatic generation control (AGC), can be very damaging to power generation equipment.” However, these costs can be very difficult to quantify, especially isolating the additional costs associated with cycling above and beyond normal operations (Lefton et al. 2006). 51 Wind integration studies typically use proprietary software and data sets, and do not always state which costs are and are not included. However, in the Western Wind and Solar Integration Study (the highest penetration U.S. integration study as of 2009) the study states: “‘Wear and tear’ costs due to increased or harder cycling of units were not taken into account because these have not been adequately quantified.” (Lew et al. 2009). 52 A more detailed analysis of the relationship between wind penetration and plant cycling is provided by Troy et al. (forthcoming). 53 During this year, the average price paid for coal in this region was about $31/ton. With a typical heat rate of about 10,500 BTU, this translates into a variable cost of $12-14/MWh. This cost can be observed in Figure 4.4 as the “floor” cluster of points at this level. Points below this level represent bids that are less than the cost of generation, but not necessarily uneconomic if the alternative is excessive cycling-induced maintenance or even a forced shutdown and very expensive restart of a coal generator. 54 Minimum load points would be less of a constraint if power plants could be quickly shut down and started up at low costs. With the exception of certain peaking plants such as aeroderivative turbines and fast-starting reciprocating engines, most plants have minimum up-and-down times, and require several hours to restart (at considerable cost). 26
  • 34. 250 Wholesale Price ($/MWh) 200 150 100 50 0 0 10000 20000 30000 40000 50000 60000 Load (MW) 35 30 Wholesale Price ($/MWh) 25 20 15 10 5 0 18000 20000 22000 24000 26000 Load (MW) Figure 4.4. Relationship between price and load in PJM in 2002 Overall, the ability to accommodate a variable and uncertain net load has been described as a system’s flexibility. System flexibility varies by system and over time as new technologies are developed and power plants are retired. In addition, VG deployment in the United States is still relatively small, and utilities have yet to evaluate the true cycling limits on conventional generators and their associated costs. Also, the additional reserve requirements due to VG at high penetration are still uncertain. As a result, it is not possible to precisely estimate the costs of VG integration or the amount of curtailment at very high penetration; it is also difficult to define with certainty the value of energy storage or other enabling technologies. It is clear, however, that substantial increase in the penetration of wind energy without storage will require changes in grid operation to reduce curtailment. Figure 4.5 illustrates the fraction of a system’s peak load derived from inflexible units as a function of the minimum load point. This is also expressed more generally as the system’s “flexibility factor,” which is defined as the fraction below the annual peak to which conventional generators can cycle (Denholm and Margolis 2007a and 2007b). In the current grid, the annual minimum load point is typically 30%-40% of annual peak load (or a flexibility factor of 60%-70%). If units cannot be cycled below this point, they will provide 55%-70% of a system’s energy; and even with storage, this level of inflexibility leaves only 30%-40% of a system’s energy for variable resources. One of the major conclusions of wind integration studies looking at higher penetrations is that 27
  • 35. minimum load points will need to be lowered substantially below their current annual minimums. 55 Flexibility Factor 100% 90% 80% 70% 60% 50% 100% % of Energy From Inflexible Typical 90% Minimum Load 80% 70% Generators 60% 50% 40% 30% 20% 10% 0% 0% 10% 20% 30% 40% 50% Minimum Load as a Fraction of Peak Load Figure 4.5. Contribution from inflexible generation Alternatively, it is possible to evaluate the relationship between system flexibility and large-scale penetration of VG, both with and without energy storage or other enabling technologies. Figure 4.6 shows an example of how flexibility affects the potential curtailment of wind and solar energy when deployed without storage. These two charts superimpose load data in ERCOT from 2005 with a spatially diverse set of simulated wind and solar data from the same year. 56,57 The simulation places 19 GW of wind and 11 GW of solar (representing an 80%/20% mix of wind and solar on an energy basis) into the 2005 ERCOT system, which had a peak demand of 60.3 GW. In the left chart, the system is assumed to be unable to cycle below the 2005 minimum point of 21 GW, resulting in substantial VG curtailment. In this simulation, wind and solar provide 20% of the grid’s annual energy, and 21% of the total renewable energy production is curtailed. The right graph shows the result of increasing flexibility, allowing for a minimum load point of 13 GW. Curtailment has been reduced to less than 3%, and the same amount of variable renewables now provides about 25% of the system’s annual energy. 55 This is noted in previous wind integration studies such as the ERCOT study (GE 2008), and the more recent Eastern and Western Interconnect studies. “As the penetration of wind and solar increase, the impact on base-load coal increases, becoming very challenging at the 30% penetration.” (Milligan et al. 2009b). 56 Historically, many estimates of the limits of wind penetration have used data from a single or very small set of wind power plants, and often a small balancing area. Without spatial diversity of resource and load, this leads to both excessive ramp rates and excessive curtailment. 57 The data set is the same as from Figures 4.2 and 4.3, with solar data derived from the National Solar Radiation Database. See Denholm and Margolis 2008 for additional details. The data was processed using the REFlex Model, which compares hourly electricity demand with VG supply and calculates curtailments as a function of system flexibility based on minimum load constraints. The model is described in more detail in Denholm and Margolis 2007a and 2007b. 28
  • 36. Load Met by Renewable Energy Net Load Met by Flexible Generation 50000 Curtailed Renewable Energy Net Load Met by Inflexible Generation 45000 Renewable Energy 40000 35000 30000 Inflexible System - MW 25000 20000 Minimum Load of 15000 21 GW 10000 5000 0 Decreased 0 24 48 72 96 curtailment Hours Net Load Met by Inflexible Generation Curtailed Renewable Energy 50000 Net Load Met by Flexible Generation Load Met by Renewable Energy Renewable Energy 45000 40000 35000 30000 MW 25000 More Flexible 20000 System - 15000 Minimum Load 10000 of 13 GW 5000 0 0 24 48 72 96 Hours Figure 4.6. Effect of decreasing minimum load point on increased use of RE These results can be evaluated more generally by examining the amount of curtailment that will result without energy storage as a function of system flexibility. Figure 4.7 shows example results, with three different minimum load/flexibility factors. The first curve illustrates the curtailment that would result if the system could not cycle below its 2005 annual minimum load of 21 GW. The second curve uses a minimum load of 12 GW, which corresponds roughly to the assumptions used in the 2008 ERCOT wind study (GE 2008). The third curve corresponds to a 6 GW minimum load, which largely eliminates baseload units from the generation mix, replacing them with more flexible units. 58 58 It should be noted that significant changes in the generation mix and corresponding changes in system flexibility could result from CO2 emissions constraints. Increased cost of carbon could motivate greater use of natural gas generation, and reduce use of coal, both of which would tend to increase system flexibility, and allow greater economic use of VG. This, in turn, would decrease fuel use and the capacity factor of thermal generators, which would also tend to increase the use of gas-fired generation and decrease the use of coal as the economic optimal mix of generation. For additional discussion, see Lamont 2008. 29