OTN Export Bulletin No4 - Grenada
•
0 gostou•1,104 visualizações

This Special Bulletin of the Office of Trade Negotiations (OTN), illustrates export performance of Grenada as at 2008.

Recomendados
Recomendados
Mais conteúdo relacionado
Destaque
Destaque (12)
Semelhante a OTN Export Bulletin No4 - Grenada
Semelhante a OTN Export Bulletin No4 - Grenada (20)
Mais de Office of Trade Negotiations (OTN), CARICOM Secretariat
Mais de Office of Trade Negotiations (OTN), CARICOM Secretariat (20)
Último
Último (20)
OTN Export Bulletin No4 - Grenada
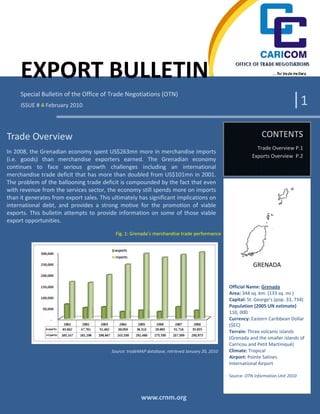
- 1. EXPORT BULLETIN Special Bulletin of the Office of Trade Negotiations (OTN) ISSUE # 4 February 2010 |1 Trade Overview CONTENTS Trade Overview P.1 In 2008, the Grenadian economy spent US$263mn more in merchandise imports Exports Overview P.2 (i.e. goods) than merchandise exporters earned. The Grenadian economy continues to face serious growth challenges including an international merchandise trade deficit that has more than doubled from US$101mn in 2001. The problem of the ballooning trade deficit is compounded by the fact that even with revenue from the services sector, the economy still spends more on imports than it generates from export sales. This ultimately has significant implications on international debt, and provides a strong motive for the promotion of viable exports. This bulletin attempts to provide information on some of those viable export opportunities. Fig. 1: Grenada’s merchandise trade performance GRENADA Official Name: Grenada Area: 344 sq. km. (133 sq. mi.) Capital: St. George’s (pop. 33, 734) Population (2005 UN estimate) 110, 000 Currency: Eastern Caribbean Dollar ($EC) Terrain: Three volcanic islands (Grenada and the smaller islands of Carricou and Petit Martiniqué) Source: tradeMAP database, retrieved January 20, 2010 Climate: Tropical Airport: Pointe Salines International Airport Source: OTN Information Unit 2010 www.crnm.org
- 2. |2 Between 2001 and 2008, merchandise export sales contracted by 7.9% annually to decline from US$64mn to US$36mn. Simultaneously, merchandise import expenditure grew faster than the exports sales. Between 2001 and 2008, merchandise import expenditure grew by almost 9% annually, hence, the merchandise trade deficit expanded significantly (see figure 1 above). In 2007, Grenadian services exporters generated US$147mn in sales, whilst the Grenadian market absorbed US$108mn in import spending, therefore generating a marginal intangibles (services) trade surplus. The services surplus however, was not adequate to address the circa US$260mn merchandise trade deficit which implies that there is still the need to promote greater exports of goods and services. Export Overview Grenada’s exports are not adequately diversified both in terms of the products, services1 exported, and the markets which are serviced. Barbados’ top export market in 2008 was the United States of America (USA). The USA accounted for over one‐fifth the total merchandise export earnings in 2008. In 2008, other top export markets included the United Kingdom (21%); France (11.9%); Dominica (9.8%); Barbados (5.2%); the Netherlands (4.6%); Germany (4.1%); St. Vincent and the Grenadines (2.3%); Canada (2.3%) and Austria (1.9%). The most dynamic markets for exports from Barbados between 2001 and 2008 included Indonesia (73% growth per annum); Thailand (71%); Slovakia (68.4%); the United Kingdom (34.9%); the Bahamas (26.9%); Guyana (25.4%); Sudan (25.3%); Austria (23.6%); France (14.2%) and Dominica (9.2%). These markets could be amongst those for any priority market penetration activities based on the strength of the growth trend. Although, these dynamic export markets are a major source of export earnings, as they jointly accounted for 49.6% of the total earnings in 2008, the remaining markets registered such large declines, they offset these penetration in these markets. For example, declines were registered between 2001 and 2008 in major markets such as the USA (15% decline annually), the Netherlands (16% decline annually) and Germany (22% decline). The top exports are detailed below. Table. 1: Grenada’s Top 15 Exports 1 Grenada’s services export earnings are concentrated in travel services (i.e. tourism). In 2007, Grenada earned over 75% of the total services export earnings from travel services. Other dominant services exports included communication services; other business, professional and technical services; and other direct insurance services. www.crnm.org
- 3. |3 In 2008, Barbados’ top 15 products generated over 82% of total export earnings. Therefore, these products are major export poles. The top 15 exports are composed mainly of manufactured products, some maritime re‐exports, with nutmeg, tuna and cocoa the main agricultural export featuring in this category. It is interesting to note that even though Grenada’s nutmeg sales have been contracting, global nutmeg sales have growth by 7% between 2004 and 2008, showing global demand for the product. Between 2004 and 2008, the most dynamic exports included chocolate and food preparations containing cocoa (154% growth in sales per annum); antibiotics,nes in dosage (98%); waste and scrap, copper or copper alloy (88%); cardamoms (77%); animal feed preparations (65%); wheat or meslin flour (54%); waste and scrap of aluminium (46%); carboys, bottles, flasks, jars, pots, phials and other containers of plastics (46%); fresh yellowfin tuna (28%) and knitted cotton t‐ shirts (15%). These exports have potential for diversifying the export base. Grenada exported a number of products in which they were ranked in the top twenty exporting nations in 2008. Based on their top 10 export share, these products should be a priority of any export development programme and include nutmeg (7th); mace (14th); fresh yellowfin tuna (17th); cardamoms (19th); sailboats, with or without auxiliary motor (27th) and fresh or chilled bigeye tunas “Thunnus obesus” (28th). ******************* www.crnm.org