SlideShare uma empresa Scribd logo
1 de 3
Baixar para ler offline
Population: 762,000
                     GUYANA                                                                                                    Area: 214,969 sq km (83,000 sq miles)


                                                                   MAIN ECONOMIC INDICATORS
                                                            2000         2001        2002                   2003     2004    2005     2006     2007       2008     2009       2010
               GDP ($US, billions)                           1.12        1.13        1.16                   1.20     1.25    1.31     1.46      1.74      1.92         2.02   2.19

                GDP (% change)                               -1.3         2.3         1.1                   -0.7      1.6     -1.9     5.1       7.0       2.0         3.3     4.4

             GDP per capita ($US)                           1,512        1,515      1,544                   1,588    1,655   1,729    1,911    2,277     2,497     2,629      2,831

Current account balance ($US, billions)                     -0.10        -0.11       -0.09                  -0.07    -0.08   -0.13    -0.19     -0.19     -0.25    -0.17      -0.22

    Current account balance (% of GDP)                       -8.4        -9.6        -7.5                   -5.8     -6.7    -10.1    -13.1     -11.1     -13.2        -8.5   -10.0

              Inflation (% change)                           6.1          2.6         5.4                    6.0      4.7     6.9      6.7      12.2       8.1         2.9     3.8

             Unemployment+ (%)                                 -           9          12                      -        -       -        -         -         -           -       -

                       GDP (% change)            Inflation (% change)                                                         GDP       Current account balance

                                                                                                             2.20
      11.8

       9.8                                                                                                   1.70

       7.8


                                                                                             $US Billions
                                                                                                             1.20
       5.8
%
       3.8                                                                                                   0.70

       1.8
                                                                                                             0.20
      -0.2
             2000 2001 2002 2003 2004 2005 2006 2007 2008 2009 2010                                                 2000 2001 2002 2003 2004 2005 2006 2007 2008 2009 2010
      -2.2                                                                                                  -0.30
                                                                    Source: IMF World Economic Outlook April 2010
+
 Source: The World Bank - http://databank.worldbank.org
*Numbers in italics represent estimates
Population: 762,000
                   GUYANA                                                                                            Area: 214,969 sq km (83,000 sq miles)


                                                    MAIN TRADE INDICATORS – GOODS
                                                             2004                      2005                         2006                2007                   2008
   Trade Balance ($US thousands)                            -92,823                  -239,489                      -325,542            -244,064              -582,765
Total Exported Value ($US thousands)                        543,263                   538,652                      567,385             784,714                834,266
Total Imported Value ($US thousands)                        636,086                   778,141                      892,927            1,028,778              1,417,031

           Top 10 Markets by % of Total Exported Value (2008)                                   Top 10 Markets by % of Total Imported Value (2008)

                  Canada                                                 22%           Trinidad and Tobago                                                      29%
United States of America                                     17%                   United States of America                                                  27%
         United Kingdom                             14%                                 Netherland Antilles                  7%
                 Ukraine              5%                                                         Venezuela                  6%
                 Jamaica             5%                                                               China                5%
             Netherlands             5%                                                     United Kingdom               4%
                Germany              5%                                                               Japan             3%
    Trinidad and Tobago            4%                                                             Suriname             2%
                 Belgium          3%                                                            Netherlands           2%
               Barbados         2%                                                                     India          2%


             Top 5 Exports by % of Total Exported Value (2008)        Fish,       Plastics and Top 5 Imports by % of Total Imported Value (2008) Electrical,
                                                                  crustaceans,      articles                                                     electronic
            Pearls, precious                                        molluscs,     thereof, 3%                                                  equipment, 5%
            stones, metals,                                          aquatic
                                                                 invertebrates,                                                             Vehicles other
              coins, 26%
                                                                       8%                                                                   than railway,
                                                 Cereals, 13%
                                                                                                                                            tramway, 6%

                                                                                              Mineral fuels,
                                                                                              oils, distillation
                                                                                              products, 36%                                    Nuclear
                                                  Sugars and                                                                                  reactors,
                                                    sugar                                                                                      boilers,
                    Ores, slag and              confectionery,                                                                              machinery, 11%
                      ash, 22%                       14%

                                                       Source: International Trade Centre – www.trademap.org
Population: 762,000
                     GUYANA                                                                                        Area: 214,969 sq km (83,000 sq miles)


                                                   MAIN TRADE INDICATORS – SERVICES
                                                    2003                      2004                       2005                    2006                      2007
   Trade Balance ($US thousands)                   -15,300                   -46,700                    -53,020                 -97,780                 -99,640
Total Exported Value ($US thousands)               156,800                   160,890                   147,870                  147,640                 172,900
Total Imported Value ($US thousands)               172,100                    207,590                  200,890                  245,420                 272,540

               Top Exports by % of Total Exported Value (2007)                                      Top Imports by % of Total Imported Value (2007)

                            Travel                                     29%                              Transportation                                        26%

                                                                                                  Personal remittances                             18%
         Royalties and license fees                              23%
                                                                                                Other business services                           18%
         Communications services                        19%
                                                                                                                  Travel                          17%
           Other business services                   16%
                                                                                                     Insurance services            7%
                   Transportation       5%
                                                                                              Communications services             6%
                Insurance services     4%                                                     Royalties and license fees          6%

  Computer & information services     3%                                               Computer & information services     1%


                                                        Source: International Trade Centre – www.trademap.org

Mais conteúdo relacionado

Mais procurados

Presentation jbs fixed income
Presentation jbs fixed incomePresentation jbs fixed income
Presentation jbs fixed incomeJBS RI
 
Roberto Coronado, Outlook for the El Paso-Juarez Region, Federal Reserve Bank...
Roberto Coronado, Outlook for the El Paso-Juarez Region, Federal Reserve Bank...Roberto Coronado, Outlook for the El Paso-Juarez Region, Federal Reserve Bank...
Roberto Coronado, Outlook for the El Paso-Juarez Region, Federal Reserve Bank...The Paso del Norte Group
 
045 Presentacion%20 Colombia%20 December%202009%20(Ingles)
045 Presentacion%20 Colombia%20 December%202009%20(Ingles)045 Presentacion%20 Colombia%20 December%202009%20(Ingles)
045 Presentacion%20 Colombia%20 December%202009%20(Ingles)amigueldiaz
 
Moz public invst-agriculture
Moz public invst-agricultureMoz public invst-agriculture
Moz public invst-agricultureIFPRI-Maputo
 
Lesson 8 presentation
Lesson 8 presentationLesson 8 presentation
Lesson 8 presentationrhernande128
 
enterpriseSeattle Forecast 2012 - Ken Goldstein
enterpriseSeattle Forecast 2012 - Ken GoldsteinenterpriseSeattle Forecast 2012 - Ken Goldstein
enterpriseSeattle Forecast 2012 - Ken GoldsteinenterpriseSeattle
 
100804 apresentação de resultados 2 t10-inglês_sem script [modo de compatib...
100804   apresentação de resultados 2 t10-inglês_sem script [modo de compatib...100804   apresentação de resultados 2 t10-inglês_sem script [modo de compatib...
100804 apresentação de resultados 2 t10-inglês_sem script [modo de compatib...Multiplus
 
terex KeyBanc060508
terex KeyBanc060508terex KeyBanc060508
terex KeyBanc060508finance42
 
Google student survey p4
Google student survey p4Google student survey p4
Google student survey p4liana1995
 
terex Jefferies081308
terex Jefferies081308terex Jefferies081308
terex Jefferies081308finance42
 
Prospect and challenges for sukuk ismail dadabhoy
Prospect and challenges for sukuk   ismail dadabhoyProspect and challenges for sukuk   ismail dadabhoy
Prospect and challenges for sukuk ismail dadabhoyUmer Ahmed, CIFP
 
BC Leading Housing Market - March 2011
BC Leading Housing Market -  March 2011BC Leading Housing Market -  March 2011
BC Leading Housing Market - March 2011Matt Collinge
 

Mais procurados (18)

St. Kitts & Nevis - Trade Profile [UWI's Shridath Ramphal Centre]
St. Kitts & Nevis -  Trade Profile [UWI's Shridath Ramphal Centre]St. Kitts & Nevis -  Trade Profile [UWI's Shridath Ramphal Centre]
St. Kitts & Nevis - Trade Profile [UWI's Shridath Ramphal Centre]
 
St. Lucia - Trade Profile [UWI's Shridath Ramphal Centre]
St. Lucia - Trade Profile [UWI's Shridath Ramphal Centre]St. Lucia - Trade Profile [UWI's Shridath Ramphal Centre]
St. Lucia - Trade Profile [UWI's Shridath Ramphal Centre]
 
Trinidad & Tobago - Trade Profile [UWI's Shridath Ramphal Centre]
Trinidad & Tobago - Trade Profile [UWI's Shridath Ramphal Centre]Trinidad & Tobago - Trade Profile [UWI's Shridath Ramphal Centre]
Trinidad & Tobago - Trade Profile [UWI's Shridath Ramphal Centre]
 
Jamaica - Trade Profile [UWI's Shridath Ramphal Centre]
Jamaica -  Trade Profile [UWI's Shridath Ramphal Centre]Jamaica -  Trade Profile [UWI's Shridath Ramphal Centre]
Jamaica - Trade Profile [UWI's Shridath Ramphal Centre]
 
Suriname - Trade Profile [UWI's Shridath Ramphal Centre]
Suriname -  Trade Profile [UWI's Shridath Ramphal Centre]Suriname -  Trade Profile [UWI's Shridath Ramphal Centre]
Suriname - Trade Profile [UWI's Shridath Ramphal Centre]
 
Presentation jbs fixed income
Presentation jbs fixed incomePresentation jbs fixed income
Presentation jbs fixed income
 
Roberto Coronado, Outlook for the El Paso-Juarez Region, Federal Reserve Bank...
Roberto Coronado, Outlook for the El Paso-Juarez Region, Federal Reserve Bank...Roberto Coronado, Outlook for the El Paso-Juarez Region, Federal Reserve Bank...
Roberto Coronado, Outlook for the El Paso-Juarez Region, Federal Reserve Bank...
 
045 Presentacion%20 Colombia%20 December%202009%20(Ingles)
045 Presentacion%20 Colombia%20 December%202009%20(Ingles)045 Presentacion%20 Colombia%20 December%202009%20(Ingles)
045 Presentacion%20 Colombia%20 December%202009%20(Ingles)
 
Moz public invst-agriculture
Moz public invst-agricultureMoz public invst-agriculture
Moz public invst-agriculture
 
Lesson 8 presentation
Lesson 8 presentationLesson 8 presentation
Lesson 8 presentation
 
enterpriseSeattle Forecast 2012 - Ken Goldstein
enterpriseSeattle Forecast 2012 - Ken GoldsteinenterpriseSeattle Forecast 2012 - Ken Goldstein
enterpriseSeattle Forecast 2012 - Ken Goldstein
 
100804 apresentação de resultados 2 t10-inglês_sem script [modo de compatib...
100804   apresentação de resultados 2 t10-inglês_sem script [modo de compatib...100804   apresentação de resultados 2 t10-inglês_sem script [modo de compatib...
100804 apresentação de resultados 2 t10-inglês_sem script [modo de compatib...
 
Cliff Brewis Outlook 2012
Cliff Brewis Outlook 2012Cliff Brewis Outlook 2012
Cliff Brewis Outlook 2012
 
terex KeyBanc060508
terex KeyBanc060508terex KeyBanc060508
terex KeyBanc060508
 
Google student survey p4
Google student survey p4Google student survey p4
Google student survey p4
 
terex Jefferies081308
terex Jefferies081308terex Jefferies081308
terex Jefferies081308
 
Prospect and challenges for sukuk ismail dadabhoy
Prospect and challenges for sukuk   ismail dadabhoyProspect and challenges for sukuk   ismail dadabhoy
Prospect and challenges for sukuk ismail dadabhoy
 
BC Leading Housing Market - March 2011
BC Leading Housing Market -  March 2011BC Leading Housing Market -  March 2011
BC Leading Housing Market - March 2011
 

Destaque

Destaque (8)

推广工作介绍
推广工作介绍推广工作介绍
推广工作介绍
 
Catalogo2 junio
Catalogo2 junioCatalogo2 junio
Catalogo2 junio
 
Catalogo3 junio
Catalogo3 junioCatalogo3 junio
Catalogo3 junio
 
Jamaica's Country Economic Memorandum - Unlocking Growth [World Bank]
Jamaica's Country Economic Memorandum - Unlocking Growth [World Bank]Jamaica's Country Economic Memorandum - Unlocking Growth [World Bank]
Jamaica's Country Economic Memorandum - Unlocking Growth [World Bank]
 
Fashion
FashionFashion
Fashion
 
美国五金展 4.25截止报名!
美国五金展 4.25截止报名!美国五金展 4.25截止报名!
美国五金展 4.25截止报名!
 
Jtc250 worm gear screw lifter,warm and warm gear screw jack 25 ton, lift jack...
Jtc250 worm gear screw lifter,warm and warm gear screw jack 25 ton, lift jack...Jtc250 worm gear screw lifter,warm and warm gear screw jack 25 ton, lift jack...
Jtc250 worm gear screw lifter,warm and warm gear screw jack 25 ton, lift jack...
 
Percentage of Imports From the EU Liberalized by Each CARIFORUM Member State ...
Percentage of Imports From the EU Liberalized by Each CARIFORUM Member State ...Percentage of Imports From the EU Liberalized by Each CARIFORUM Member State ...
Percentage of Imports From the EU Liberalized by Each CARIFORUM Member State ...
 

Semelhante a Guyana -Trade Profile [UWI's Shridath Ramphal Centre]

Economy of USA- An Current overview
Economy of USA- An Current overviewEconomy of USA- An Current overview
Economy of USA- An Current overviewRaj Kumar Singh
 
Yahoo Earnings Q3 2008
Yahoo Earnings Q3 2008Yahoo Earnings Q3 2008
Yahoo Earnings Q3 2008Keith Teare
 
Yahoo 3q08earningspreso Updated
Yahoo 3q08earningspreso UpdatedYahoo 3q08earningspreso Updated
Yahoo 3q08earningspreso Updatedgueste3e4f5
 
1ª conferência - James S Henry
1ª conferência - James S Henry 1ª conferência - James S Henry
1ª conferência - James S Henry CIEF2012
 
arnings Release 2Q07 Presentation
arnings Release 2Q07 Presentationarnings Release 2Q07 Presentation
arnings Release 2Q07 PresentationProfarma
 
Earnings Release 2 Q07
Earnings Release 2 Q07Earnings Release 2 Q07
Earnings Release 2 Q07Profarma
 
2005 - 5th Us Analyst And Investor Meeting Financials
2005 - 5th Us Analyst And Investor Meeting   Financials2005 - 5th Us Analyst And Investor Meeting   Financials
2005 - 5th Us Analyst And Investor Meeting FinancialsEmbraer RI
 
Profarma 4 q11
Profarma 4 q11Profarma 4 q11
Profarma 4 q11Profarma
 
yahoo 3Q08EarningsPreso
yahoo 3Q08EarningsPresoyahoo 3Q08EarningsPreso
yahoo 3Q08EarningsPresofinance32
 
Profarma 4 q12
Profarma 4 q12Profarma 4 q12
Profarma 4 q12Profarma
 
Sectoral Economic Development Strategy
Sectoral Economic Development StrategySectoral Economic Development Strategy
Sectoral Economic Development Strategyedunetwork
 
Profarma apresentação 2 q11
Profarma apresentação 2 q11Profarma apresentação 2 q11
Profarma apresentação 2 q11Profarma
 
2002* 2002 Farnborough Air Show Financial Results In Us Gaap
2002* 2002 Farnborough Air Show   Financial Results In Us Gaap2002* 2002 Farnborough Air Show   Financial Results In Us Gaap
2002* 2002 Farnborough Air Show Financial Results In Us GaapEmbraer RI
 
Perú ProinversióN
Perú ProinversióNPerú ProinversióN
Perú ProinversióNLuis
 
Profarma apresentacao 1_q11
Profarma apresentacao 1_q11Profarma apresentacao 1_q11
Profarma apresentacao 1_q11Profarma
 

Semelhante a Guyana -Trade Profile [UWI's Shridath Ramphal Centre] (20)

Economy of USA- An Current overview
Economy of USA- An Current overviewEconomy of USA- An Current overview
Economy of USA- An Current overview
 
Yahoo Earnings Q3 2008
Yahoo Earnings Q3 2008Yahoo Earnings Q3 2008
Yahoo Earnings Q3 2008
 
Yahoo 3q08earningspreso Updated
Yahoo 3q08earningspreso UpdatedYahoo 3q08earningspreso Updated
Yahoo 3q08earningspreso Updated
 
1ª conferência - James S Henry
1ª conferência - James S Henry 1ª conferência - James S Henry
1ª conferência - James S Henry
 
arnings Release 2Q07 Presentation
arnings Release 2Q07 Presentationarnings Release 2Q07 Presentation
arnings Release 2Q07 Presentation
 
Earnings Release 2 Q07
Earnings Release 2 Q07Earnings Release 2 Q07
Earnings Release 2 Q07
 
2005 - 5th Us Analyst And Investor Meeting Financials
2005 - 5th Us Analyst And Investor Meeting   Financials2005 - 5th Us Analyst And Investor Meeting   Financials
2005 - 5th Us Analyst And Investor Meeting Financials
 
Profarma 4 q11
Profarma 4 q11Profarma 4 q11
Profarma 4 q11
 
Slides from Conference Call
Slides from Conference CallSlides from Conference Call
Slides from Conference Call
 
Slides from Conference Call
Slides from Conference CallSlides from Conference Call
Slides from Conference Call
 
Read the Earnings Release
Read the Earnings ReleaseRead the Earnings Release
Read the Earnings Release
 
yahoo 3Q08EarningsPreso
yahoo 3Q08EarningsPresoyahoo 3Q08EarningsPreso
yahoo 3Q08EarningsPreso
 
Israel Economy
Israel EconomyIsrael Economy
Israel Economy
 
Profarma 4 q12
Profarma 4 q12Profarma 4 q12
Profarma 4 q12
 
Sectoral Economic Development Strategy
Sectoral Economic Development StrategySectoral Economic Development Strategy
Sectoral Economic Development Strategy
 
Profarma apresentação 2 q11
Profarma apresentação 2 q11Profarma apresentação 2 q11
Profarma apresentação 2 q11
 
2002* 2002 Farnborough Air Show Financial Results In Us Gaap
2002* 2002 Farnborough Air Show   Financial Results In Us Gaap2002* 2002 Farnborough Air Show   Financial Results In Us Gaap
2002* 2002 Farnborough Air Show Financial Results In Us Gaap
 
Indian Ocean Region Seychelles
Indian Ocean Region SeychellesIndian Ocean Region Seychelles
Indian Ocean Region Seychelles
 
Perú ProinversióN
Perú ProinversióNPerú ProinversióN
Perú ProinversióN
 
Profarma apresentacao 1_q11
Profarma apresentacao 1_q11Profarma apresentacao 1_q11
Profarma apresentacao 1_q11
 

Mais de Office of Trade Negotiations (OTN), CARICOM Secretariat

Mais de Office of Trade Negotiations (OTN), CARICOM Secretariat (20)

WEF Global Competitiveness Report 2014-15
WEF Global Competitiveness Report 2014-15WEF Global Competitiveness Report 2014-15
WEF Global Competitiveness Report 2014-15
 
2014 Annual Report - World Trade Organization (WTO)
2014 Annual Report - World Trade Organization (WTO)2014 Annual Report - World Trade Organization (WTO)
2014 Annual Report - World Trade Organization (WTO)
 
the Association of Caribbean States (ACS): 1994-2014 - 20 Years Promoting Coo...
the Association of Caribbean States (ACS): 1994-2014 - 20 Years Promoting Coo...the Association of Caribbean States (ACS): 1994-2014 - 20 Years Promoting Coo...
the Association of Caribbean States (ACS): 1994-2014 - 20 Years Promoting Coo...
 
TTIP: The Economic Analysis Explained
TTIP: The Economic Analysis ExplainedTTIP: The Economic Analysis Explained
TTIP: The Economic Analysis Explained
 
2014 National Trade Estimate Report on Foreign Trade Barriers
2014 National Trade Estimate Report on Foreign Trade Barriers2014 National Trade Estimate Report on Foreign Trade Barriers
2014 National Trade Estimate Report on Foreign Trade Barriers
 
OTN - Private Sector Trade Note - Vol 2 2014 - CARICOM-Ghana Trade
OTN - Private Sector Trade Note - Vol 2 2014 - CARICOM-Ghana TradeOTN - Private Sector Trade Note - Vol 2 2014 - CARICOM-Ghana Trade
OTN - Private Sector Trade Note - Vol 2 2014 - CARICOM-Ghana Trade
 
2014-03-03 OTN Special Update (The Focus of the WTO MC9)
2014-03-03 OTN Special Update (The Focus of the WTO MC9)2014-03-03 OTN Special Update (The Focus of the WTO MC9)
2014-03-03 OTN Special Update (The Focus of the WTO MC9)
 
OTN Special Update - Economic and Trade Policies Related to Diet and Obesity ...
OTN Special Update - Economic and Trade Policies Related to Diet and Obesity ...OTN Special Update - Economic and Trade Policies Related to Diet and Obesity ...
OTN Special Update - Economic and Trade Policies Related to Diet and Obesity ...
 
WTO Trade Facilitation Agreement - A Business Guide for Developing Countries ...
WTO Trade Facilitation Agreement - A Business Guide for Developing Countries ...WTO Trade Facilitation Agreement - A Business Guide for Developing Countries ...
WTO Trade Facilitation Agreement - A Business Guide for Developing Countries ...
 
OTN - Private Sector Trade Note - vol 4 2013
OTN - Private Sector Trade Note - vol 4 2013OTN - Private Sector Trade Note - vol 4 2013
OTN - Private Sector Trade Note - vol 4 2013
 
The CARICOM Common External Tariff (CET) – The Tariff Structure
The CARICOM Common External Tariff (CET) – The Tariff StructureThe CARICOM Common External Tariff (CET) – The Tariff Structure
The CARICOM Common External Tariff (CET) – The Tariff Structure
 
Innovation for Economic Performance the Case of Latin American Firms
Innovation for Economic Performance the Case of Latin American FirmsInnovation for Economic Performance the Case of Latin American Firms
Innovation for Economic Performance the Case of Latin American Firms
 
Caribbean Community Regional Aid for Trade Strategy 2013–2015 Caribbean Commu...
Caribbean Community Regional Aid for Trade Strategy 2013–2015 Caribbean Commu...Caribbean Community Regional Aid for Trade Strategy 2013–2015 Caribbean Commu...
Caribbean Community Regional Aid for Trade Strategy 2013–2015 Caribbean Commu...
 
CARIFESTA XI -Travel Guide
CARIFESTA XI -Travel GuideCARIFESTA XI -Travel Guide
CARIFESTA XI -Travel Guide
 
Details of the Post Technical Advisor Investment and Private Sector Office of...
Details of the Post Technical Advisor Investment and Private Sector Office of...Details of the Post Technical Advisor Investment and Private Sector Office of...
Details of the Post Technical Advisor Investment and Private Sector Office of...
 
CARICOM View: 40 years of integration, come celebrate with us
CARICOM View:     40 years of integration, come celebrate with usCARICOM View:     40 years of integration, come celebrate with us
CARICOM View: 40 years of integration, come celebrate with us
 
OTN - Private Sector Trade Note - Vol 3 2013
OTN - Private Sector Trade Note - Vol 3 2013OTN - Private Sector Trade Note - Vol 3 2013
OTN - Private Sector Trade Note - Vol 3 2013
 
Aid for Trade: Case Study - Caribbean Aid for Trade (AfT) and Regional Integr...
Aid for Trade: Case Study - Caribbean Aid for Trade (AfT) and Regional Integr...Aid for Trade: Case Study - Caribbean Aid for Trade (AfT) and Regional Integr...
Aid for Trade: Case Study - Caribbean Aid for Trade (AfT) and Regional Integr...
 
OTN Special Update - Innovation - A New Frontier in Trade Multilateralism [20...
OTN Special Update - Innovation - A New Frontier in Trade Multilateralism [20...OTN Special Update - Innovation - A New Frontier in Trade Multilateralism [20...
OTN Special Update - Innovation - A New Frontier in Trade Multilateralism [20...
 
WTO Report - The Future of Trade: The Challenges of Convergence
WTO Report - The Future of Trade: The Challenges of ConvergenceWTO Report - The Future of Trade: The Challenges of Convergence
WTO Report - The Future of Trade: The Challenges of Convergence
 

Guyana -Trade Profile [UWI's Shridath Ramphal Centre]

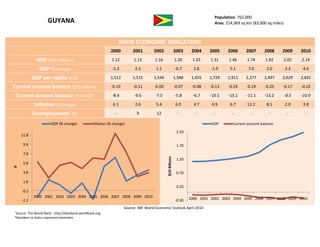
  • 1. Population: 762,000 GUYANA Area: 214,969 sq km (83,000 sq miles) MAIN ECONOMIC INDICATORS 2000 2001 2002 2003 2004 2005 2006 2007 2008 2009 2010 GDP ($US, billions) 1.12 1.13 1.16 1.20 1.25 1.31 1.46 1.74 1.92 2.02 2.19 GDP (% change) -1.3 2.3 1.1 -0.7 1.6 -1.9 5.1 7.0 2.0 3.3 4.4 GDP per capita ($US) 1,512 1,515 1,544 1,588 1,655 1,729 1,911 2,277 2,497 2,629 2,831 Current account balance ($US, billions) -0.10 -0.11 -0.09 -0.07 -0.08 -0.13 -0.19 -0.19 -0.25 -0.17 -0.22 Current account balance (% of GDP) -8.4 -9.6 -7.5 -5.8 -6.7 -10.1 -13.1 -11.1 -13.2 -8.5 -10.0 Inflation (% change) 6.1 2.6 5.4 6.0 4.7 6.9 6.7 12.2 8.1 2.9 3.8 Unemployment+ (%) - 9 12 - - - - - - - - GDP (% change) Inflation (% change) GDP Current account balance 2.20 11.8 9.8 1.70 7.8 $US Billions 1.20 5.8 % 3.8 0.70 1.8 0.20 -0.2 2000 2001 2002 2003 2004 2005 2006 2007 2008 2009 2010 2000 2001 2002 2003 2004 2005 2006 2007 2008 2009 2010 -2.2 -0.30 Source: IMF World Economic Outlook April 2010 + Source: The World Bank - http://databank.worldbank.org *Numbers in italics represent estimates
  • 2. Population: 762,000 GUYANA Area: 214,969 sq km (83,000 sq miles) MAIN TRADE INDICATORS – GOODS 2004 2005 2006 2007 2008 Trade Balance ($US thousands) -92,823 -239,489 -325,542 -244,064 -582,765 Total Exported Value ($US thousands) 543,263 538,652 567,385 784,714 834,266 Total Imported Value ($US thousands) 636,086 778,141 892,927 1,028,778 1,417,031 Top 10 Markets by % of Total Exported Value (2008) Top 10 Markets by % of Total Imported Value (2008) Canada 22% Trinidad and Tobago 29% United States of America 17% United States of America 27% United Kingdom 14% Netherland Antilles 7% Ukraine 5% Venezuela 6% Jamaica 5% China 5% Netherlands 5% United Kingdom 4% Germany 5% Japan 3% Trinidad and Tobago 4% Suriname 2% Belgium 3% Netherlands 2% Barbados 2% India 2% Top 5 Exports by % of Total Exported Value (2008) Fish, Plastics and Top 5 Imports by % of Total Imported Value (2008) Electrical, crustaceans, articles electronic Pearls, precious molluscs, thereof, 3% equipment, 5% stones, metals, aquatic invertebrates, Vehicles other coins, 26% 8% than railway, Cereals, 13% tramway, 6% Mineral fuels, oils, distillation products, 36% Nuclear Sugars and reactors, sugar boilers, Ores, slag and confectionery, machinery, 11% ash, 22% 14% Source: International Trade Centre – www.trademap.org
  • 3. Population: 762,000 GUYANA Area: 214,969 sq km (83,000 sq miles) MAIN TRADE INDICATORS – SERVICES 2003 2004 2005 2006 2007 Trade Balance ($US thousands) -15,300 -46,700 -53,020 -97,780 -99,640 Total Exported Value ($US thousands) 156,800 160,890 147,870 147,640 172,900 Total Imported Value ($US thousands) 172,100 207,590 200,890 245,420 272,540 Top Exports by % of Total Exported Value (2007) Top Imports by % of Total Imported Value (2007) Travel 29% Transportation 26% Personal remittances 18% Royalties and license fees 23% Other business services 18% Communications services 19% Travel 17% Other business services 16% Insurance services 7% Transportation 5% Communications services 6% Insurance services 4% Royalties and license fees 6% Computer & information services 3% Computer & information services 1% Source: International Trade Centre – www.trademap.org