SlideShare uma empresa Scribd logo
1 de 3
Baixar para ler offline
Population: 83,000
               ANTIGUA & BARBUDA                                                                                                             Area: 442 sq km (170 sq miles)


                                                                  MAIN ECONOMIC INDICATORS
                                                              2000           2001        2002            2003               2004     2005        2006        2007      2008      2009     2010
                 GDP ($US, billions)                           0.68           0.71       0.72               0.75             0.82     0.87       1.00        1.16       1.22      1.18     1.19

                  GDP (% change)                                3.3           1.5         2.0                   4.3          5.4      5.0        12.9         6.5       1.8       -6.7     -2.0

               GDP per capita ($US)                           8,871          9,153       9,128           9,478              10,165   10,729     12,192      13,879     14,556    13,852   13,825

Current account balance ($US, billions)                        -0.07         -0.06       -0.08            -0.10             -0.12    -0.16       -0.32       -0.38     -0.35     -0.27    -0.19

    Current account balance (% of GDP)                         -9.8           -8.0       -11.5            -12.9             -14.5    -18.8       -31.6       -32.9     -28.9     -23.1    -15.8

                Inflation (% change)                           -0.6           1.7         2.4                   2.0          2.0      2.1         1.8         1.4       5.3       -0.6     3.5

               Unemployment+ (%)                                 -             8           -                     -            -        -           -           -          -        -        -

                        GDP (% change)             Inflation (% change)                                                                GDP             Current account balance

        13.0                                                                                                         1.20

                                                                                                                     1.00
         8.0                                                                                                         0.80

                                                                                                                     0.60


                                                                                                 $US Billions
    %    3.0                                                                                                         0.40

                                                                                                                     0.20
        -2.0    2000 2001 2002 2003 2004 2005 2006 2007 2008 2009 2010                                               0.00

                                                                                                                 -0.20       2000 2001 2002 2003 2004 2005 2006 2007 2008 2009 2010

        -7.0                                                                                                     -0.40
                                                                       Source: IMF World Economic Outlook April 2010
+
 Source: The World Bank - http://databank.worldbank.org
*Numbers in italics represent estimates
Population: 83,000
         ANTIGUA & BARBUDA                                                                                                    Area: 442 sq km (170 sq miles)


                                                                MAIN TRADE INDICATORS – GOODS
                                                                                  2005                          2006                      2007                     2008
         Trade Balance ($US, thousands)                                         -404,570                          -                     -474,450                -1,725,171
      Total Exported Value ($US, thousands)                                      120,636                          -                      98,628                  357,687
      Total Imported Value ($US, thousands)                                      525,206                          -                     573,078                 2,082,858
                     Top 10 Markets by Exported Value (2007)                                                      Top 10 Markets by Imported Value (2007)

     Netherland Antilles                                                        31%          United States of America                                                58%
United States of America                                             24%                              United Kingdom            6%
                Barbados                    8%                                                                  Japan         4%
                Dominica               6%                                                         Netherland Antilles         4%
        United Kingdom            4%                                                             Trinidad and Tobago          4%
    Saint Kitts and Nevis         4%                                                                              Italy      3%
                Nicaragua         4%                                                                           Canada        2%
                   France        3%                                                                       Switzerland       1%
                  Anguilla      3%                                                                              China       1%
             Saudi Arabia      2%                                                                           Barbados        1%

   Machinery for Top 5 Exports by Exported Value (2008)                  Flat-rolled             Other vessels Top 5 Imports by Imported Value (2008)
   working rubber                                                       products of              and floating
     & plastics                                                       iron/non-alloy            structures, 1%                   Cars, 1%    Petroleum oils
        10%                                                                 steel                                                             (not crude),
                                                                             8%                                                                   14%
             Yachts &
            vessels for
         pleasure/sports
               11%                               Cruise ship,                                                             Cruise
                                                 cargo ship,                                                               ship,
                                                   barges                                                                  cargo                    Commodities
              Petroleum oils                        58%                                                                    ship,                   not elsewhere
               (not crude)                                                                                                barges,                  specified, 21%
                   13%                                                                                                      43%

                                                                 Source: International Trade Centre – www.trademap.org
Population: 83,000
         ANTIGUA & BARBUDA                                                                                       Area: 442 sq km (170 sq miles)


                                                  MAIN TRADE INDICATORS – SERVICES
                                                                       2005                          2006                        2007                2008
         Trade Balance ($US, thousands)                              -404,570                          -                       -474,450           -1,725,171
      Total Exported Value ($US, thousands)                          120,636                           -                        98,628             357,687
      Total Imported Value ($US, thousands)                          525,206                           -                       573,078            2,082,858

              Top Exports by % of Total Exported Value (2008)                                   Top Imports by % of Total Imported Value (2008)

                 Travel                                                66%                Transportation                                                  36%
        Transportation                  18%                                                        Travel                                 19%
Other business services           10%                                                  Insurance services                             17%
     Insurance services     3%                                                    Other business services                          15%
  Government services       2%                                                      Construction services                 7%
      Financial services   1%                                                       Government services              5%
  Construction services    0.1%                                                   Royalties & license fees    0.3%
Royalties & license fees   0.1%                                                      Information services     0.1%

                                                      Source: International Trade Centre – www.trademap.org

Mais conteúdo relacionado

Mais procurados

Presentation jbs fixed income
Presentation jbs fixed incomePresentation jbs fixed income
Presentation jbs fixed incomeJBS RI
 
045 Presentacion%20 Colombia%20 December%202009%20(Ingles)
045 Presentacion%20 Colombia%20 December%202009%20(Ingles)045 Presentacion%20 Colombia%20 December%202009%20(Ingles)
045 Presentacion%20 Colombia%20 December%202009%20(Ingles)amigueldiaz
 
Roberto Coronado, Outlook for the El Paso-Juarez Region, Federal Reserve Bank...
Roberto Coronado, Outlook for the El Paso-Juarez Region, Federal Reserve Bank...Roberto Coronado, Outlook for the El Paso-Juarez Region, Federal Reserve Bank...
Roberto Coronado, Outlook for the El Paso-Juarez Region, Federal Reserve Bank...The Paso del Norte Group
 
Moz public invst-agriculture
Moz public invst-agricultureMoz public invst-agriculture
Moz public invst-agricultureIFPRI-Maputo
 
Lesson 8 presentation
Lesson 8 presentationLesson 8 presentation
Lesson 8 presentationrhernande128
 
Google student survey p4
Google student survey p4Google student survey p4
Google student survey p4liana1995
 
terex KeyBanc060508
terex KeyBanc060508terex KeyBanc060508
terex KeyBanc060508finance42
 
Colm Mc Carthy Limerick Feb 2009
Colm Mc Carthy Limerick Feb 2009Colm Mc Carthy Limerick Feb 2009
Colm Mc Carthy Limerick Feb 2009dpalcic
 
Tses Plass Presentation
Tses Plass PresentationTses Plass Presentation
Tses Plass PresentationSimon Kapenda
 
BC Leading Housing Market - March 2011
BC Leading Housing Market -  March 2011BC Leading Housing Market -  March 2011
BC Leading Housing Market - March 2011Matt Collinge
 
09 11 10 Web 2.0 Weekly
09 11 10 Web 2.0 Weekly09 11 10 Web 2.0 Weekly
09 11 10 Web 2.0 WeeklyDavid Shore
 
Statistical profile
Statistical profileStatistical profile
Statistical profilecarrieriddle
 

Mais procurados (18)

St. Kitts & Nevis - Trade Profile [UWI's Shridath Ramphal Centre]
St. Kitts & Nevis -  Trade Profile [UWI's Shridath Ramphal Centre]St. Kitts & Nevis -  Trade Profile [UWI's Shridath Ramphal Centre]
St. Kitts & Nevis - Trade Profile [UWI's Shridath Ramphal Centre]
 
Trinidad & Tobago - Trade Profile [UWI's Shridath Ramphal Centre]
Trinidad & Tobago - Trade Profile [UWI's Shridath Ramphal Centre]Trinidad & Tobago - Trade Profile [UWI's Shridath Ramphal Centre]
Trinidad & Tobago - Trade Profile [UWI's Shridath Ramphal Centre]
 
St. Lucia - Trade Profile [UWI's Shridath Ramphal Centre]
St. Lucia - Trade Profile [UWI's Shridath Ramphal Centre]St. Lucia - Trade Profile [UWI's Shridath Ramphal Centre]
St. Lucia - Trade Profile [UWI's Shridath Ramphal Centre]
 
Jamaica - Trade Profile [UWI's Shridath Ramphal Centre]
Jamaica -  Trade Profile [UWI's Shridath Ramphal Centre]Jamaica -  Trade Profile [UWI's Shridath Ramphal Centre]
Jamaica - Trade Profile [UWI's Shridath Ramphal Centre]
 
Suriname - Trade Profile [UWI's Shridath Ramphal Centre]
Suriname -  Trade Profile [UWI's Shridath Ramphal Centre]Suriname -  Trade Profile [UWI's Shridath Ramphal Centre]
Suriname - Trade Profile [UWI's Shridath Ramphal Centre]
 
Presentation jbs fixed income
Presentation jbs fixed incomePresentation jbs fixed income
Presentation jbs fixed income
 
045 Presentacion%20 Colombia%20 December%202009%20(Ingles)
045 Presentacion%20 Colombia%20 December%202009%20(Ingles)045 Presentacion%20 Colombia%20 December%202009%20(Ingles)
045 Presentacion%20 Colombia%20 December%202009%20(Ingles)
 
Roberto Coronado, Outlook for the El Paso-Juarez Region, Federal Reserve Bank...
Roberto Coronado, Outlook for the El Paso-Juarez Region, Federal Reserve Bank...Roberto Coronado, Outlook for the El Paso-Juarez Region, Federal Reserve Bank...
Roberto Coronado, Outlook for the El Paso-Juarez Region, Federal Reserve Bank...
 
Moz public invst-agriculture
Moz public invst-agricultureMoz public invst-agriculture
Moz public invst-agriculture
 
Cliff Brewis Outlook 2012
Cliff Brewis Outlook 2012Cliff Brewis Outlook 2012
Cliff Brewis Outlook 2012
 
Lesson 8 presentation
Lesson 8 presentationLesson 8 presentation
Lesson 8 presentation
 
Google student survey p4
Google student survey p4Google student survey p4
Google student survey p4
 
terex KeyBanc060508
terex KeyBanc060508terex KeyBanc060508
terex KeyBanc060508
 
Colm Mc Carthy Limerick Feb 2009
Colm Mc Carthy Limerick Feb 2009Colm Mc Carthy Limerick Feb 2009
Colm Mc Carthy Limerick Feb 2009
 
Tses Plass Presentation
Tses Plass PresentationTses Plass Presentation
Tses Plass Presentation
 
BC Leading Housing Market - March 2011
BC Leading Housing Market -  March 2011BC Leading Housing Market -  March 2011
BC Leading Housing Market - March 2011
 
09 11 10 Web 2.0 Weekly
09 11 10 Web 2.0 Weekly09 11 10 Web 2.0 Weekly
09 11 10 Web 2.0 Weekly
 
Statistical profile
Statistical profileStatistical profile
Statistical profile
 

Semelhante a Anitgua & Barbuda - Trade Profile [UWI's Shridath Ramphal Centre]

petsmart AR02
petsmart  AR02petsmart  AR02
petsmart AR02finance49
 
petsmart AR02
petsmart  AR02petsmart  AR02
petsmart AR02finance49
 
Slidecast ab inbev
Slidecast ab inbevSlidecast ab inbev
Slidecast ab inbevSimonsurmont
 
Texas Market O Verview Kdh
Texas Market O Verview KdhTexas Market O Verview Kdh
Texas Market O Verview KdhBob Lowery
 
Lizarran in Asian Market
Lizarran in Asian MarketLizarran in Asian Market
Lizarran in Asian MarketMariolaSV
 
Capital Markets Day 2011 Delivering Shareholder Value
Capital Markets Day 2011 Delivering Shareholder ValueCapital Markets Day 2011 Delivering Shareholder Value
Capital Markets Day 2011 Delivering Shareholder ValueGrigory Kuznetsov
 
Capital Markets Day 2011 Boris Podolsky
Capital Markets Day 2011 Boris PodolskyCapital Markets Day 2011 Boris Podolsky
Capital Markets Day 2011 Boris PodolskyCTC Media, Inc.
 
Us economic outlook micky levy, chief economist - bank of america 25 januar...
Us economic outlook   micky levy, chief economist - bank of america 25 januar...Us economic outlook   micky levy, chief economist - bank of america 25 januar...
Us economic outlook micky levy, chief economist - bank of america 25 januar...Jessica Roch
 
Conference call webcast 2010 results
Conference call webcast   2010 resultsConference call webcast   2010 results
Conference call webcast 2010 resultsmmxriweb
 
Mobile Payments and Mobile Commerce
Mobile Payments and Mobile CommerceMobile Payments and Mobile Commerce
Mobile Payments and Mobile CommerceOlivier Gillin
 
Boyuan Construction Investor Presentation
Boyuan Construction Investor PresentationBoyuan Construction Investor Presentation
Boyuan Construction Investor PresentationTMX Equicom
 
Apresentação 4Q11 conference call
Apresentação 4Q11 conference callApresentação 4Q11 conference call
Apresentação 4Q11 conference callJBS RI
 
Webcast 3Q11 english
Webcast 3Q11 englishWebcast 3Q11 english
Webcast 3Q11 englishmmxriweb
 
Presentación TechBa - Csoftmty
Presentación TechBa - CsoftmtyPresentación TechBa - Csoftmty
Presentación TechBa - CsoftmtyCsoftmty Monterrey
 

Semelhante a Anitgua & Barbuda - Trade Profile [UWI's Shridath Ramphal Centre] (20)

petsmart AR02
petsmart  AR02petsmart  AR02
petsmart AR02
 
petsmart AR02
petsmart  AR02petsmart  AR02
petsmart AR02
 
Slidecast ab inbev
Slidecast ab inbevSlidecast ab inbev
Slidecast ab inbev
 
Texas Market O Verview Kdh
Texas Market O Verview KdhTexas Market O Verview Kdh
Texas Market O Verview Kdh
 
Lizarran in Asian Market
Lizarran in Asian MarketLizarran in Asian Market
Lizarran in Asian Market
 
Cea
CeaCea
Cea
 
Capital Markets Day 2011 Delivering Shareholder Value
Capital Markets Day 2011 Delivering Shareholder ValueCapital Markets Day 2011 Delivering Shareholder Value
Capital Markets Day 2011 Delivering Shareholder Value
 
Capital Markets Day 2011 Boris Podolsky
Capital Markets Day 2011 Boris PodolskyCapital Markets Day 2011 Boris Podolsky
Capital Markets Day 2011 Boris Podolsky
 
Us economic outlook micky levy, chief economist - bank of america 25 januar...
Us economic outlook   micky levy, chief economist - bank of america 25 januar...Us economic outlook   micky levy, chief economist - bank of america 25 januar...
Us economic outlook micky levy, chief economist - bank of america 25 januar...
 
2013 Landstar presentation
2013 Landstar presentation2013 Landstar presentation
2013 Landstar presentation
 
Conference call webcast 2010 results
Conference call webcast   2010 resultsConference call webcast   2010 results
Conference call webcast 2010 results
 
2 q11
2 q112 q11
2 q11
 
Mobile Payments and Mobile Commerce
Mobile Payments and Mobile CommerceMobile Payments and Mobile Commerce
Mobile Payments and Mobile Commerce
 
Boyuan Construction Investor Presentation
Boyuan Construction Investor PresentationBoyuan Construction Investor Presentation
Boyuan Construction Investor Presentation
 
Apresentação 4Q11 conference call
Apresentação 4Q11 conference callApresentação 4Q11 conference call
Apresentação 4Q11 conference call
 
Webcast 3Q11 english
Webcast 3Q11 englishWebcast 3Q11 english
Webcast 3Q11 english
 
Presentación TechBa - Csoftmty
Presentación TechBa - CsoftmtyPresentación TechBa - Csoftmty
Presentación TechBa - Csoftmty
 
Slides from Conference Call
Slides from Conference CallSlides from Conference Call
Slides from Conference Call
 
Slides from Conference Call
Slides from Conference CallSlides from Conference Call
Slides from Conference Call
 
Read the Earnings Release
Read the Earnings ReleaseRead the Earnings Release
Read the Earnings Release
 

Mais de Office of Trade Negotiations (OTN), CARICOM Secretariat

Mais de Office of Trade Negotiations (OTN), CARICOM Secretariat (20)

WEF Global Competitiveness Report 2014-15
WEF Global Competitiveness Report 2014-15WEF Global Competitiveness Report 2014-15
WEF Global Competitiveness Report 2014-15
 
2014 Annual Report - World Trade Organization (WTO)
2014 Annual Report - World Trade Organization (WTO)2014 Annual Report - World Trade Organization (WTO)
2014 Annual Report - World Trade Organization (WTO)
 
the Association of Caribbean States (ACS): 1994-2014 - 20 Years Promoting Coo...
the Association of Caribbean States (ACS): 1994-2014 - 20 Years Promoting Coo...the Association of Caribbean States (ACS): 1994-2014 - 20 Years Promoting Coo...
the Association of Caribbean States (ACS): 1994-2014 - 20 Years Promoting Coo...
 
TTIP: The Economic Analysis Explained
TTIP: The Economic Analysis ExplainedTTIP: The Economic Analysis Explained
TTIP: The Economic Analysis Explained
 
2014 National Trade Estimate Report on Foreign Trade Barriers
2014 National Trade Estimate Report on Foreign Trade Barriers2014 National Trade Estimate Report on Foreign Trade Barriers
2014 National Trade Estimate Report on Foreign Trade Barriers
 
OTN - Private Sector Trade Note - Vol 2 2014 - CARICOM-Ghana Trade
OTN - Private Sector Trade Note - Vol 2 2014 - CARICOM-Ghana TradeOTN - Private Sector Trade Note - Vol 2 2014 - CARICOM-Ghana Trade
OTN - Private Sector Trade Note - Vol 2 2014 - CARICOM-Ghana Trade
 
2014-03-03 OTN Special Update (The Focus of the WTO MC9)
2014-03-03 OTN Special Update (The Focus of the WTO MC9)2014-03-03 OTN Special Update (The Focus of the WTO MC9)
2014-03-03 OTN Special Update (The Focus of the WTO MC9)
 
OTN Special Update - Economic and Trade Policies Related to Diet and Obesity ...
OTN Special Update - Economic and Trade Policies Related to Diet and Obesity ...OTN Special Update - Economic and Trade Policies Related to Diet and Obesity ...
OTN Special Update - Economic and Trade Policies Related to Diet and Obesity ...
 
WTO Trade Facilitation Agreement - A Business Guide for Developing Countries ...
WTO Trade Facilitation Agreement - A Business Guide for Developing Countries ...WTO Trade Facilitation Agreement - A Business Guide for Developing Countries ...
WTO Trade Facilitation Agreement - A Business Guide for Developing Countries ...
 
OTN - Private Sector Trade Note - vol 4 2013
OTN - Private Sector Trade Note - vol 4 2013OTN - Private Sector Trade Note - vol 4 2013
OTN - Private Sector Trade Note - vol 4 2013
 
The CARICOM Common External Tariff (CET) – The Tariff Structure
The CARICOM Common External Tariff (CET) – The Tariff StructureThe CARICOM Common External Tariff (CET) – The Tariff Structure
The CARICOM Common External Tariff (CET) – The Tariff Structure
 
Innovation for Economic Performance the Case of Latin American Firms
Innovation for Economic Performance the Case of Latin American FirmsInnovation for Economic Performance the Case of Latin American Firms
Innovation for Economic Performance the Case of Latin American Firms
 
Caribbean Community Regional Aid for Trade Strategy 2013–2015 Caribbean Commu...
Caribbean Community Regional Aid for Trade Strategy 2013–2015 Caribbean Commu...Caribbean Community Regional Aid for Trade Strategy 2013–2015 Caribbean Commu...
Caribbean Community Regional Aid for Trade Strategy 2013–2015 Caribbean Commu...
 
CARIFESTA XI -Travel Guide
CARIFESTA XI -Travel GuideCARIFESTA XI -Travel Guide
CARIFESTA XI -Travel Guide
 
Details of the Post Technical Advisor Investment and Private Sector Office of...
Details of the Post Technical Advisor Investment and Private Sector Office of...Details of the Post Technical Advisor Investment and Private Sector Office of...
Details of the Post Technical Advisor Investment and Private Sector Office of...
 
CARICOM View: 40 years of integration, come celebrate with us
CARICOM View:     40 years of integration, come celebrate with usCARICOM View:     40 years of integration, come celebrate with us
CARICOM View: 40 years of integration, come celebrate with us
 
OTN - Private Sector Trade Note - Vol 3 2013
OTN - Private Sector Trade Note - Vol 3 2013OTN - Private Sector Trade Note - Vol 3 2013
OTN - Private Sector Trade Note - Vol 3 2013
 
Aid for Trade: Case Study - Caribbean Aid for Trade (AfT) and Regional Integr...
Aid for Trade: Case Study - Caribbean Aid for Trade (AfT) and Regional Integr...Aid for Trade: Case Study - Caribbean Aid for Trade (AfT) and Regional Integr...
Aid for Trade: Case Study - Caribbean Aid for Trade (AfT) and Regional Integr...
 
OTN Special Update - Innovation - A New Frontier in Trade Multilateralism [20...
OTN Special Update - Innovation - A New Frontier in Trade Multilateralism [20...OTN Special Update - Innovation - A New Frontier in Trade Multilateralism [20...
OTN Special Update - Innovation - A New Frontier in Trade Multilateralism [20...
 
WTO Report - The Future of Trade: The Challenges of Convergence
WTO Report - The Future of Trade: The Challenges of ConvergenceWTO Report - The Future of Trade: The Challenges of Convergence
WTO Report - The Future of Trade: The Challenges of Convergence
 

Anitgua & Barbuda - Trade Profile [UWI's Shridath Ramphal Centre]

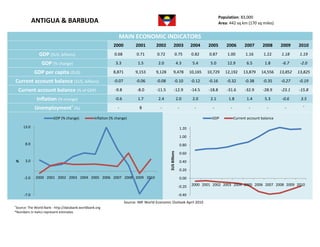
  • 1. Population: 83,000 ANTIGUA & BARBUDA Area: 442 sq km (170 sq miles) MAIN ECONOMIC INDICATORS 2000 2001 2002 2003 2004 2005 2006 2007 2008 2009 2010 GDP ($US, billions) 0.68 0.71 0.72 0.75 0.82 0.87 1.00 1.16 1.22 1.18 1.19 GDP (% change) 3.3 1.5 2.0 4.3 5.4 5.0 12.9 6.5 1.8 -6.7 -2.0 GDP per capita ($US) 8,871 9,153 9,128 9,478 10,165 10,729 12,192 13,879 14,556 13,852 13,825 Current account balance ($US, billions) -0.07 -0.06 -0.08 -0.10 -0.12 -0.16 -0.32 -0.38 -0.35 -0.27 -0.19 Current account balance (% of GDP) -9.8 -8.0 -11.5 -12.9 -14.5 -18.8 -31.6 -32.9 -28.9 -23.1 -15.8 Inflation (% change) -0.6 1.7 2.4 2.0 2.0 2.1 1.8 1.4 5.3 -0.6 3.5 Unemployment+ (%) - 8 - - - - - - - - - GDP (% change) Inflation (% change) GDP Current account balance 13.0 1.20 1.00 8.0 0.80 0.60 $US Billions % 3.0 0.40 0.20 -2.0 2000 2001 2002 2003 2004 2005 2006 2007 2008 2009 2010 0.00 -0.20 2000 2001 2002 2003 2004 2005 2006 2007 2008 2009 2010 -7.0 -0.40 Source: IMF World Economic Outlook April 2010 + Source: The World Bank - http://databank.worldbank.org *Numbers in italics represent estimates
  • 2. Population: 83,000 ANTIGUA & BARBUDA Area: 442 sq km (170 sq miles) MAIN TRADE INDICATORS – GOODS 2005 2006 2007 2008 Trade Balance ($US, thousands) -404,570 - -474,450 -1,725,171 Total Exported Value ($US, thousands) 120,636 - 98,628 357,687 Total Imported Value ($US, thousands) 525,206 - 573,078 2,082,858 Top 10 Markets by Exported Value (2007) Top 10 Markets by Imported Value (2007) Netherland Antilles 31% United States of America 58% United States of America 24% United Kingdom 6% Barbados 8% Japan 4% Dominica 6% Netherland Antilles 4% United Kingdom 4% Trinidad and Tobago 4% Saint Kitts and Nevis 4% Italy 3% Nicaragua 4% Canada 2% France 3% Switzerland 1% Anguilla 3% China 1% Saudi Arabia 2% Barbados 1% Machinery for Top 5 Exports by Exported Value (2008) Flat-rolled Other vessels Top 5 Imports by Imported Value (2008) working rubber products of and floating & plastics iron/non-alloy structures, 1% Cars, 1% Petroleum oils 10% steel (not crude), 8% 14% Yachts & vessels for pleasure/sports 11% Cruise ship, Cruise cargo ship, ship, barges cargo Commodities Petroleum oils 58% ship, not elsewhere (not crude) barges, specified, 21% 13% 43% Source: International Trade Centre – www.trademap.org
  • 3. Population: 83,000 ANTIGUA & BARBUDA Area: 442 sq km (170 sq miles) MAIN TRADE INDICATORS – SERVICES 2005 2006 2007 2008 Trade Balance ($US, thousands) -404,570 - -474,450 -1,725,171 Total Exported Value ($US, thousands) 120,636 - 98,628 357,687 Total Imported Value ($US, thousands) 525,206 - 573,078 2,082,858 Top Exports by % of Total Exported Value (2008) Top Imports by % of Total Imported Value (2008) Travel 66% Transportation 36% Transportation 18% Travel 19% Other business services 10% Insurance services 17% Insurance services 3% Other business services 15% Government services 2% Construction services 7% Financial services 1% Government services 5% Construction services 0.1% Royalties & license fees 0.3% Royalties & license fees 0.1% Information services 0.1% Source: International Trade Centre – www.trademap.org