Influence of Varying NPK levels and Rate at First Application on the Yield of Irrigated Wheat in a Semi-Arid Environment
•
1 gostou•585 visualizações

By A. Singh*, G.U. Aliyu, M.D. Magaji and M. Musa *Corresponding author:
Recomendados

Recomendados
Mais conteúdo relacionado
Mais de CIMMYT
Mais de CIMMYT (20)
Influence of Varying NPK levels and Rate at First Application on the Yield of Irrigated Wheat in a Semi-Arid Environment
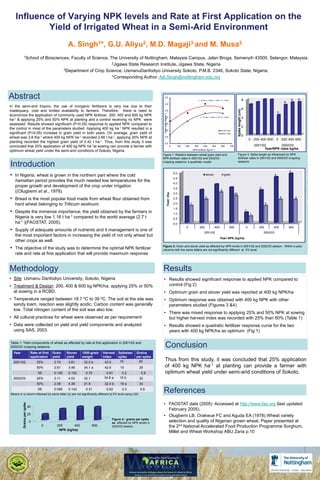
- 1. Influence of Varying NPK levels and Rate at First Application on the Yield of Irrigated Wheat in a Semi-Arid Environment A. Singh1*, G.U. Aliyu2, M.D. Magaji3 and M. Musa3 1School of Biosciences, Faculty of Science, The University of Nottingham, Malaysia Campus, Jalan Broga, Semenyih 43500, Selangor, Malaysia. 2Jigawa State Research Institute, Jigawa State, Nigeria 3Department of Crop Science, UsmanuDanfodiyo University Sokoto, P.M.B. 2346, Sokoto State, Nigeria. *Corresponding Author: Ajit.Singh@nottingham.edu.my Abstract 3.5 y = -6E-06x2 + 0.0054x + 1.6435, R2 = 0.9328 8 a a 3.0 b In the semi-arid tropics, the use of inorganic fertilizers is very low due to their 6 Spike length (cm) inadequacy, cost and limited availability to farmers. Therefore, there is need to 2.5 c Grain yield (Mg ha-1) economize the application of commonly used NPK fertilizer. 200, 400 and 600 kg NPK 2.0 y = -7E-06x2 + 0.0067x + 0.65, R2 = 0.9989 4 ha-1 & applying 25% and 50% NPK at planting and a control receiving no NPK were assessed. Results showed significant (P<0.05) response to applied NPK compared to 1.5 2 the control in most of the parameters studied. Applying 400 kg ha-1 NPK resulted in a 1.0 2001/02 Yield significant (P<0.05) increase in grain yield in both years. On average, grain yield of 2002/03 Yield 0 wheat was 3.8 tha-1 where 400 kg NPK ha-1 recorded 2.66 t ha-1, applying 25% NPK at 0.5 0 200 400 600 0 200 400 600 planting recorded the highest grain yield of 2.42 t ha-1. Thus, from this study it was 0.0 concluded that 25% application of 400 kg NPK ha-1at sowing can provide a farmer with 0 100 200 300 400 500 600 700 2001/02 2002/03 NPK fertilizer (kg ha-1) Year/NPK rates kg/ha optimum wheat yield under the semi-arid conditions of Sokoto, Nigeria Figure 1: Relation between wheat grain yield and Figure 3: Spike length as influenced by NPK NPK fertilizer rates in 2001/02 and 2002/03 fertilizer rates in 2001/02 and 2002/03 cropping seasons Introduction cropping seasons, a quadratic model a • In Nigeria, wheat is grown in the northern part where the cold 5.0 4.5 stover grain a hamattan period provides the much needed low temperatures for the 4.0 proper growth and development of the crop under irrigation 3.5 b a ((Olugbemi et al., 1978). Yield t/ha 3.0 ab • Bread is the most popular food made from wheat flour obtained from 2.5 b a a hard wheat belonging to Triticum aestivum. 2.0 c b 1.5 • Despite the immense importance, the yield obtained by the farmers in 1.0 c c Nigeria is very low 1.16 t ha-1 compared to the world average (2.7 t 0.5 ha-1 )(FAOSTAT, 2005). 0.0 0 200 400 600 0 200 400 600 • Supply of adequate amounts of nutrients and it management is one of 2001/02 2002/03 the most important factors in increasing the yield of not only wheat but Year/ NPK (kg/ha) other crops as well. • The objective of the study was to determine the optimal NPK fertilizer Figure 2: Grain and stover yield as affected by NPK levels in 2001/02 and 2002/03 season . Within a year, columns with the same letters are not significantly different at 5% level. rate and rate at first application that will provide maximum response Methodology Results • Site: Usmanu Danfodiyo University, Sokoto, Nigeria • Results showed significant response to applied NPK compared to • Treatment & Design: 200, 400 & 600 kg NPK/ha, applying 25% or 50% control (Fig 2) at sowing in a RCBD. • Optimum grain and stover yield was reported at 400 kg NPK/ha • Temperature ranged between 18.7 0C to 39 0C. The soil at the site was • Optimum response was obtained with 400 kg NPK with other sandy loam, reaction was slightly acidic, Carbon content was generally parameters studied (Figures 3 &4) low. Total nitrogen content of the soil was also low. • There was mixed response to applying 25% and 50% NPK at sowing • All cultural practices for wheat were observed as per requirement but higher harvest index was recorded with 25% than 50% (Table 1) • Data were collected on yield and yield components and analyzed • Results showed a quadratic fertilizer response curve for the two using SAS, 2003. years with 400 kg NPK/ha as optimum (Fig 1) Table 1: Yield components of wheat as affected by rate at first application in 2001/02 and 2002/03 cropping seasons. Conclusion Year Rate at first Grain Stover 1000-grain Harvest Spikeles/ Grains application yield yield weight index spike per spike 2001/02 25% 2.74 3.61 32.0 b 43.0 15 30 Thus from this study, it was concluded that 25% application 50% 2.61 3.46 34.1 a 42.9 15 29 of 400 kg NPK ha-1 at planting can provide a farmer with SE 0.145 0.152 0.70 0.81 0.2 0.8 optimum wheat yield under semi-arid conditions of Sokoto. 2002/03 25% 2.11 4.03 32.1 34.8 a 15 b 32 50% 2.08 4.38 31.9 32.4 b 16 a 34 Insert table here SE 0.090 0.142 0.31 0.62 0.3 Means in a column followed by same letter (s) are not significantly different at 5% level using LSD. 0.8 References • FAOSTAT data (2005) Accessed at http://www.fao.org (last updated Grains per spike 40 February 2005). 20 • Olugbemi LB, Orakwue FC and Aguda EA (1978) Wheat variety Figure 4: grains per spike 0 as affected by NPK levels in selection and quality of Nigerian grown wheat, Paper presented at 0 200 400 600 2002/03 season . the 2nd National Accelerated Food Production Programme Sorghum, NPK (kg/ha) Millet and Wheat Workshop ABU Zaria p.10