March 2009 Crime Statistics
•
1 like•289 views

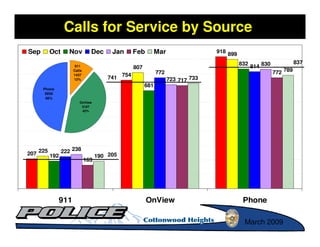
This document contains statistics and charts summarizing police data from March 2009 including: - Calls for service by source were highest from phone calls followed by on-view and 911 calls. - Priority 1 calls accounted for the most calls for service. - Most incidents occurred in District 4 followed by District 1. - Traffic crashes increased in March with most occurring on Fridays. - Citations were highest on Fridays and Saturdays with most for moving violations. - Investigations cleared the most cases involving theft and made several arrests. - A stolen vehicle was recovered leading to two felony arrests.

Recommended
Recommended
More Related Content
What's hot
Viewers also liked
Similar to March 2009 Crime Statistics
Similar to March 2009 Crime Statistics (12)
More from Cottonwood Heights Neighborhood Watch
More from Cottonwood Heights Neighborhood Watch (8)
Recently uploaded
Recently uploaded (20)
March 2009 Crime Statistics
- 1. Calls for Service by Source Sep Oct Nov Dec Jan Feb Mar 918 899 832 837 911 807 814 830 Calls 772 772 789 741 754 1437 12% 723 717 733 681 Phone 5856 46% OnView 5187 42% 207 225 222 238 192 190 205 163 911 OnView Phone March 2009
- 2. Calls for Service by Priority 600 Priority 1: Life Threatening, In Progress Sep Oct Nov Dec Jan Feb Mar Priority 2: Non-Life Threatening, In Progress Priority 3: Bad Checks, Child Abuse, PO Violation, Veh Theft 522 Priority 4: Criminal Misch, Civil Prob, Fraud, Runaway, Missing Pers 509 Priority 5: Found/Lost Property, Property Damage 500 491 Priority 6-9: Parking, Impounds, Follow Up 459 444 426 400 390 387 388 341 334 319 321 325 300 230 215 212 200 198 195 200 200 183 174 163 151 155160 151151 136133 134 128128 120 100 0 1 2 3 4 5+ Traffic Stops and Offenses Removed March 2009
- 3. Calls for Service Response Time Traffic Stops and Offenses Removed Sep Oct Nov Dec Jan Feb Mar 14:59 1 930 13:09 5+ 10% 12:43 12:33 2414 12:03 12:05 11:59 11:58 26% 11:16 11:31 2 3241 4 35% 9:31 1246 9:19 3 9:08 9:11 9:01 9:15 14% 8:34 8:23 1341 8:18 8:19 15% 7:23 5:52 5:53 5:26 5:24 5:20 4:58 4:50 1 2 3 4 March 2009
- 4. Calls for Service Thresholds 2000 Sep Oct Nov Dec Jan Feb Mar 1950 1931 1900 1879 High 1850 1808 1800 1791 Average 1750 1705 1712 Low 1700 1652 1650 1600 1550 1500 March 2009
- 5. Calls for Service Projection Mar Sep 1712 1879 14% 16% Feb 1652 Oct 13% 1931 15% Jan Nov 1791 Dec 1705 14% 14% 1808 14% Monthly Yearly Low 1690 20,280 Average 1782 21,384 High 1875 22,500 March 2009
- 6. Calls for Service by Date & Time 2147 1768 1815 1769 1790 1691 1501 Sun M on Tue Wed Thu Fri Sat 754 761 764 721 674 670 680 668 619 632 594 588 575 581 476 504 492 420 358 256 201 162 147 184 0 1 2 3 4 5 6 7 8 9 10 11 12 13 14 15 16 17 18 19 20 21 22 23 March 2009
- 7. Offenses Known to Police 100 Sep Oct Nov Dec Jan Feb Mar 90 92 90 81 80 78 78 34 70 25 22 23 21 59 60 15 55 12 50 40 Domestic Violence 30 21 18 18 19 20 17 14 13 12 13 13 11 12 10 10 10 10 5 5 2 3 2 2 3 1 0 0 0 0 1 0 1 0 1 2 0 0 0 Rape Robbery Assault Burglary Theft Stolen Auto March 2009
- 8. Incident Comparisons UCR Category 6 Month Average March Difference Assault 13 21 68% Burglary 15 19 29.5 Disorderly 19 20 6.2 Drugs 13 12 -6.5% Drunkenness 6 9 58.8% DUI 16 10 -38.8% DV 18 18 0 Fraud 21 24 16.1% Liquor Laws 9 9 2.3% Robbery 2 0 n/c Sex Offenses 5 9 74.2% Stolen Property 2 3 100% Suspicious 18 12 -34.5% Theft 87 65 -25% Vandalism 12 11 -5.7% Weapons 2 4 122% March 2009
- 9. Incidents by District Sep Oct Nov Dec Jan Feb Mar 251 CH4 238 664 234 CH1 17% 216 1492 38% 194 CH3 1016 176 180 26% 166 164 CH2 157 148 747 143 132 19% 131 123 116 116 108 105 106 100 101 95 90 86 86 77 68 District 1 District 2 District 3 District 4 March 2009
- 10. Incidents by District March 2009
- 11. District 1 Incidents March 2009
- 12. District 2 Incidents March 2009
- 13. District 3 Incidents March 2009
- 14. District 4 Incidents March 2009
- 15. Traffic Crashes by Injury Sep Oct Nov Dec Jan Feb Mar 104 Injury 141 25% 79 Prop Only 429 58 57 75% 51 42 38 32 19 22 20 21 15 12 Property Injury March 2009
- 16. Weather & Traffic Crashes 120 25 Crashes Rain Snow 100 20 80 15 60 10 40 5 20 0 0 Sep Oct Nov Dec Jan Feb Mar March 2009
- 17. Traffic Crashes by Date/Time 106 86 86 90 81 70 51 Sun Mon Tue Wed Thu Fri Sat 49 49 46 43 44 36 36 38 34 33 26 26 27 21 15 15 8 6 8 3 5 1 0 1 0 1 2 3 4 5 6 7 8 9 10 11 12 13 14 15 16 17 18 19 20 21 22 23 March 2009
- 18. Citations Sep Oct Nov Dec Jan Feb Mar 242 248 238 Warn 207 197 37% 187 Move 63% 154 153 141 132 125 116 102 104 106 95 90 85 81 79 70 Other Warning Moving March 2009
- 19. Citations by Date/Time 645 534 447 458 415 395 368 Sun Mon Tue Wed Thu Fri Sat 283 243 217 207 207 194 161 161 147 141 141 140 143 125 134 118 109 114 102 58 44 29 21 22 0 1 2 3 4 5 6 7 8 9 10 11 12 13 14 15 16 17 18 19 20 21 22 23 March 2009
- 20. Citation & Crash Ratio 400 Citations* Crashes 140 350 120 300 100 Citations Crashes 250 80 200 60 150 100 40 50 20 0 0 Sep Oct Nov Dec Jan Feb Mar * = Citations do not include Misdemeanor or DV violations. March 2009
- 21. Citation & DUI Ratio 400 383 370 40 344 344 350 328 35 307 300 30 223 30 Citations 250 25 DUIs 200 20 150 19 19 18 21 15 100 15 10 50 10 5 0 0 Sep Oct Nov Dec Jan Feb Mar March 2009
- 22. Investigations Case Load Sep Oct Nov Dec Jan Feb Mar 36 25 23 22 21 18 17 16 16 16 15 15 15 14 14 14 13 13 13 13 12 12 11 11 11 10 9 8 6 4 3 3 3 3 2 Theft Burglary Forgery/Fraud Auto Theft Other March 2009
- 23. Investigations Case Load Sep Oct Nov Dec Jan Feb Mar 11 11 10 9 8 7 6 6 6 5 5 5 5 5 4 4 3 3 3 3 2 2 2 2 2 2 2 1 1 1 0 0 0 0 0 DV Sex Offenses Violent Crime Child Crimes Narcotics March 2009
- 24. Investigations Case Closures & Arrests 108 Total Cases 106 Clearances Arrests 94 87 86 77 81 72 59 51 51 37 35 31 29 23 23 17 20 15 9 Sep Oct Nov Dec Jan Feb Mar March 2009
- 25. Case Highlights Case 1 of 4: Stolen Vehicle Recovered on Pine View Drive. Description: Investigations discovered a stolen truck in CH. They watched the vehicle until the suspects re-entered. No chase ensued and the vehicle was found. Suspects were found in the neighborhood. Result: Two Felony Arrests. Moral: You can’t outrun radio waves. March 2009