New Jersey Ranks Second in Nation for Best Schools.pdf
Quakertown, North Penn achieve top area scores on state's School Performance Profile _ Local _ theintell
1. 10/27/2016 Quakertown, North Penn achieve top area scores on state's School Performance Profile | Local | theintell.com
http://www.theintell.com/news/local/quakertownnorthpennachievetopareascoresonstates/article_8a0590ea918011e6ab1bd3cce928696e.html 1/11
Home / News / LocalLocal
http://www.theintell.com/news/local/quakertown-north-penn-achieve-top-area-scores-on-state-s/article_8a0590ea-9180-11e6-ab1b-d3cce928696e.html
Quakertown, North Penn achieve top area scores on state's School Performance Pro韑�le
By Gary Weckselblatt, staff writer Oct 15, 2016
When Pennsylvania released its School Performance Pro le scores, Quakertown Community High School found itself not only among the rari ed air of
Bucks County's heavyweights, but atop them.
The high school's score of 97.6 is the best among all schools in Bucks, followed by Central Bucks East High School (95.8) and Council Rock North High
School (93.3), and New Hope-Solebury High School (92.8).
"We used to compare ourselves to the state," Quakertown Community High School Principal David Finnerty said. Now, he said, the school is comparing
itself to the Central Bucks and New Hope-Solebury school districts — "the best of the best."
The Pennsylvania School Performance Pro le, released Thursday, is another way for the state to measure school improvement. Using a 100-point scale, the
performance pro le is based mainly on standardized test scores, such as the Pennsylvania System of School Assessment and the Keystone Exams, and on
academic growth. It also factors in items like graduation rates and attendance. Schools with students who did well on state, industry and Advanced
Placement exams can earn extra credit to take a score above the 100-point scale, according to the state.
North Penn (100.3) and Wissahickon Senior (100.8) high schools in Montgomery County are two of only ve schools in the state to have scored greater than
100 points on the performance pro le. In Montgomery County, North Penn was followed by Upper Moreland High School and the Souderton Charter
School Collaborative, each tied with 92.9.
Other top scores were turned in by Central Bucks' Pine Run Elementary School (92.5), New Hope-Solebury Lower Elementary School (91.4), Pennsbury
High School (91.3), North Penn's York Avenue Elementary School (91.2), Bucks County Montessori Charter School (91.1) and Council Rock South High
School (91.1).
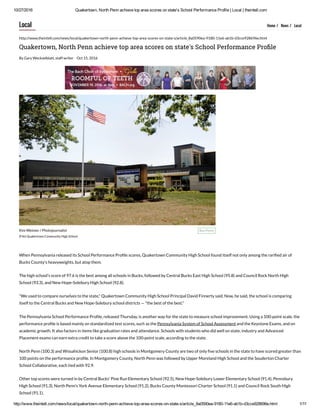
Buy PhotoKim Weimer / Photojournalist
(File) Quakertown Community High School
2. 10/27/2016 Quakertown, North Penn achieve top area scores on state's School Performance Profile | Local | theintell.com
http://www.theintell.com/news/local/quakertownnorthpennachievetopareascoresonstates/article_8a0590ea918011e6ab1bd3cce928696e.html 2/11
Last year, because the PSSAs were aligned to the state's version of the more rigorous Common Core standards, school performance pro les were not
compiled. State of cials anticipate that over time, as students adapt to a new curriculum, their performance will grow.
In Quakertown, of cials were excited with the high school's achievement, especially considering the district's larger percentage of economically
disadvantaged students in comparison to other high-performing districts.
Only 3.6 percent of Central Bucks East's students are labeled "economically disadvantaged," according to state Department of Education data, while 7.5
percent of Council Rock North students and 8.5 percent of New Hope-Solebury High School students are also on the low end. Quakertown Community
High School, however, has nearly 29 percent of its student population in that category.
"It says that our students are over-performing and I'm very proud of them," Finnerty said.
William Harner, Quakertown's superintendent, said: "Comparing a New Hope-Solebury and a Central Bucks to some of the other districts is not a fair
comparison. We aspire to out-perform them. We certainly have greater challenges. Every school, every district, every teacher has different challenges.
However, when poverty is an issue, you have more challenges.
"Everything is different depending on geography, depending on ZIP code."
Matthew Stem, Pennsylvania's deputy secretary for elementary and secondary education, explained that research shows "there's always a correlation
between students' economic status and achievement scores. When districts are able to break the trend and see students growing at high levels, it shows
what can be accomplished when the right supports are in place."
North Penn High School (28 percent of enrollment) and Upper Moreland High School (35 percent of enrollment) are also challenged by a signi cant number
of economically disadvantaged students, yet North Penn achieved among the state's best scores in the performance pro le and Upper Moreland wasn't far
behind.
"We only compare ourselves to our own standards," said North Penn Superintendent Curt Dietrich, who added that district graduates "are well-prepared to
go into society and achieve gainful employment and become leaders. We want to inspire our students to reach their full potential."
He said the district constantly monitors student achievement data from tests developed by its own teachers. "We don't wait until we simply get a report
from the state," he said.
Robert Milrod, Upper Moreland's superintendent, said his district has implemented a standards-based curriculum so that students "have similar
experiences from one teacher to another and one classroom to another."
His students, he said, consistently show improvement from one year to the next. "We don't have bifurcated distribution," he said. "We're taking all of our
students, whether rich or poor, with a common, consistent curriculum and raising them up all together."
Lower-performing schools tend to have higher percentages of economically disadvantaged students. Bristol Township, for example, has a dozen schools,
each with a student body of at least 60 percent economically disadvantaged.
Clara Barton Elementary School in Bristol Township scored a 49.3 on the School Performance Pro le, Bucks County's lowest, while the school district's
Maple Shade Elementary earned 75.5, an approximately mid-range score.
"We have pockets where students have shown really good growth over one and two years," said Melanie Gehrens, the district's superintendent. "Some
schools have really good PTOs. Parent involvement with the students really helps."
Gehrens said the district has used a Keystone Opportunity Grant to hire instructional coaches to work with teachers "to make sure everybody's getting the
same curriculum. There's been a lot of hard work on the teachers' part.
"I don't believe the test scores represent what's going on in our schools," the superintendent said. "It doesn't represent how hard our students and our
teachers are working. Despite the numbers we have great things happening."
Stem, the state's deputy secretary of education, said parents should "exercise caution" in any inferences made by performance pro le scores. "They're a
snapshot in time," he said. "For a school whose SPP score is not as high doesn't necessarily signal directly that there's something happening with the quality
of teaching and learning. There could be good things happening. It might just take more time to further align the instruction."
3. 10/27/2016 Quakertown, North Penn achieve top area scores on state's School Performance Profile | Local | theintell.com
http://www.theintell.com/news/local/quakertownnorthpennachievetopareascoresonstates/article_8a0590ea918011e6ab1bd3cce928696e.html 3/11
Morrisville Intermediate School (50.2) and Centennial's two middle schools — Klinger (54.9) and Log College (50.7) — were among the area's bottom ve
performance pro le scores.
"We're very disappointed with how our scores came out," Centennial Superintendent David Baugh said. "We obviouly have a lot of work to do. We are doing
an analysis of the situation and expect to deliver better results next year."
In many districts, middle schools were the lowest performers. Stem said it has to do with the shift in 2013 to a new set of standards that weren't tested by
the state until last year.
He said that third-graders who began to receive the new curriculum in kindergarten or rst grade "have less gaps to ll" than today's eighth-graders.
Pennsylvania Virtual Charter School in King of Prussia (49.7) was the area's second lowest-performing school. Center for Student Learning Charter School
at Pennsbury also had a low score (57.5), and was among the bottom-10 scoring schools in Bucks and Montgomery counties.
Bucks and Montgomery counties 2015-2016 SPP Scores
Factored into the Pennsylvania Department of Education’s calculation of the score are a school’s state assessment and college-readiness test results, its ability to close so-called achievement gaps, its
attendance and graduation rates and the number of rigorous courses offered.
BUCKS COUNTY SPP Score
Bensalem Township School District
Bensalem Township High School 69.4
Cecelia Snyder Middle 63.4
Robert K. Shafer Middle 64.3
Belmont Hills Elementary 57.9
Benjamin Rush Elementary 64.3
Cornwells Elementary 69.4
Russell C. Struble Elementary 68.8
Samuel K. Faust Elementary 59
Valley Elementary 59.8
Bristol Borough School District
Bristol High School 56.7
Warren Snyder-John Girotti Middle 64.9
Warren Snyder-John Girotti Elementary 69.7
Bristol Township School District
Harry S. Truman High School 67
Neil A. Armstrong Middle 61.5
Franklin D. Roosevelt Middle 56.1
Clara Barton Elementary 49.3
James Buchanan Elementary 57.5
Mary Devine Elementary 66.7
Ralph Waldo Emerson Elementary 68.2
John Fitch Elementary 54.9
Lafayette Elementary 58.6
Abraham Lincoln Elementary 65.6
4. 10/27/2016 Quakertown, North Penn achieve top area scores on state's School Performance Profile | Local | theintell.com
http://www.theintell.com/news/local/quakertownnorthpennachievetopareascoresonstates/article_8a0590ea918011e6ab1bd3cce928696e.html 4/11
BUCKS COUNTY SPP Score
Maple Shade Elementary 75.5
George Washington Elementary 53.4
Bucks County Montessori Charter
Bucks County Montessori Charter 91.1
Bucks County Technical High School
Bucks County Technical High School 75.7
Centennial School District
William Tennent High School 64.8
Eugene Klinger Middle 54.9
Log College Middle 50.7
Davis Elementary 82.5
McDonald Elementary 62.6
Willow Dale Elementary 63.7
Central Bucks School District
Central Bucks High School-East 95.8
Central Bucks High School-South 90.1
Central Bucks High School-West 79.5
Holicong Middle 71.3
Lenape Middle 72
Tamanend Middle 75.2
Tohickon Middle 69.9
Unami Middle 65.3
Barclay Elementary 69.1
Bridge Valley Elementary 88.6
Buckingham Elementary 87.5
Butler Elementary 90.8
Cold Spring Elementary 90.1
Doyle Elementary 85.5
Gayman Elementary 82.9
Groveland Elementary 86.7
Jamison Elementary 88.5
Kutz Elementary 80.9
Linden Elementary 83.5
Mill Creek Elementary 78
Pine Run Elementary 92.5
Titus Elementary 80.4
5. 10/27/2016 Quakertown, North Penn achieve top area scores on state's School Performance Profile | Local | theintell.com
http://www.theintell.com/news/local/quakertownnorthpennachievetopareascoresonstates/article_8a0590ea918011e6ab1bd3cce928696e.html 5/11
BUCKS COUNTY SPP Score
Warwick Elementary 87.7
Council Rock School District
Council Rock High School North 93.3
Council Rock High School South 91.1
Holland Middle 70.8
Newtown Middle 72.3
Richboro Middle 72.8
Churchville Elementary 65.3
Goodnoe Elementary 85.4
Hillcrest Elementary 87.2
Holland Elementary 76.9
Maureen M. Welch Elementary 70
Newtown Elementary 81.1
Richboro Elementary 69.3
Rolling Hills Elementary 75.9
Sol Feinstone Elementary 79.9
Wrightstown Elementary 82.3
Morrisville School District
Morrisville High School 70.9
Morrisville Intermediate 50.2
Grandview Elementary 66.7
Neshaminy School District
Neshaminy High School 88.1
Maple Point Middle 59
Poquessing Middle 76.3
Carl Sandburg Middle 70.1
Pearl S. Buck Elementary 79.3
Oliver Heckman Elementary 77.3
Herbert Hoover Elementary 74.2
Joseph E. Ferderbar Elementary 73.9
Lower Southampton Elementary 80.4
Walter Miller Elementary 74.9
Albert Schweitzer Elementary 69.8
New Hope-Solebury School District
New Hope-Solebury High School 92.8
New Hope-Solebury Middle 86.3
6. 10/27/2016 Quakertown, North Penn achieve top area scores on state's School Performance Profile | Local | theintell.com
http://www.theintell.com/news/local/quakertownnorthpennachievetopareascoresonstates/article_8a0590ea918011e6ab1bd3cce928696e.html 6/11
BUCKS COUNTY SPP Score
New Hope-Solebury Lower Elementary 91.4
New Hope-Solebury Upper Elementary 89.6
Palisades School District
Palisades High School 90.9
Palisades Middle 61.8
Durham-Nockamixon Elementary 71.8
Spring eld Elementary 62.1
Tinicum Elementary 83.1
Pennridge School District
Pennridge High School 76.7
Pennridge Central Middle 74.6
Pennridge North Middle 65.8
Pennridge South Middle 65.5
Bedminster Elementary 81.3
R.B. Deibler Elementary 82.1
J.M. Grasse Elementary 82.8
Patricia A. Guth Elementary 78.3
Sellersville Elementary 73
M.M. Seylar Elementary 78.3
West Rockhill Elementary 85.6
Pennsbury School District
Pennsbury High School 91.3
Charles H. Boehm Middle 76.4
Pennwood Middle 68
William Penn Middle 76.8
Afton Elementary 84.2
Edgewood Elementary 75.1
Eleanor Roosevelt Elementary 65.7
Fallsington Elementary 78.9
Make eld Elementary 68.8
Manor Elementary 78.2
Oxford Valley Elementary 78.6
Penn Valley Elementary 67.8
Quarry Hill Elementary 85.9
Walt Disney Elementary 74.4
Center for Student Learning CS at Pennsbury
7. 10/27/2016 Quakertown, North Penn achieve top area scores on state's School Performance Profile | Local | theintell.com
http://www.theintell.com/news/local/quakertownnorthpennachievetopareascoresonstates/article_8a0590ea918011e6ab1bd3cce928696e.html 7/11
BUCKS COUNTY SPP Score
Center for Student Learning CS at Pennsbury 57.5
Quakertown Community School District
Quakertown Community High School 97.6
Milford Middle 71.6
Strayer Middle 60.7
Neidig Elementary 72.6
Pfaff Elementary 77.6
Quakertown Elementary 69.8
Richland Elementary 75.8
Tohickon Valley Elementary 64.6
Trumbauersville Elementary 73.7
School Lane Charter
School Lane Charter 83.9
MONTGOMERY COUNTY
Abington School District
Abington Senior High 92.5
Abington Junior High 64.6
Copper Beech 79.9
Highland 82.9
McKinley 77.2
Overlook 85.5
Roslyn 81.1
Rydal East 82.8
Willow Hill 76.9
Cheltenham School District
Cheltenham High School 78.2
Cedarbrook Middle 65.8
Cheltenham Elementary 72.2
Elkins Park 60
Glenside Elementary 77.5
Myers Elementary 68.2
Wyncote Elementary 75
Hatboro-Horsham School District
Hatboro-Horsham High School 74.7
Keith Valley Middle 70.2
Blair Mill Elementary 74.2
8. 10/27/2016 Quakertown, North Penn achieve top area scores on state's School Performance Profile | Local | theintell.com
http://www.theintell.com/news/local/quakertownnorthpennachievetopareascoresonstates/article_8a0590ea918011e6ab1bd3cce928696e.html 8/11
BUCKS COUNTY SPP Score
Crooked Billet Elementary 85.6
Hallowell Elementary 70.9
Pennypack Elementary 68.1
Simmons Elementary 84.7
Jenkintown School District
Jenkintown Middle/High School 81.3
Jenkintown Elementary 75.6
Lower Moreland Township School District
Lower Moreland High School 89.3
Murray Avenue 73.9
Pine Road Elementary 73.6
North Penn School District
North Penn High School 100.3
Pennbrook Middle 82.2
Penndale Middle 57.9
Penn eld Middle 72.9
Bridle Path Elementary 80.7
General Nash Elementary 90.3
Gwynedd Square Elementary 86.2
Gwyn-Nor Elementary 67.7
Hat eld Elementary 68.5
Inglewood Elementary 83.8
Knapp Elementary 71.4
Kulp Elementary 67.3
Montgomery Elementary 84.7
North Wales Elementary 86.7
Oak Park Elementary 70.5
Walton Farm Elementary 71.3
York Avenue Elementary 91.2
Pennsylvania Virtual Charter
Pennsylvania Virtual Charter 49.7
Souderton Area School District
Souderton Area High School 89.9
Indian Crest Middle 57
Indian Valley Middle 65.7
E.M. Crouthamel Elementary 69.8
9. 10/27/2016 Quakertown, North Penn achieve top area scores on state's School Performance Profile | Local | theintell.com
http://www.theintell.com/news/local/quakertownnorthpennachievetopareascoresonstates/article_8a0590ea918011e6ab1bd3cce928696e.html 9/11
BUCKS COUNTY SPP Score
Franconia Elementary 77.4
Oak Ridge Elementary 76.6
Salford Hills Elementary 85.9
Vern eld Elementary 84.9
West Broad Street Elementary 65.5
Souderton Charter School Collaborative
Souderton Charter School Collaborative 92.9
Spring eld Township School District
Spring eld Township High School 92
Spring eld Township Middle 81.7
En eld Elementary 79.4
Erdenheim Elementary 81.1
Upper Dublin School District
Upper Dublin High School 88.1
Sandy Run Middle 61.8
Fort Washington Elementary 72.3
Jarrettown Elementary 78.7
Maple Glen Elementary 80.3
Thomas Fitzwater Elementary 87.8
Upper Moreland Township School District
Upper Moreland High School 92.9
Upper Moreland Intermediate 80.8
Upper Moreland Middle 74
Wissahickon School District
Wissahickon High School 100.8
Wissahickon Middle 77.2
Blue Bell Elementary 76.9
Lower Gwynedd Elementary 84.9
Shady Grove Elementary 77.9
Stony Creek Elementary 91
Enjoying this series? Become a Intelligencer subscriber to support stories like these. Get full access to our signature journalism for just 33 cents a day.
Gary Weckselblatt: 215-345-3169; email: gweckselblatt@calkins.com; Twitter: @gweckselblatt
MORE INFORMATION