SlideShare uma empresa Scribd logo
1 de 32
Baixar para ler offline
GEMS: Latin America Brazil
Transport
30 October 2006
Localiza
Reuters: RENT3.SA Bloomberg: RENT3 BZ Exchange: SAO Ticker: RENT3
Pedal to the metal: initiating
with a Buy
Bernardo Carneiro, CFA
Research Analyst
(+55) 11 51895975
bernardo.carneiro@db.com
Dan McGoey, CFA
Research Analyst
(+1) 212 250 2818
dan.mcgoey@db.com
Initiating coverage with a Buy; total return potential of 50%
We are initiating coverage of Localiza, the largest car rental company in Latin
America, with a Buy rating and a R$74.20 PT for 2007 year-end. In our opinion,
favorable industry prospects, superior management execution and a high growth
profile mean an unjustified valuation discount to transportation companies in DB's
universe of coverage.
Forecasts and ratios
Year End Dec 31 2005A 2006E 2007E 2008E
Revenue (BRLm) 877 1,110 1,521 1,935
EBITDA (BRLm) 278 333 483 621
EBITDA margin (%) 31.7 30.0 31.8 32.1
EBIT (BRLm) 235 275 395 518
Net Income (BRLm) 107 154 238 334
EPS (BRL) 1.68 2.29 3.55 4.97
P/E (x) 10.5 22.0 14.2 10.2
(BRL) 0.66 0.91 1.40 1.96
Dividend yield (%) 3.7 1.8 2.8 3.9
EV/EBITDA (x) 5.3 10.8 7.3 5.7
Source: Deutsche Bank estimates, company data
Deutsche Bank AG/London
All prices are those current at the end of the previous trading session unless otherwise indicated. Prices are sourced from
local exchanges via Reuters, Bloomberg and other vendors. Data is sourced from Deutsche Bank and subject companies.
Deutsche Bank does and seeks to do business with companies covered in its research reports. Thus, investors should
be aware that the firm may have a conflict of interest that could affect the objectivity of this report.
Investors should consider this report as only a single factor in making their investment decision.
Independent, third-party research (IR) on certain companies covered by DBSI's research is available to customers of
DBSI in the United States at no cost. Customers can access this IR at http://gm.db.com, or call 1-877-208-6300 to
request that a copy of the IR be sent to them.
DISCLOSURES AND ANALYST CERTIFICATIONS ARE LOCATED IN APPENDIX 1
Initiation of Coverage
Buy
Price at 26 Oct 2006 (BRL) 50.50
Target price 74.20
52-week range 52.80 - 19.00
Price/price relative
0
50
100
150
200
250
300
5/05 11/05 5/06
0
10
20
30
40
50
60
Rel. to BOVESPA (L.H. Scale)
Localiza (R.H. Scale)
Performance (%) 1m 3m 12m
Absolute 11.7 14.8 165.8
BOVESPA 10.7 8.3 33.3
Stock data
Market cap (USDm) 1,588.2
Shares outstanding (m) 67.2
ADR ratio 1.0
Free float (%) 50
Volume 118,567
BOVESPA 39,645
Exchange rate (BRL/USD} 2.14
Key indicators
ROE (%) 29.5
ROA (%) 15.5
Net debt/equity (%) 77.8
Book value/share (BRL) 9.67
Price/book (x) 5.2
Net interest cover (x) 4.5
EBIT margin (%) 24.8
Company
ResearchCompanyFocus
Strong sequential results show earnings momentum
Localiza has been delivering strong earnings growth and solid results sequentially
since its IPO in May 2005. We project that it will continue to enjoy high and
sustainable earnings growth. Our CAGRs for net revenues, EBITDA and EPS for
the 2006-2009 period are 28%, 31% and 38%, respectively, in R$.
Growth is everywhere
The Brazilian car rental market has reported more than five times GDP growth,
backed by catalysts such as expansion of tourism activities in the country,
increasing passenger traffic in airports, development of the car insurance
(replacement) market and the growing trend of fleet outsourcing by corporations.
Valuation and risks: our DCF-based price target is R$74.20
We assume a WACC of 10.9%, a beta of 0.9, a risk-free rate of 8% and a country
risk premium of 300 bps over U.S. Treasuries. We used a 13.0% cost of debt after
taxes and a terminal growth rate of 4% for FCF’s. Localiza is also cheap on a peer
valuation basis, as it is trading at a P/E 07E of 14.2x, implying a PEG of ratio of 0.5x
(versus an average of 0.8x in our sample). Risks to our investment thesis include
enhanced competition, macroeconomic shocks, contract termination at Total
Fleet, decline in passenger flow in airports and decline in the price of used cars.
Please see pages 3 and 14 for further detail on valuation methodology and risks.
30 October 2006 Transport Localiza
Page 2 Deutsche Bank AG/London
Model updated: 24 October 2006 Year Ending 31 December 2005 2006E 2007E 2008E
INCOME STATEMENT (BRL m)
Sales revenue 877 1,110 1,521 1,935
Operating EBITDA 278 333 483 621
Depreciation 43 58 88 102
Amortisation 0 0 0 0
EBIT 235 275 395 518
Net interest income(expense) -84 -62 -64 -54
Associates/affiliates 0 0 0 0
Investment/other income(expense) 0 0 0 0
Exceptionals/extraordinaries 0 0 0 0
Income tax expense 44 59 93 130
Minorities/preference dividends 0 0 0 0
Net income 107 154 238 334
CASH FLOW (BRL m)
Cash flow from operations -191 -20 194 59
Movement in net working capital -341 -236 -132 -378
Capex -28 -29 -30 -31
Free cash flow -219 -48 164 28
Other investing activities 0 0 0 0
+55-11-51895975 Equity raised(bought back) 0 150 0 0
Dividends paid -42 -61 -94 -132
Net inc(dec) in borrowings 203 -88 350 0
+1 212 250 2818 Other financing cash flows 0 0 0 0
Total cash flows from financing 161 1 256 -132
Net cash flow -59 -48 420 -104
Movement in net debt(cash) 261 -41 -70 104
BALANCE SHEET (BRL m)
Cash and other liquid assets 71 23 443 339
Tangible fixed assets 50 70 86 98
Goodwill 0 0 0 0
Other intangible assets 0 0 0 0
Associates/investments 195 299 313 381
Other assets 854 1,091 1,171 1,421
Total assets 1,170 1,484 2,014 2,239
Interest bearing debt 610 529 879 879
Other liabilities 165 304 340 362
Total liabilities 775 834 1,219 1,242
Shareholders' equity 394 650 794 996
Minorities 0 0 1 1
Total shareholders' equity 395 650 795 997
Net working capital 712 840 887 1,116
Net debt(cash) 539 506 436 540
Capital 934 1,156 1,231 1,537
RATIO ANALYSIS
Sales growth (%) na 26.5 37.1 27.2
Op. EBITDA/sales (%) 31.7 30.0 31.8 32.1
EBIT/sales (%) 26.8 24.8 26.0 26.8
Payout ratio (%) 39.5 39.5 39.5 39.5
52-week Range: BRL 19.00 - 52.80 ROE (%) 27.0 29.5 33.0 37.3
Market Cap (m) BRL 3,395 Return on Capital (%) 17.8 19.0 23.8 26.9
USD 1,588 Operating Return on Capital (%) 22.5 24.9 32.1 36.0
Capex/sales (%) 3.2 2.6 2.0 1.6
Company identifiers Capex/depreciation (x) 0.7 0.5 0.3 0.3
Cusip NA Net debt/equity (%) 136.6 77.8 54.9 54.2
SEDOL B08K3S0 Net interest cover (x) 2.8 4.5 6.2 9.6
Source: Company data, Deutsche Bank estimates
2.0 4.2 3.8 3.1
6.2 13.1 8.9 6.9
5.3 10.8 7.3 5.7
1.67 3.25 2.31 1.84
1,469 3,602 3,518 3,555
1,123 3,395 3,395 3,395
63.3 67.2 67.2 67.2
4.59 5.22 4.27 3.41
6.23 9.67 11.81 14.82
3.7 1.8 2.8 3.9
0.66 0.91 1.40 1.96
nm nm 17.5 58.0
-3.46 -0.72 2.44 0.42
-3.02 -0.29 2.89 0.87
10.5 22.0 14.2 10.2
1.68 2.29 3.55 4.97
na 36.4 54.6 40.1
10.5 22.0 14.2 10.2
1.68 2.29 3.55 4.97
Average market cap (BRL m)
Price as of 26 October
Target price
BRL 50.50
BRL 74.20
Weighted average shares (m)
Price/BV (x)
Buy BV/Share (BRL)
EV/Operating Capital
Company website
http://www.localiza.com
Company description
EV/Sales
EV/EBITDA
EV/EBIT
Enterprise value (BRL m)
DPS (BRL)
Operating CFPS (BRL)
EPS FD (BRL)
Dividend Yield (%)
Free CFPS (BRL)
P/E ratio FD (x)
P/CFPS (x)Localiza
SUMMARY
P/E ratio Headline (x)
Headline EPS growth (%)
Research Team
Localiza is the largest car rental company in Latin
America, with a network of 322 branches in nine
countries and a car fleet of 43,000 vehicles. The
company operates in four synergetic business
segments which are car rental, fleet rental and fleet
management, franchising and used car sales.
Localiza is listed in the Novo Mercado classification
of the Bovespa, which grants shareholders the
highest standards of corporate governance and
minority shareholder protection in Brazil
Running the Numbers
Headline EPS (BRL)
GEM
Brazil
Transport
Reuters: RENT3.SA Bloomberg: RENT3 BZ
bernardo.carneiro@db.com
Bernardo Carneiro
Dan McGoey, CFA
dan.mcgoey@db.com
Price and Price Relative
10
15
20
25
30
35
40
45
50
55
60
10/01 10/02 10/03 10/04 10/05 10/06
0
50
100
150
200
250
300
350
Localiza (L.H.S.)
Rel. to BOVESPA (R.H.S.)
Absolute Price Return (%)
12%
13%
166%
0% 50% 100% 150% 200%
1m
3m
12m
Margin Trends (%)
0
5
10
15
20
25
30
35
40
05 06E 07E 08E
Sales growth (%)
Op. EBITDA/sales (%)
Return Ratios (%)
0
5
10
15
20
25
30
35
40
05 06E 07E 08E
ROE (%)
Return on Capital (%)
Operating Return on Capital (%)
Net Debt (Cash) / Equity (%)
0
100
200
300
400
500
600
05 06E 07E 08E
0
20
40
60
80
100
120
140
160
Net Debt / Cash (BRL m)
Net debt/equity (%)
30 October 2006 Transport Localiza
Deutsche Bank AG/London Page 3
Investment thesis
Outlook
We are initiating coverage on Localiza with a Buy rating and R$74.20 target price per share
(2007 year-end), implying 50% total return potential (including dividends) from current levels.
In our view, Localiza is a high-growth story fueled by state-of-the-art execution and favorable
industry prospects. Localiza holds important competitive advantages such as its extensive
experience in renting cars, strong bargaining power with automakers when purchasing cars, a
skilled management and large country footprint in terms of branches and brand reputation.
We estimate that the company will continue to enjoy high and sustainable earnings growth in
the next three years. Our CAGRs for net revenues, EBITDA and EPS for the 2006-2009 period
are 28%, 31% and 39%, respectively, in local currency terms. These growth rates compare
favorably with anticipated earnings growth for the transportation companies in our universe
of coverage.
Valuation
Our DCF valuation is based on a WACC of 10.9% as the discount rate for the FCFFs (free
cash flows to firm), a beta of 0.9, a risk-free rate of 8% and a country risk premium of 300
bps over U.S. Treasuries. We used a 13.0% cost of debt after taxes (103% of the CDI
forecast for 2007) and a perpetuity growth rate of 4% for FCFFs.
On a comparative valuation basis, Localiza is trading at a discount of ~35% to domestic
players in the transportation sector considering its PEG ratio – price to earnings growth – of
0.5 times (calculated with P/E 07E and 2007-2010 EPS CAGR). We think the company should
trade at a 0.8x PEG ratio, meaning that it deserves a 20% discount to the 1.0x PEG
benchmark to reflect the stock’s poor liquidity. If we had chosen this approach for our
valuation, the 0.8x PEG 2007E would have implied a target P/E 07E of 23.0x and a fair value
per share of R$81.30, which is higher than our DCF-derived price target of R$74.20.
Risks
Notable risks to our investment thesis are:
The strong competitive environment requires aggressive marketing efforts and
subsidized rental rates;
Macroeconomic risks (potential increases in interest rates and GDP contraction) affecting
the demand for car rentals and increasing cost of funding;
Risks of contract termination by customers of the fleet rental unit;
Potential declines in the passenger flow in airports (motivated by GDP contraction,
terrorism, etc.) which account for 50% of the revenues in the car rental unit;
Potential declines in the prices of used cars in the secondary market could lead to a
deterioration of free cash flow.
A high-growth story fueled
by state-of-the-art execution
and favorable industry
prospects
30 October 2006 Transport Localiza
Page 4 Deutsche Bank AG/London
Table of Contents
Company overview............................................................................ 5
Background...............................................................................................................................5
Management & shareholders....................................................................................................5
Business units...........................................................................................................................6
Industry background ....................................................................... 10
The very beginning..................................................................................................................10
Competitive environment........................................................................................................10
Growth is everywhere.............................................................................................................11
Valuation and rating........................................................................ 15
DCF valuation..........................................................................................................................15
Peer valuation .........................................................................................................................15
Risks .......................................................................................................................................16
Earnings outlook.............................................................................. 17
Accounting issues...................................................................................................................17
Earnings scenario....................................................................................................................17
Business model sensitivity......................................................................................................20
30 October 2006 Transport Localiza
Deutsche Bank AG/London Page 5
Company overview
Background
Localiza was founded in 1973 by Salim Mattar, since then its chairman and CEO. It is now the
largest car rental company in Latin America, with a network of 322 branches in nine countries
and a car fleet of 43,000 vehicles. The company operates in four synergetic business
segments – car rental, fleet rental and fleet management, franchising and used car sales.
Business car rentals account for 75% of total rentals, comprising corporate employees and
wealthy individuals.
The stock is listed in the Novo Mercado classification of the Bovespa, which grants
shareholders the highest standards of corporate governance and minority shareholder
protection in Brazil (i.e., 100% of tag-along rights and only voting stock listed). Since 1997,
when private equity investors acquired a strategic stake in the company, management has
been developing a close relationship with the capital markets and the analyst community.
In May 2005, the company held its IPO in a US$100 million deal with the sale of existing
shares by the controlling shareholders. In April 2006 it concluded a follow-on offer of R$450
million, when the free float reached 50% from 38% previously. Since the IPO the stock has
had a stellar performance, appreciating by 350% in local currency compared to 62% by the
Ibovespa.
Management & shareholders
Localiza’s executive officers comprise the founders and one independent professional, the
CFO, who has been with the company for more than 20 years. There has been no turnover
so far in the top management, which is a strong message of commitment and loyalty to the
employees. In addition to the regular salaries, everyone in the company receives variable
compensation, which is tied to the targets accomplished and distributed as profit-sharing.
Senior management is also granted stock options, distributed in a period of four years at a
maximum of 3% of outstanding shares in the period. Management is promptly accessible
and has so far developed an active investor relations department demonstrating alignment
between majority and minority shareholders and providing fair disclosure of results.
Figure 1: Localiza – Shareholder Structure
Antonio
Claudio
Resende
15%
Free Float
50%
SalimMattar
15%
Flavio
Resende
10%
Eugenio
Mattar
10%
Source: Deutsche Bank, Company data
30 October 2006 Transport Localiza
Page 6 Deutsche Bank AG/London
The Board of Directors is formed of nine people, of whom three are independent
professionals including the former president of Banco do Brasil and former executive
directors of investment banks.
Figure 2: Localiza – Corporate Structure
Localiza
Franchising Total Fleet
Prime
(Seminovos)
Franchising
Brasil
Car rental
Rental
International
LFI
(Argentina)
92.5% 92.5% 100%
95%
100% 100% 100%
Source: Deutsche Bank, Company data
Business units
Localiza’s consolidated operations are split into four business units complementing each
other and generating operating synergies. The company’s large-scale and integrated platform
enable it to provide high-quality services at low costs while minimizing working capital
commitment in the car acquisition business.
Car rental
The car rental unit, which uses the same brand as the consolidated corporation (Localiza), is
the largest car rental company in Brazil by number of branches. It is highly recognized for its
service quality and geographical reach. The unit operates in four different market niches,
which are individuals, travel industry, corporate or mini-lease and replacement (car insurance).
Because of its major presence in popular tourist locales, the company’s focus is on renting
cars to wealthy individuals during vacation periods as well as renting cars to businessmen in
the busiest cities. In 2005, the ten largest corporate customers accounted for 10% of the
unit’s rentals while the largest accounted for 2.7% of the total.
Most of the cars rented consist of the so-called popular models, which are simple vehicles
having no major features such as electronic appliances or automatic gears. The most rented
cars are the Palio (Fiat), Celta (GM) and Corsa (GM), which also have the lowest rental rates.
The average age of the fleet ranges from five to seven months.
Yield management
Localiza makes use of a complex yield management technique similar to the one employed
by airlines in Brazil, as well as a regional pricing policy. Depending on the demand for car
rentals and the utilization rate of the fleet in a single branch, it can adjust rental rates to create
demand in that particular location, considering the day of the week, city, event, etc.
A key input in determining rental rates is the estimated sale price of the used cars, based on
extensive research by Seminovos, the used car seller. If the secondary market of used cars
deteriorates – car prices drop more than what is anticipated by management – Seminovos
will generate lower cash flow in selling the used cars, translating into higher depreciation
expenses. This can be offset by higher rental rates charged by Localiza in the branches.
Therefore, rental rates determination takes into account the prospects for the other units in a
consolidated approach, using inputs such as average age of car fleet, utilization rates and
expected resale price of the used cars, as well the competitive environment per region.
30 October 2006 Transport Localiza
Deutsche Bank AG/London Page 7
In order to retain customers and maintain brand reputation, Localiza offers customers a
loyalty program that grants them free rental after accumulating R$3,000 of rentals
(approximately US$1,350). The gift leverages the car rental business as customers usually
pay for additional rentals when granted one for free. The membership program has close to
1.0 million customers registered and their profile, including a digital photo of their driver’s
license, can be accessed online in real time from any of the 322 branches in Latin America. In
2005, roughly 43% of the car rental revenues came from members of the loyalty program.
Customers book reservations by phone, through travel agencies (crucial in the tourism
segment) or over the internet (roughly 300,000 visitors each month) and enjoy a free 24-hour
assistance call center.
It is worth highlighting Localiza’s corporate culture of “spectacular customer service” which
extracts the best service from its employees. The company does not hire outside
professionals that previously worked for other rental car companies – it aims to shape the
workforce in its own way, making it easier for culture dissemination.
Figure 3: Localiza – Revenue Breakdown (2005A) Figure 4: Localiza – EBITDA Breakdown (2005A)
Franchising
1%
Used cars
sales
51%
Car rental
31%
Fleet rental
17%
Franchising
1%
Used cars
sales
14%
Car rental
49%
Fleet rental
36%
Source: Deutsche Bank, Company data Source: Deutsche Bank, Company data
Used car sales
The purchase and sale of cars is done by Seminovos (meaning “almost new”) and used car
sales represent roughly 50% of the consolidated revenues. However, this is not a core
business for the consolidated company (it contributes less than 15% of EBITDA) but rather a
crucial and complementary operation. Localiza’s focus is on renting out new and modern cars
to its customers in order to improve its brand and quality reputation, minimize maintenance
costs and maximize the market value of the fleet when selling the used cars (thus limiting
depreciation costs).
Unlike the U.S., automakers do not provide buyback guarantees to car rental companies in
Brazil, leaving them exposed to fluctuations in the market of used cars. Car prices are set
according to an extensive research of the used car market in the main Brazilian cities and also
take into consideration the operating (the sales structure comprising 15 Seminovos stores)
and financial expenses that accrue on short-term loans taken to fund the purchase of cars.
The company used to offset part of these expenses collecting referral fees from banks and
financial agents recommended to finance customers at the stores (the unit never financed
customers itself in order to circumvent balance sheet exposure). Recently, this situation
changed as Seminovos set up a financial agreement with Banco do Brasil last September
offering it exclusive rights in financing customers in exchange for a share of the financial
monthly spread charged over car sales.
30 October 2006 Transport Localiza
Page 8 Deutsche Bank AG/London
In order to maintain a mix of new cars in the fleet, Seminovos is frequently turning over
approximately 80% of the 43,000 vehicles rented by Localiza and Total Fleet, maintaining the
average age of the fleet at 12 months (the remaining 20% of the fleet is sold through
independent car dealers). The sizeable consolidated car fleet and the high number of car
rental branches grant Localiza a strong bargaining power with automakers (it is the largest car
purchaser in Brazil, accounting for approximately 2% of the market), and therefore it gets
attractive discounts when buying brand new cars. In 2005, the unit purchased 30,879 cars
and we believe that it enjoys roughly 25% off the list prices of vehicles sold by GM,
Volkswagen, Ford and Fiat in the country.
Customers of Seminovos can explore cars over the Seminovos website and sort them by
type, color, year of launch, price, etc., and even choose available financing plans, consulting
installments, interest rates, etc.
Fleet rental
The rising trend of outsourcing fleet and fleet management services by large and mid-sized
companies has fueled the growth of Total Fleet, Localiza’s unit for fleet rental and fleet
management. The unit rents approximately 12,500 cars to roughly 270 companies, out of
which 31 accounted for 60% of rentals generated in 2005 (the ten largest ones accounted for
38% of the total rental). The customer base is thus very concentrated when compared to
Localiza’s car rental operation. In order to protect it from early termination of contracts, the
unit charges customers penalties of 10% to 50% of payments due.
Total Fleet has a very low fixed cost structure operating through a central unit and few
employees, using intensive technology. Out of the 1,845 employees as of December 2005,
fewer than 7% were allocated in the unit. This unit rents cars in accordance to the specifics
of the clients and for middle to long-term periods (average term of three years). The average
age of the fleet, as of 3Q06, was 14.4 months. The tailor-made contracts allow Total Fleet to
obtain high margins and cross-sell other products such as the short-term fleet contracts
operated by Localiza. Corporate customers can order any sort of vehicle, from the popular
GMs to BMWs and as many as they want. The unit is the most profitable of Localiza’s units,
with an EBITDA margin of 69% in the January to September 2006 period.
The market for fleet rental is growing as companies concentrate on their core business and
let third-party companies provide car services. According to Total Fleet, the potential market
for fleet rentals constitutes 150,000 cars that could be rented out to large and solid financial
corporations (it is the market leader in Brazil with roughly 8% market share only). This market,
as opposed to car rental, is not as sensitive to GDP fluctuations as contracts between the
unit and the client are long-term and rental rates are less flexible.
The large footprint in Brazil has also enabled Total Fleet to expand market share and retain
customers as it satisfies customer needs due to its wide geographical presence and
assistance. Localiza’s branches, spread across the country, can provide Total Fleet with cars
and vice-versa, depending on the availability of cars parked in the branches, i.e., the utilization
ratio of the fleet.
Premium customer service
Total Fleet has developed a premium service and state-of-the-art technologies to handle all
sorts of needs or problems experienced by its customers. For instance, the unit has online
access to a wide range of parts vendors and independent towing services registered in its
database which can repair car damages or failures no matter where the car is located at the
time of the incident. The damages are photographed and digitally filed so that Total Fleet can
follow up remotely and monitor the quality of the service executed. Customers can also
approve budgets through the Total Fleet website and request consulting for fleet rentals.
30 October 2006 Transport Localiza
Deutsche Bank AG/London Page 9
Franchising
One of the pillars for the growth of the company has been its franchising operation. The
footprint expansion through franchisees enabled Localiza, back in 1983, to cheaply reinforce
its brand and provide car rental services in locations that are less in demand and/or more
risky, such as in rural areas and other countries. Franchisees share Localiza’s know-how,
training, marketing material and bargaining power with automakers if they choose to
purchase cars together with the company. However, Seminovos does not sell cars previously
operated by the franchisees. The franchised branches share the same database and online
system as the other branches in an integrated platform.
In exchange for Localiza’s corporate support, the franchisees usually pay 6% of revenues to
the company as regular fees. Depending on the investment returns achieved by the
franchisees, the company may opt for the acquisition of these branches (a practice that has
been significantly accretive to earnings). As of June 2006, out of the 322 branches, 195 were
operated by franchisees.
Geographical presence
In Brazil, Localiza has a diversified geographical reach, ranging from busy cities to small
vacation areas visited by wealthy tourists. Aside from Brazil, Localiza is present in eight other
countries in Latin America, including Mexico, Chile and Argentina. All its international
operations are run by franchisees, in order to keep top management’s focus on Brazil (where
it believes it has significant growth opportunities); this also means that the franchisees are
left to analyze, and learn about, these markets and at the same time bear the burden of start-
up-related risks. In the past two years Localiza has expanded into the Brazilian countryside
where new airports are being built and where the economic activity is picking up, such as in
the agribusiness and energy sectors.
Figure 5: Localiza – Branch Distribution
Source: Deutsche Bank, Company data
Financial profile
Localiza is a solid company financially, with average to below-average leverage. Almost all of
its debt is local currency-denominated and linked to floating rates, the CDI; therefore, the
current downward trend in local interest rates should trigger an improvement in the
company’s financial results. With the follow-on offer of April 2006, Localiza’s net debt to
equity dropped to 0.6x as of September from 1.4x in December 2005, reaching a solid
financial position. Moreover, the car fleet represents most of its total assets (approximately
70%) and is characterized by high liquidity, and Localiza can promptly sell cars in the event of
financial distress.
30 October 2006 Transport Localiza
Page 10 Deutsche Bank AG/London
Industry background
The very beginning
The car rental industry in Brazil dates back to as early as the 1950s. Initially, businessmen in
the city of São Paulo rented cars as a complement to their used car sales activity. The
entrance of large international companies into the local market compelled some of them to
focus on a nascent industry, full-time car rental, raising the bar of quality services. In the
1970s the companies managed to take loans from leasing companies and could therefore
renew their car fleet, which led to an expansion of the market. Through the years until the
1980s, the companies got bigger and spread into the country, reaching important tourist
destinations. The franchising of car rental branches was crucial to this expansion.
In the ‘90s, Brazil experienced a significant opening of its economy to imported goods and
the expansion of its consumer market with the decline of inflation due to the introduction of
the Plano Real. Massive imports of cars and other vehicles changed the shape of the car
manufacturing industry in the country, fueled by the introduction of the economical popular
cars (cheap cars with one-liter engines). In 2004, these cars represented 70% of the car fleet
held by rental companies in Brazil, while luxury cars accounted for just 6%, based on data
provided by ABLA (the National Association of Car Rental companies).
Competitive environment
The car rental industry in Brazil is very competitive and less concentrated compared to
developed countries. The five largest companies have only 33% of the market in Brazil, as
opposed to 59% market share in Europe and 92% in U.S. The local market is very
fragmented with close to 1,900 car rental companies, the majority of them comprising very
small companies with dozens of cars in their fleet, compared to 43,000 held by Localiza.
Most of them (44% of the total) are located in the southeast region, according to ABLA.
The reasons for such a fragmented market can be found in the sequential economic crisis
and volatile interest rates observed in the late ‘90s, which compressed demand and limited
GDP growth, factors that stimulated price competition on the one hand and lowered the
quality of services on the other. Accordingly, there are hundreds of companies that can only
compete by charging low rental rates and therefore their cash flow generation is not enough
to renew their car fleet, leaving them with old cars demanding significant maintenance costs.
The improved macroeconomic scenario and real income recovery observed in the past three
years have made customers less price-sensitive and shifted demand to higher-quality car
rental companies such as Localiza.
Since 1981 Localiza has been the market leader in Brazil by number of branches and in 2005
it held 18% of market share in the country, according to ABLA. Hertz, Unidas (owned by the
Portuguese SAG group) and Avis (run by a master franchisee of Avis Europe) are Localiza’s
major competitors, but they have lower scale and smaller footprint. The companies have
become bigger and have increased their relevance to the Brazilian car manufacturing industry.
For instance, in 2000, the size of the total fleet in the car rental industry was equivalent to
5.5% of all the cars manufactured and that increased to 11.3% in 2004.
30 October 2006 Transport Localiza
Deutsche Bank AG/London Page 11
Figure 6: Car Rental Industry, Branch network in Brazil (September 2006)
267
84 83 74 66
42
25 20 15 11
0
50
100
150
200
250
300
Localiza
Hertz
Avis
Unidas
Yes
Master
Locaralpha
Europcar
Interlocadora
Sixt
Source: Deutsche Bank, Company data
As in the case of Localiza and its subsidiary Total Fleet, most of the other rental car
companies in Brazil also operate in the fleet rental and management businesses, in order to
achieve synergies. The largest ones in that segment are Total Fleet, Unidas and Leaseplan.
Figure 7: Market-Share In Brazil (Including Fleet Rental Revenues), 2004
others
69%
Unidas
7%
Localiza
16%
Avis
4%
Hertz
4%
Source: Deutsche Bank, Company data
The fast expansion of their businesses and the high profits accumulated attracted the
attention of their parent companies. At the end of 2005, Ford sold Hertz in the U.S. to a group
of private equity firms, which could be followed by a more aggressive international
expansion. In September 2006 Unidas replaced its CEO and issued R$100 million in a private
placement aiming to expand car fleet and open new branches. We should also mention the
recent entrance of highly capitalized foreign players in the country such as the French ALD
Automotive (subsidiary of the Societe Generale group) and Arval (linked to BNP Paribas),
which aim to operate in the fleet rental business.
Growth is everywhere
Despite fierce competition, the car rental industry in Brazil is still in its early stages and enjoys
numerous growth opportunities, as opposed to Europe and the U.S where the industry has
already reached maturity (companies are struggling due to the impact of September 11 on
tourism, and high debt burden). Recently, the Brazilian car rental market has registered more
than five times GDP growth, backed by catalysts such as the expansion of tourism activities
in the country, increasing passenger traffic in airports, development of the car insurance
(replacement) market and the growing trend of fleet outsourcing by corporations. According
to ABLA, from 2000 to 2005 the car rental market revenues increased by 12% per year
compared to a 2.2% increase in GDP.
30 October 2006 Transport Localiza
Page 12 Deutsche Bank AG/London
General economic factors, including the expansion in credit card penetration and the
improvement in household income among Brazilians, have also contributed to such
outstanding industry performance. In the past three years, the number of credit cards in the
country increased 18% per year to 68 million. The ownership of a credit card is mandatory for
renting cars from Localiza.
Airport traffic booming
Close to 45% of Localiza’s daily rentals, excluding Total Fleet, are generated in airports,
where not only tourists but also businessmen arrive and demand car services. The company
is present in more than 70 airports in Brazil, including the busiest ones such as Congonhas
and Guarulhos in São Paulo, and Santos Dumont and Galeão in Rio de Janeiro.
The concessions for car rental companies are granted by Infraero (Federal Agency Airport
Administration) for federal airports, and by the state and municipal authorities with regard to
state and municipal airports. The concessions usually last from five to 15 years and are
subject to new bidding after expiration. Localiza has renewed its concessions in the major
and strategic airports for its business.
In the last five years Brazil has experienced a boom in passenger traffic in airports due to a
combination of factors on the demand side (real income recovery and expansion in credit
alternatives) and from supply (promotions, aggressive marketing, modernization of aircraft,
reforms in the airports, etc.). Data from Infraero shows that the flow of passengers in local
airports has increased at an average annual rate of 7% from 2000 to 2005, more than 3.0
times the GDP growth in the period.
Figure 8: Passenger Flow In Brazilian Airports (million)
68
74 75
71
83
96
40
50
60
70
80
90
100
2000
2001
2002
2003
2004
2005
Source: Deutsche Bank, Company data
Consolidation trend
Localiza’s strategy is to consolidate the sector not through acquisitions but through
aggressive pricing, deep pockets and geographical expansion. It has been using its highly
capitalized structure, easy access to capital markets and strong refinancing capabilities to
constantly renovate its car fleet. The consolidation is also aided by Localiza’s strategy in the
corporate segment where it negotiates short-term rentals with corporations (the so-called
“mini-lease” contracts), which usually rent cars for a few months. The company charges
them competitive rental rates without affecting margins as cars remain rented for long
periods of time, which raises utilization rate of fleet, dilutes fixed costs and maximizes the
use of its assets. Rental rates in the car rental unit have dropped in the past few years in
nominal terms as a consequence of the market-share expansion in the corporate segment.
30 October 2006 Transport Localiza
Deutsche Bank AG/London Page 13
Figure 9: Evolution Of Car Rental Companies In Brazil
2,451 2,511
2,340
1,985 1,964
1,000
1,400
1,800
2,200
2,600
3,000
2001 2002 2003 2004 2005
Source: Deutsche Bank, ABLA
According to management, acquisitions do not necessarily add to growth as Localiza is
already present in the premium locations in the country; so acquiring branches would not be
complementary. The acquisition of branches would apparently increase its market share in
the airports but because of regulatory concerns Localiza would have to return the acquired
slots for new bidding processes (no car rental player can have two slots in any airport in
Brazil). Furthermore, given that Localiza purchases new cars at substantial discounts, the
company has no interest in acquiring the car fleet held by competitors.
In view of the informal characteristics of most car rental companies, their small size, lower
quality car fleet and inability to raise capital, we believe Localiza should continue to
consolidate the market and expand market-share in Brazil.
Replacement market on the rise
The replacement market of insured cars and automakers is a fast-growing niche for car rental
companies in Brazil. Insurance companies are becoming more professional and broadening
the range of products while improving the quality of services. Recently, more companies
have addressed the car insurance market by offering an emergency car to those drivers who
have suffered accidents and have had their cars impaired. According to management, given
that 16.5% of the 9.2 million insured cars in Brazil crash or are stolen every year and taking
into account that the average period for repairing a car is seven days, we calculate that the
replacement market in Brazil for car rentals reaches 10.6 million daily rentals. The current
market is still 1.0 million rentals as large insurance companies do not yet offer emergency
cars to their clients.
Localiza has approximately 30% of the replacement market, and based on our estimates, we
think that the recent decision of Bradesco to offer the extra car in new insurance contracts
and the potential entrance of other large car insurers could rapidly raise that market to 3
million daily rentals by mid-2007. Localiza could earn 600,000 additional car rentals in the next
year if we conservatively maintain its market share (please refer to Figure 10). If the company
maintains its car fleet, the impact on the utilization rate would be an increase of 800 bps.
The replacement market of car rentals is also growing due to the demand from automakers.
Car manufacturers have increasingly offered an extra car to their customers as part of special
warranties clauses, which is a direct effect of higher competition in the industry and
improved professional standards.
30 October 2006 Transport Localiza
Page 14 Deutsche Bank AG/London
Figure 10: Localiza – Impact Of Bradesco Seguros On The Replacement Market*
Status quo Bradesco entrance
Current market 1,000 Additional market 2,000
Localiza's share 30% Localiza's share 30%
Localiza's rentals 300 Localiza's rentals 900
Total rentals 2007E 6,421 Total rentals 2007E 7,021
% of the total 5% % of the total 13%
YoY growth 35% YoY growth 48%
Utilization rate 70% Utilization rate 78%
Source: Deutsche Bank *000’s rentals
30 October 2006 Transport Localiza
Deutsche Bank AG/London Page 15
Valuation and rating
DCF valuation
Our 2007 year-end price target of R$74.20 was derived from a DCF valuation. Given its
attractive upside potential of 47% (plus dividend yield) versus the 10% threshold in DB’s
rating criteria and the favorable peer multiple comparison, we are initiating coverage on
Localiza with a Buy rating.
Our DCF valuation is based on a WACC of 10.9% as the discount rate for the FCFFs (free
cash flows to firm), a risk-free rate of 8%, a sovereign risk spread of 300 bps and a cost of
debt of 13.0% (103% of the CDI expected for 2007). We used a 4% perpetuity growth rate.
Figure 11: Price target Sensitivity With Discount Rate And Perpetuity Growth
WACCg 2.0% 3.0% 4.0% 5.0% 6.0%
9.9% 70.73 78.85 89.73 105.07 128.30
10.4% 65.37 72.27 81.33 93.75 111.84
10.9% 60.64 66.55 74.17 84.38 98.78
11.4% 56.43 61.53 68.00 76.51 88.17
11.9% 52.67 57.09 62.64 69.80 79.39
Source: Deutsche Bank
Peer valuation
Localiza is the only car rental company listed in Latin America. We believe that its business
model and earnings drivers are similar to other transportation players in Latin America which
enjoy high GDP leverage and strong elasticity to real income and consumption growth.
Therefore, we compared its trading multiples with companies in the transportation sector in
our universe of coverage in Latin America. Considering their differences in growth prospects
and industry stages, it is important to factor earnings growth into the valuation comps.
Accordingly, we believe Localiza deserves superior valuations to account for its higher
earnings and EBITDA growth anticipated for the next three years.
Figure 12: Valuation Comparison In Latam Transportation
Market Cap EV/EBITDA P/E EPS CAGR PEG
Company Name Ticker Target Price Close Price USD Upside 2006 2007 2006 2007 07-10E ratio
Gol GOL.N 35.20 31.45 6,210.6 12% 10.1 7.1 14.4 11.9 15% 0.81
TAM TAM.N 34.80 31.19 4,683.0 12% 8.7 6.5 12.4 10.5 16% 0.68
ASUR ASR.N 42.00 39.25 1,182.8 7% 9.3 8.1 25.3 19.3 23% 0.86
CCR CCRO3.SA 20.00 22.46 4,234.6 -11% 8.3 7.4 18.5 15.3 18% 0.83
Localiza RENT3.SA 74.20 50.50 1,588.1 47% 10.8 7.3 22.0 14.2 29% 0.49
Source: Deutsche Bank estimates
30 October 2006 Transport Localiza
Page 16 Deutsche Bank AG/London
Risks
Notable risks to our investment thesis are:
The strong competitive environment: This requires aggressive marketing efforts and
subsidized rental rates, which could depress margins and hold back price increases. The
recent arrival of large foreign players in the fleet rental business or a more aggressive
stance by international competitors in the local market could translate into lower
profitability levels.
Macroeconomic risks: Potential increases in interest rates and/or GDP contraction could
affect the demand for car rentals and increase Localiza’s cost of funding. If the Brazilian
economy slows down followed by lower consumer confidence then demand for car
rentals would fall, affecting the industry. In addition, since most of the company’s debt is
denominated in local currency and exposed to floating rates, an eventual increase in
interest rates would intensify Localiza’s debt burden and reduce earnings growth.
Risks of contract termination by customers of the fleet rental unit: Since Total Fleet
has a high client concentration, one or a few of its clients could choose to terminate their
contracts. Although Total Fleet would likely collect fines on amounts due, it might not be
able to replace them with new customers and therefore end up registering lower rentals,
revenues and lower utilization rates.
Potential declines in the passenger flow in airports: The branches located in airports
account for approximately 45% of the revenues in the car rental unit. GDP contraction,
terrorism, etc. could impair the demand for flights in Brazil and therefore reduce the flow
of people in the airports, which in turn would lower the amount of Localiza rentals in the
airports.
Potential declines in the prices of used cars in the secondary market: Localiza,
through its subsidiary Seminovos, relies on the secondary market of used cars to sell its
fleet and therefore recover the cash spent on car acquisition, an ongoing activity. If the
prices of used cars fall below Localiza’s estimates, then it would raise less cash than
anticipated and would not have enough cash to fund the purchases of new cars. As a
result, consolidated free cash flow would deteriorate.
30 October 2006 Transport Localiza
Deutsche Bank AG/London Page 17
Earnings outlook
Accounting issues
As previously mentioned, the car rental industry is capital-intensive and is characterized by
large working capital requirements, particularly in the purchase of new cars. Localiza has
frequently raised debt to fund its operations, as operating free cash flow has been negative
several times in the past. In U.S. GAAP, on which we base our estimates, the car fleet is
neither treated as inventories nor as fixed assets, but is accounted as short- and long-term
assets instead. Given the high liquidity of these assets, we opted to build our model
considering them as part of the regular working capital, backed by the fact that they are
constantly sold in order to raise proceeds to fund the purchase of new cars.
The investment in fleet renewal is significant and consumes most of the EBITDA generated
by the company. From a cash flow perspective, it is worth pointing out that 70% of
consolidated costs are a non-cash item (the depreciated book value of the used cars).
Accordingly, when calculating free cash flow one has to add back the costs associated with
car sales to the EBITDA when subtracting it from the capital expenditure for car fleet
expansion. The same rationale is applied to margin analysis, i.e., margin analysis for Localiza
is only meaningful on a unit per unit basis given the accounting issues of buying and selling
cars by Seminovos, which distorts the figures regardless of the efficiency of the car rental
operation.
Figure 13: Localiza – Breakdown Of COGS (2005A)
Franchising
1%
Fleet rental
7%
Rental costs
19%
Depreciated
used cars
69%
Taxes on
sales
4%
Source: Deutsche Bank, Company data
Earnings scenario
We estimate that the company will continue to enjoy high and sustainable earnings growth in
the next three years given the favorable industry outlook, its competitive advantages
(management, scale and brand) and growth drivers. Our CAGRs for net revenues, EBITDA
and EPS for the 2006-2009 period are 28%, 31% and 39%, respectively, in local currency
terms. These growth rates compare favorably to anticipated earnings growth for the
transportation companies in our universe of coverage:
30 October 2006 Transport Localiza
Page 18 Deutsche Bank AG/London
Figure 14: Operating Statistics In Latam Transportation (US$)
Sales EBITDA EPS EBITDA margin % ROE%
Company Name Ticker CAGR 05-08E CAGR 05-08E CAGR 05-08E 2006E 2007E 2008E 2006E 2007E 2008E
Gol GOL.N 43% 55% 42% 29.6 29.8 31.5 39.3 31.4 26.2
TAM TAM.N 22% 37% 39% 18.5 19.9 20.5 77.8 49.0 38.0
ASUR ASR.N 13% 12% 17% 56.9 56.3 59.7 3.9 5.0 6.4
CCR CCRO3.SA 13% 17% 16% 57.5 59.5 60.5 40.7 47.2 51.4
Average 23% 30% 28% 40.6 41.4 43.0 40.4 33.1 30.5
Localiza RENT3.SA 33% 33% 46% 30.0 31.8 32.1 31.4 30.6 33.2
Source: Deutsche Bank estimates
Our earnings outlook for Localiza starts with the forecast of daily rentals, for both the car
rental and the fleet rental units, bearing in mind the elasticity between the growth in rentals
to GDP and the favorable prospects for the sector we highlighted in the “Industry outlook”
section.
High leverage to GDP
We think that Localiza’s car rental unit will continue to increase rentals by 7-9 times the GDP
growth expected for the next three years while the fleet rental division generates growth at
3-5 times the rate of GDP. We then estimate the utilization rate of car fleet, raising it from
66% in 2006 (100 bps above current guidance) to 70% in 2007 and 72% thereafter for
Localiza while maintaining a stable 97% utilization rate for Total Fleet. Therefore, we calculate
the amount of cars required every year to generate these daily rentals which in turn lead to
the annual investment in car fleet (working capital needs).
We believe in higher future utilization rates, as in the past Localiza has reported abnormally
low rates due to non-recurring events (the flex fuel car boom in Brazil and substantial new
launches from automakers) which made it very attractive for Localiza to purchase new cars.
The demand for car rentals collapsed in 2003 due to the Brazilian economic crisis and hike in
interest rates, reducing the utilization rate versus 2002.
Figure 15: Localiza – Car Fleet Evolution Figure 16: Net Investment In Car Purchases (R$ million)
58.8%
66.0%
72.0%72.0%72.0%
70.0%
60.6%
62.9%
67.4%
0
10,000
20,000
30,000
40,000
50,000
60,000
2002 2003 2004 2005 2006E 2007E 2008E 2009E 2010E
40%
45%
50%
55%
60%
65%
70%
75%
Fleet evolution (eop) Utilization rate
0
50
100
150
200
250
300
350
400
2002 2003 2004 2005 2006E 2007E 2008E 2009E 2010E
Source: Deutsche Bank, Company data Source: Deutsche Bank, Company data
In our scenario we welcomed management’s strategy to increase the utilization rate as it is
crucial, in our view, to free cash flow generation and higher asset utilization. We justify our
assumptions based on recent conversations with management and conference call guidance,
pointing to 1) an expansion of the used car sales store chain to increase Seminovos’ capacity
to sell cars and 2) the opening of more branches in the countryside leading to higher
efficiency in moving cars from branch to branch and renting them in locations with heated
demand. We assume that Localiza will completely renew its car fleet every year keeping the
average age of the cars at six months.
30 October 2006 Transport Localiza
Deutsche Bank AG/London Page 19
Localiza’s capital expenditure in PP&E is very low and represents roughly 6% of EBITDA,
consisting of the opening of branches, revamping existing ones, improving IT systems and
the opening of used car stores.
For the car rental business we estimate a total of 4.85 million daily rentals for 2006 and 6.43
million for 2007, which imply annual growth rates of 42% and 32%, respectively, for Localiza.
With regard to Total Fleet we estimate 27% and 18% growth in rentals for 2006 and 2007,
reaching 4.25 million rentals and 5.02 million rentals, respectively. In our earnings scenario
used car sales will represent 52% of consolidated net sales in 2009 versus 49% in 2006.
Figure 17: Localiza – Daily Rentals Evolution (000s) Figure 18: Localiza – Net Revenues Evolution (R$ Mn)
0
200
400
600
800
1,000
1,200
1,400
1,600
2003 2004 2005 2006E 2007E 2008E 2009E 2010E
Car rental Fleet rental Used car sales
Source: Deutsche Bank estimates, Company data Source: Deutsche Bank estimates, Company data
Figure 19: Localiza – EBITDA (R$ million) And EBITDA Margin (%)
31.8%30.0%
28.6%
33.1% 32.6% 32.1%
32.0% 32.4%
0
100
200
300
400
500
600
700
800
900
1,000
2003 2004 2005 2006E 2007E 2008E 2009E 2010E
0%
5%
10%
15%
20%
25%
30%
35%
40%
EBITDA EBITDA margin
Source: Deutsche Bank estimates, Company data
0
2,500
5,000
7,500
10,000
12,500
15,000
17,500
20,000
2002 2003 2004 2005 2006E 2007E 2008E 2009E 2010E
Localiza Total Fleet
CAGR = 11%
30 October 2006 Transport Localiza
Page 20 Deutsche Bank AG/London
Figure 20: Localiza – Revenue Model (R$ million)
2005 2006E 2007E 2008E 2009E 2010E
Car Rental 271.3 371.2 493.8 636.6 773.0 937.0
Rental rate (R$) 79.52 76.70 76.81 79.55 82.20 84.81
% change -3% -4% 0% 4% 3% 3%
Daily rentals (000's) 3,411.4 4,849.6 6,420.9 7,994.0 9,392.9 11,036.7
% YoY change 41% 42% 32% 25% 18% 18%
Fleet Rental 149.2 193.3 233.9 284.6 324.9 370.4
Rental rate (R$) 44.28 45.44 46.58 48.24 49.85 51.44
% change -2% 3% 3% 4% 3% 3%
Daily rentals (000's) 3,350.8 4,252.2 5,017.6 5,895.7 6,514.7 7,198.7
% YoY change 19% 27% 18% 18% 11% 11%
Fleet management - - - - - -
Car Sales - Localiza 369.9 410.1 633.1 814.3 1015.3 1233.2
Average price (R$ 000's) 23.05 25.37 27.02 27.94 28.86 29.75
% change 18% 10% 7% 3% 3% 3%
Cars sold 15,691 16,148 23,231 28,900 34,886 41,103
% change 47% 3% 44% 24% 21% 18%
Financial spread - - 5.4 6.9 8.5 10.2
Car Sales - Fleet 78.3 128.2 146.5 181.8 207.4 235.9
Average price (R$ 000's) 25.17 26.36 28.04 29.00 29.95 30.88
% change 45% 5% 6% 3% 3% 3%
Cars sold 3,072 4,839 5,223 6,269 6,923 7,640
% change -39% 58% 8% 20% 10% 10%
Franchising 8.2 9.6 13.8 17.8 21.6 26.2
% of car rental rev. 3% 3% 3% 3% 3% 3%
Net Revenues 876.9 1,109.6 1,521.1 1,935.1 2,342.2 2,802.8
Source: Deutsche Bank estimates and company data
Given the sharp reduction in average rental rates in the past three years (motivated by
product mix changes, market-share expansion and competitive pressures), we believe
nominal rates are close to reaching their trough. We thus estimate that Localiza will pass
inflation through to rental rates starting in 2007. We estimate Localiza to report a 2006-09E
CAGR of 28% in consolidated net sales in local currency. However, we forecast an EBITDA
CAGR of 31% over this period, via rising margins stemming not only from higher economies
of scale but also in particular from more profitable used car sales, which had atypical low
EBITDA margins in the 1H06.
Business model sensitivity
Localiza’s earnings, margins and cash flow are sensitive to the changes in the prices of used
cars, the utilization rate of fleet and local interest rates (cost of debt).
Seminovos has a low and volatile EBITDA margin because of the swings in the used car
market in Brazil. Depending on the launches by automakers, the exchange rate and inflation,
prices of used cars vary significantly. The low margin stems from the fact that used cars have
a low residual value after one year of usage due to decelerating depreciation rates (the higher
decline in value happens right after the purchase of a new car). Seminovos’ EBITDA margins
vary from 0% to 10% and can significantly affect consolidated margins depending on the
quantity of cars sold in a given period, which distorts the analysis of the company’s core
business margins (car rental operations).
30 October 2006 Transport Localiza
Deutsche Bank AG/London Page 21
The utilization rate of Localiza’s car fleet, or asset utilization, is in our opinion key for the
maximization of value to shareholders. If demand for car rentals is correctly estimated the
company will then renovate its car fleet sufficiently to increase rentals minimizing working
capital investment. However, if it overestimates demand, it will buy more cars than it needs,
leaving cars stuck in the branches without being rented. As a result, the utilization rate would
decline, assets would be impaired and operating cash flow consumed with unnecessary car
purchases.
Maximizing utilization rate, maximizing value to shareholders
In Figure 21, we can see that Localiza maximizes value when it maximizes the utilization rate
of fleet (keeping the fleet age constant, i.e, fleet turnover is unchanged). Since most of the
consolidated EBITDA is generated by the car rental unit, or from the sale of daily rentals, the
higher the utilization rate the more rents are sold. It is important to mention that utilization
rate has a cap, which is approximately 80% to 85%, higher than which some branches will
not have cars for their customers, leading to quality deterioration.
One could think that cash generation is also maximized through the minimization of
investments in car acquisition, i.e., reducing fleet turnover while maintaining the same
utilization rate of fleet. However, we believe this would be dangerous for the overall
business. Although working capital investment would fall, the age of fleet would increase,
leading to higher maintenance cost, lower quality of services, brand erosion and business
model weakness.
Figure 21: Sensitivity Of Price Target And Utilization Rate Scenarios (R$)
Utilization rate Age (months) PT
55% 6.0 $ 49.40
60% 6.0 $ 58.16
65% 6.0 $ 65.60
70% 6.0 $ 71.90
75% 6.0 $ 77.40
80% 6.0 $ 82.24
Source: Deutsche Bank estimates
Changes in interest rates are also crucial for Localiza’s business model. Most of the car
purchases are funded by short- and long-term local currency loans denominated in floating
rates (CDI), while recently, we acknowledge, the company has raised capital in the form of
equity increase. A large part of the company’s cash flow in 2004 and 2005 was financed by
debt increase which raised financial expenses and limited earnings growth. The sequential
cuts in interest rates by the Brazilian Central Bank have limited the financial burden for
Localiza but we cannot rule out the possibility of future turmoil in the economy leading to
interest rate hikes and lack of funding alternatives.
30 October 2006 Transport Localiza
Page 22 Deutsche Bank AG/London
Figure 22: Localiza – Income Statement (R$ million)
2004 2005 2006E 2007E 2008E 2009E 2010E
Net revenues 634.5 876.9 1,109.6 1,521.1 1,935.1 2,342.2 2,802.8
Cost of Goods Sold 364.0 511.3 673.4 916.1 1,159.6 1,404.8 1,669.8
Gross Profit 270.4 365.6 436.2 604.9 775.6 937.4 1,133.0
Gross Margin 42.6% 41.7% 39.3% 39.8% 40.1% 40.0% 40.4%
Total Operating Expenses 96.2 130.6 160.7 209.7 257.1 311.2 371.9
Sales Expenses 52.7 66.6 78.0 91.3 116.1 140.5 168.2
Administrative Expenses 20.2 21.0 24.8 30.4 38.7 46.8 56.1
Other Operating Expenses 23.4 43.0 57.9 88.0 102.3 123.8 147.7
Operating Income 174.2 235.0 275.4 395.3 518.5 626.2 761.1
Operating Margin 27.5% 26.8% 24.8% 26.0% 26.8% 26.7% 27.2%
Depreciation and
Amortization
23.4 43.0 57.9 88.0 102.3 123.8 147.7
EBITDA 197.6 285.8 333.4 483.3 620.8 750.0 908.8
EBITDA Margin 31.1% 32.6% 30.0% 31.8% 32.1% 32.0% 32.4%
Provisions
Net Financial Income (43.0) (84.4) (61.7) (63.7) (53.8) (56.2) (54.2)
Financial Income - 56.0 22.6 16.1 39.1 28.7 22.4
Financial Expenses 43.0 140.4 84.3 79.8 93.0 84.8 76.6
Equity Income - - - - - - -
Non-recurrent 0.2 0.2 0.0 - - - -
Goodwill Amortization -
Pre-Tax Income 131.4 150.8 213.7 331.6 464.7 570.1 706.9
Pre-Tax Margin 20.7% 17.2% 19.3% 21.8% 24.0% 24.3% 25.2%
Income Taxes (40.7) (44.2) (59.3) (92.8) (130.1) (159.6) (197.9)
Social Contribution -
Majority Net Income 90.7 106.6 154.5 238.7 334.6 410.5 509.0
Participations (0.1) (0.1)
Others - - (0.2) (0.3) (0.4) (0.7) (1.1)
Net Income 90.6 106.5 154.3 238.5 334.1 409.8 507.9
Net Margin 14.3% 12.1% 13.9% 15.7% 17.3% 17.5% 18.1%
EPS 1.47 1.68 2.29 3.55 4.97 6.09 7.55
Source: Deutsche Bank estimates and company data
30 October 2006 Transport Localiza
Deutsche Bank AG/London Page 23
Figure 23: Localiza – Balance Sheet (R$ million)
2004 2005 2006E 2007E 2008E 2009E 2010E
Cash and Equiv. 129.3 70.8 23.3 443.2 339.2 296.4 273.1
ST Vehicles 467.8 705.7 897.4 940.1 1,143.3 1,367.2 1,629.1
Accounts receivable 54.8 93.3 127.3 161.6 205.5 248.5 297.4
Other Current Assets 5.4 17.6 28.4 29.6 30.7 31.8 32.9
Current Assets 657.3 887.4 1,076.5 1,574.5 1,718.7 1,944.0 2,232.6
LT Vehicles 144.4 194.5 299.1 313.4 381.1 455.7 543.0
Gross PPE 24.0 50.2 85.0 115.3 145.9 176.6 207.2
Accumulated Depreciation - - 21.1 35.5 54.5 77.8 105.6
Net Fixed Assets 24.0 50.2 63.9 79.8 91.4 98.7 101.6
Other LT Assets 37.9 37.4 44.5 46.0 47.6 49.0 50.5
Total Assets 863.6 1,169.5 1,484.0 2,013.6 2,238.9 2,547.5 2,927.7
Short-term debt 343.5 116.9 158.8 263.8 263.8 263.8 263.8
Suppliers 58.8 39.4 123.1 135.2 130.5 158.4 191.9
Other Current Liabilities 104.0 65.7 90.0 109.4 132.9 161.6 196.4
Current Liabilities 506.3 221.9 371.9 508.3 527.2 583.8 652.1
Long term debt 3.0 493.3 370.5 615.5 615.5 615.5 615.5
Deferred Taxes 5.7 - - - - - -
Other LT Liabilities 55.1 59.6 91.4 95.0 98.8 102.2 105.8
LT Liabilities 63.7 552.9 461.9 710.5 714.3 717.7 721.3
Minority Interest 0.2 0.3 0.2 0.5 0.9 1.6 2.7
Shareholders Equity 293.4 394.5 650.0 794.3 996.4 1,244.3 1,551.6
Total Liabilities and Equity 863.6 1,169.5 1,484.0 2,013.6 2,238.9 2,547.5 2,927.7
Source: Deutsche Bank estimates and company data
Figure 24: Localiza – Cash Flow Statement (R$ million)
2004 2005 2006E 2007E 2008E 2009E 2010E
EBITDA 197.6 285.8 333.4 483.3 620.8 750.0 908.8
(-) Change in working capital (267.6) (396.2) (235.5) (132.3) (378.2) (384.5) (448.7)
(-) CAPEX (14.2) (28.0) (28.6) (30.3) (30.6) (30.6) (30.6)
(-) Taxes (27.8) (44.2) (59.3) (92.8) (130.1) (159.6) (197.9)
FREE CASH FLOW TO FIRM (112.1) (182.6) 9.9 227.8 81.8 175.2 231.5
(-) Net financial expenses (24.2) (92.3) (58.2) (63.7) (53.8) (56.2) (54.2)
(+) Increase in debt 159.2 217.0 (88.4) 350.0 - - -
FREE CASH FLOW TO
EQUITY
23.0 (57.9) (136.6) 514.1 28.0 119.1 177.3
(+) Subscription 16.0 15.4 150.1 - - - -
(-) Dividends (68.9) (16.0) (60.9) (94.2) (132.0) (161.9) (200.6)
CHANGE IN CASH POSITION (29.8) (58.6) (47.5) 419.9 (104.0) (42.8) (23.3)
Cash and equivalents 129.3 70.8 23.3 443.2 339.2 296.4 273.1
Source: Deutsche Bank estimates and company data
Mismatches between current share prices, our ratings, and DB's rating structure
At current levels, based on our existing 12-month price targets, two stocks mentioned in this
report have total return potential that falls outside the definitions of Deutsche Bank's Buy,
Hold, and Sell ratings. We cite the following reasons:
GOL: Total return potential is >10%, a mismatch with our Hold rating. We note high
volatility (three-month trading range of 21%).
CCR: Total return potential is <-10%, a mismatch with our Hold rating. We note high
volatility (three-month trading range of 21%).
30 October 2006 Transport Localiza
Page 24 Deutsche Bank AG/London
Appendix 1
Important Disclosures
Additional information available upon request
Disclosure checklist
Company Ticker Recent price* Disclosure
Localiza RENT3.SA 50.50 (BRL) 26 Oct 06 6
Gol GOL.N 31.69 (USD) 26 Oct 06 2,6
TAM TAM.N 30.95 (USD) 26 Oct 06 6
ASUR ASR.N 39.18 (USD) 26 Oct 06 2
*Prices are sourced from local exchanges via Reuters, Bloomberg and other vendors. Data is sourced from Deutsche Bank and subject companies.
Important Disclosures Required by U.S. Regulators
Disclosures marked with an asterisk may also be required by at least one jurisdiction in addition to the United States. See
“Important Disclosures Required by Non-US Regulators” and Explanatory Notes.
2. Deutsche Bank and/or its affiliate(s) makes a market in securities issued by this company.
6. Deutsche Bank and/or its affiliate(s) owns one percent or more of any class of common equity securities of this company
calculated under computational methods required by US law.
Important Disclosures Required by Non-U.S. Regulators
Please also refer to disclosures in the “Important Disclosures Required by US Regulators” and the Explanatory Notes.
2. Deutsche Bank and/or its affiliate(s) makes a market in securities issued by this company.
6. Deutsche Bank and/or its affiliate(s) owns one percent or more of any class of common equity securities of this company
calculated under computational methods required by US law.
For disclosures pertaining to recommendations or estimates made on securities other than the primary subject of this
research, please see the most recently published company report or visit our global disclosure look-up page on our
website at http://gm.db.com.
Analyst Certification
The views expressed in this report accurately reflect the personal views of the undersigned lead analyst(s) about the subject
issuer and the securities of the issuer. In addition, the undersigned lead analyst(s) has not and will not receive any
compensation for providing a specific recommendation or view in this report. Bernardo Carneiro
30 October 2006 Transport Localiza
Deutsche Bank AG/London Page 25
Historical recommendations and target price: Localiza (RENT3.SA)
(as of 10/26/2006)
0.00
10.00
20.00
30.00
40.00
50.00
60.00
May05 Aug05 Nov 05 Feb06 May06 Aug 06
Date
SecurityPrice
Previous Recommendations
Strong Buy
Buy
Market Perform
Underperform
Not Rated
Suspended Rating
Current Recommendations
Buy
Hold
Sell
Not Rated
Suspended Rating
*New Recommendation Structure
as of September 9, 2002
Historical recommendations and target price: Gol (GOL.N)
(as of 10/27/2006)
5
4
3
2
1
USD-
USD5.00
USD10.00
USD15.00
USD20.00
USD25.00
USD30.00
USD35.00
USD40.00
USD45.00
Oct 04 Jan05 Apr 05 Jul 05 Oct 05 Jan 06 Apr 06 Jul 06
Date
SecurityPrice
Previous Recommendations
Strong Buy
Buy
Market Perform
Underperform
Not Rated
Suspended Rating
Current Recommendations
Buy
Hold
Sell
Not Rated
Suspended Rating
*New Recommendation Structure
as of September 9, 2002
1. 28/2/2005: Buy, Target Price Change USD36.00
2. 2/11/2005: Buy, Target Price Change USD43.00
3. 2/12/2005: Buy, Target Price Change USD51.30
4. 20/12/2005: Downgrade to Hold, Target Price Change USD25.65
5. 26/4/2006: Hold, Target Price Change USD35.20
30 October 2006 Transport Localiza
Page 26 Deutsche Bank AG/London
Historical recommendations and target price: TAM (TAM.N)
(as of 10/27/2006)
2
1
USD-
USD5.00
USD10.00
USD15.00
USD20.00
USD25.00
USD30.00
USD35.00
USD40.00
Mar 06 Jun 06 Sep06
Date
SecurityPrice
Previous Recommendations
Strong Buy
Buy
Market Perform
Underperform
Not Rated
Suspended Rating
Current Recommendations
Buy
Hold
Sell
Not Rated
Suspended Rating
*New Recommendation Structure
as of September 9, 2002
1. 10/5/2006: Buy, Target Price Change USD32.14 2. 14/7/2006: Buy, Target Price Change USD34.80
Historical recommendations and target price: ASUR (ASR.N)
(as of 10/27/2006)
5
4
3
2
1
USD-
USD5.00
USD10.00
USD15.00
USD20.00
USD25.00
USD30.00
USD35.00
USD40.00
USD45.00
Oct 04 Jan05 Apr 05 Jul 05 Oct 05 Jan 06 Apr 06 Jul 06
Date
SecurityPrice
Previous Recommendations
Strong Buy
Buy
Market Perform
Underperform
Not Rated
Suspended Rating
Current Recommendations
Buy
Hold
Sell
Not Rated
Suspended Rating
*New Recommendation Structure
as of September 9, 2002
1. 12/1/2005: Buy, Target Price Change USD31.00
2. 21/4/2005: Buy, Target Price Change USD35.00
3. 26/7/2005: Downgrade to Hold, USD35.00
4. 25/10/2005: Hold, Target Price Change USD30.20
5. 6/4/2006: Upgrade to Buy, Target Price Change USD42.00
30 October 2006 Transport Localiza
Deutsche Bank AG/London Page 27
Equity rating key Equity rating dispersion and banking relationships
Buy: Expected total return (including dividends) of 10% or
more over a 12-month period.
Hold: Expected total return (including dividends) between -
10% and 10% over a 12-month period.
Sell: Expected total return (including dividends) of -10% or
worse over a 12-month period.
Notes:
1. Published research ratings may occasionally fall
outside these definitions, in which case additional
disclosure will be included in published research and on our
disclosure website (http://gm.db.com);
2. Newly issued research recommendations and target
prices always supersede previously published research.
8%
36%
57%
7%14%14%
0
100
200
300
400
Buy Hold Sell
Global Universe
Companies Covered Cos. w/ Banking Relationship
30 October 2006 Transport Localiza
Page 28 Deutsche Bank AG/London
Regulatory Disclosures
SOLAR Disclosure
For select companies, Deutsche Bank equity research analysts may identify shorter-term trade opportunities that are
consistent or inconsistent with Deutsche Bank's existing longer term ratings. This information is made available only to
Deutsche Bank clients, who may access it through the SOLAR stock list, which can be found at http://gm.db.com
Disclosures required by United States laws and regulations
See company-specific disclosures above for any of the following disclosures required for covered companies referred to in
this report: acting as a financial advisor, manager or co-manager in a pending transaction; 1% or other ownership;
compensation for certain services; types of client relationships; managed/comanaged public offerings in prior periods;
directorships; market making and/or specialist role.
The following are additional required disclosures:
Ownership and Material Conflicts of Interest: DBSI prohibits its analysts, persons reporting to analysts and members of their
households from owning securities of any company in the analyst's area of coverage.
Analyst compensation: Analysts are paid in part based on the profitability of DBSI, which includes investment banking
revenues.
Analyst as Officer or Director: DBSI policy prohibits its analysts, persons reporting to analysts or members of their households
from serving as an officer, director, advisory board member or employee of any company in the analyst's area of coverage.
Distribution of ratings: See the distribution of ratings disclosure above.
Price Chart: See the price chart, with changes of ratings and price targets in prior periods, above, or, if electronic format or if
with respect to multiple companies which are the subject of this report, on the DBSI website at
http://gm.db.com.
Additional disclosures required under the laws and regulations of jurisdictions other
than the United States
The following disclosures are those required by the jurisdiction indicated, in addition to those already made pursuant to United
States laws and regulations.
Analyst compensation: Analysts are paid in part based on the profitability of Deutsche Bank AG and its affiliates, which
includes investment banking revenues
Australia: This research, and any access to it, is intended only for "wholesale clients" within the meaning of the Australian
Corporations Act.
EU: A general description of how Deutsche Bank AG identifies and manages conflicts of interest in Europe is contained in our
public facing policy for managing conflicts of interest in connection with investment research.
Germany: See company-specific disclosures above for (i) any net short position, (ii) any trading positions (iii) holdings of five
percent or more of the share capital. In order to prevent or deal with conflicts of interests Deutsche Bank AG has
implemented the necessary organisational procedures to comply with legal requirements and regulatory decrees. Adherence
to these procedures is monitored by the Compliance-Department.
Hong Kong: See http://gm.db.com for company-specific disclosures required under Hong Kong regulations in connection with
this research report. Disclosure #5 includes an associate of the research analyst. Disclosure #6, satisfies the disclosure of
financial interests for the purposes of paragraph 16.5(a) of the SFC's Code of Conduct (the "Code"). The 1% or more interests
is calculated as of the previous month end. Disclosures #7 and #8 combined satisfy the SFC requirement under paragraph
16.5(d) of the Code to disclose an investment banking relationship.
Japan: See company-specific disclosures as to any applicable disclosures required by Japanese stock exchanges, the
Japanese Securities Dealers Association or the Japanese Securities Finance Company.
Russia: The information, interpretation and opinions submitted herein are not in the context of, and do not constitute, any
appraisal or evaluation activity requiring a licence in the Russian Federation.
South Africa: Publisher: Deutsche Securities (Pty) Ltd, 3 Exchange Square, 87 Maude Street, Sandton, 2196, South Africa.
Author: As referred to on the front cover. All rights reserved. When quoting, please cite Deutsche Securities Research as the
source.
30 October 2006 Transport Localiza
Deutsche Bank AG/London Page 29
Turkey: The information, interpretation and advice submitted herein are not in the context of an investment consultancy
service. Investment consultancy services are provided by brokerage firms, portfolio management companies and banks that
are not authorized to accept deposits through an investment consultancy agreement to be entered into such corporations and
their clients. The interpretation and advices herein are submitted on the basis of personal opinion of the relevant interpreters
and consultants. Such opinion may not fit your financial situation and your profit/risk preferences. Accordingly, investment
decisions solely based on the information herein may not result in expected outcomes.
United Kingdom: Persons who would be categorized as private customers in the United Kingdom, as such term is defined in
the rules of the Financial Services Authority, should read this research in conjunction with prior Deutsche Bank AG research on
the companies which are the subject of this research.
30 October 2006 Transport Localiza
Page 30 Deutsche Bank AG/London
30 October 2006 Transport Localiza
Deutsche Bank AG/London Page 31
Global Disclaimer
The information and opinions in this report were prepared by Deutsche Bank AG or one of its affiliates (collectively “Deutsche Bank”). The information herein is believed by Deutsche Bank to be reliable and has been obtained
from public sources believed to be reliable. With the exception of information about Deutsche Bank, Deutsche Bank makes no representation as to the accuracy or completeness of such information.
This published research report may be considered by Deutsche Bank when Deutsche Bank is deciding to buy or sell proprietary positions in the securities mentioned in this report.
For select companies, Deutsche Bank equity research analysts may identify shorter-term opportunities that are consistent or inconsistent with Deutsche Bank's existing, longer-term Buy or Sell recommendations. This
information is made available on the SOLAR stock list, which can be found at http://gm.db.com.
Deutsche Bank may trade for its own account as a result of the short term trading suggestions of analysts and may also engage in securities transactions in a manner inconsistent with this research report and with respect to
securities covered by this report, will sell to or buy from customers on a principal basis. Disclosures of conflicts of interest, if any, are discussed at the end of the text of this report or on the Deutsche Bank website at
http://gm.db.com.
Opinions, estimates and projections in this report constitute the current judgement of the author as of the date of this report. They do not necessarily reflect the opinions of Deutsche Bank and are subject to change without
notice. Deutsche Bank has no obligation to update, modify or amend this report or to otherwise notify a reader thereof in the event that any matter stated herein, or any opinion, projection, forecast or estimate set forth herein,
changes or subsequently becomes inaccurate, except if research on the subject company is withdrawn. Prices and availability of financial instruments also are subject to change without notice. This report is provided for
informational purposes only. It is not to be construed as an offer to buy or sell or a solicitation of an offer to buy or sell any financial instruments or to participate in any particular trading strategy in any jurisdiction or as an
advertisement of any financial instruments.
The financial instruments discussed in this report may not be suitable for all investors and investors must make their own investment decisions using their own independent advisors as they believe necessary and based upon
their specific financial situations and investment objectives. If a financial instrument is denominated in a currency other than an investor’s currency, a change in exchange rates may adversely affect the price or value of, or the
income derived from, the financial instrument, and such investor effectively assumes currency risk. In addition, income from an investment may fluctuate and the price or value of financial instruments described in this report,
either directly or indirectly, may rise or fall. Furthermore, past performance is not necessarily indicative of future results.
Unless governing law provides otherwise, all transactions should be executed through the Deutsche Bank entity in the investor’s home jurisdiction . In the U.S. this report is approved and/or distributed by Deutsche Bank
Securities Inc., a member of the NYSE, the NASD, NFA and SIPC. In Germany this report is approved and/or communicated by Deutsche Bank AG Frankfurt authorised by Bundesanstalt für Finanzdienstleistungsaufsicht. In the
United Kingdom this report is approved and/or communicated by Deutsche Bank AG London, a member of the London Stock Exchange and regulated by the Financial Services Authority for the conduct of investment business in
the UK and authorised by Bundesanstalt für Finanzdienstleistungsaufsicht (BaFin). This report is distributed in Hong Kong by Deutsche Bank AG, Hong Kong Branch, in Korea by Deutsche Securities Korea Co. and in Singapore
by Deutsche Bank AG, Singapore Branch. In Japan this report is approved and/or distributed by Deutsche Securities Inc. The information contained in this report does not constitute the provision of investment advice. In
Australia, retail clients should obtain a copy of a Product Disclosure Statement (PDS) relating to any financial product referred to in this report and consider the PDS before making any decision about whether to acquire the
product. Deutsche Bank AG Johannesburg is incorporated in the Federal Republic of Germany (Branch Register Number in South Africa: 1998/003298/10) Additional information relative to securities, other financial
products or issuers discussed in this report is available upon request. This report may not be reproduced, distributed or published by any person for any purpose without Deutsche Bank's prior written consent. Please cite
source when quoting.
Copyright © 2006 Deutsche Bank AG 06/2006
GRCM2006PROD008802
Deutsche Bank AG/London
International locations
Deutsche Bank Securities Inc.
60 Wall Street
New York, NY 10005
United States of America
Tel: (1) 212 250 2500
Deutsche Bank AG London
1 Great Winchester Street
London EC2N 2EQ
United Kingdom
Tel: (44) 20 7545 8000
Fax: (44) 20 7545 6155
Deutsche Bank AG
Große Gallusstraße 10-14
60272 Frankfurt am Main
Germany
Tel: (49) 69 910 41339
Deutsche Bank AG
Deutsche Bank Place
Level 16
Corner of Hunter & Phillip Streets
Sydney, NSW 2000
Australia
Tel: (61) 2 8258 1234
Fax: (61) 2 8258 1400
Deutsche Bank AG
Level 55
Cheung Kong Center
2 Queen’s Road Central
Hong Kong
Tel: (852) 2203 8888
Fax: (852) 2203 6921
Deutsche Securities Inc.
Level 20, 2-11-1 Nagatacho
Sanno Park Tower
Chiyoda-ku, Tokyo 100-6171
Japan
Tel: (81) 3 5156 6701
Fax: (81) 3 5156 6700

Mais conteúdo relacionado

Mais procurados

CFA Research Challenge - Equity Research Report - G4S
CFA Research Challenge - Equity Research Report - G4S CFA Research Challenge - Equity Research Report - G4S
CFA Research Challenge - Equity Research Report - G4S Rory Blundell
 
David Sutton FIM G4S Stock Analysis
David Sutton FIM G4S Stock AnalysisDavid Sutton FIM G4S Stock Analysis
David Sutton FIM G4S Stock AnalysisDavid A. Sutton
 
Canadian Asset Managers - Initiation Report
Canadian Asset Managers - Initiation ReportCanadian Asset Managers - Initiation Report
Canadian Asset Managers - Initiation ReportKevin Cheng, CFA
 
Third point-q4-2014-investor-letter-tpoi
Third point-q4-2014-investor-letter-tpoiThird point-q4-2014-investor-letter-tpoi
Third point-q4-2014-investor-letter-tpoiFrank Ragol
 
Costco financial analysis may 2008 slideshare
Costco  financial analysis  may 2008 slideshareCostco  financial analysis  may 2008 slideshare
Costco financial analysis may 2008 slideshareGregg Carlson
 
Mergers & Acquisitions and Capital Market Update
Mergers & Acquisitions and Capital Market UpdateMergers & Acquisitions and Capital Market Update
Mergers & Acquisitions and Capital Market UpdateSSDlaw
 
JCI Summary Analysis
JCI Summary AnalysisJCI Summary Analysis
JCI Summary AnalysisJencil Philip
 
The Thawing of the Credit Markets
The Thawing of the Credit MarketsThe Thawing of the Credit Markets
The Thawing of the Credit MarketsFranz von Bradsky
 
Investor presentation-march-2016
Investor presentation-march-2016Investor presentation-march-2016
Investor presentation-march-2016Intact
 
Investor presentation aug 2012 v001_x28lvi
Investor presentation aug 2012 v001_x28lviInvestor presentation aug 2012 v001_x28lvi
Investor presentation aug 2012 v001_x28lviIntact
 
BMO Capital Markets
BMO Capital MarketsBMO Capital Markets
BMO Capital Marketsryersoninc
 
WIG - June 2014 Annual Financial Report
WIG - June 2014 Annual Financial ReportWIG - June 2014 Annual Financial Report
WIG - June 2014 Annual Financial ReportBrad Sheahon
 
Comparative analysis of costco target
Comparative analysis of costco targetComparative analysis of costco target
Comparative analysis of costco targetFrancisco Lopez
 
Ifc investor-presentation-(august-2016)
Ifc investor-presentation-(august-2016)Ifc investor-presentation-(august-2016)
Ifc investor-presentation-(august-2016)Intact
 
Tricumen / Capital Markets: Results Review 4Q13/FY13_OPEN
Tricumen / Capital Markets: Results Review 4Q13/FY13_OPENTricumen / Capital Markets: Results Review 4Q13/FY13_OPEN
Tricumen / Capital Markets: Results Review 4Q13/FY13_OPENTricumen Ltd
 
4Q16 SCFG Commentary_with Snapshot
4Q16 SCFG Commentary_with Snapshot4Q16 SCFG Commentary_with Snapshot
4Q16 SCFG Commentary_with SnapshotDrew Beja
 
PVA Credit Suisse Investor Presentation
PVA Credit Suisse Investor PresentationPVA Credit Suisse Investor Presentation
PVA Credit Suisse Investor PresentationPennVirginiaCorp
 

Mais procurados (20)

Us er-crude-downturn
Us er-crude-downturnUs er-crude-downturn
Us er-crude-downturn
 
CFA Research Challenge - Equity Research Report - G4S
CFA Research Challenge - Equity Research Report - G4S CFA Research Challenge - Equity Research Report - G4S
CFA Research Challenge - Equity Research Report - G4S
 
David Sutton FIM G4S Stock Analysis
David Sutton FIM G4S Stock AnalysisDavid Sutton FIM G4S Stock Analysis
David Sutton FIM G4S Stock Analysis
 
CFA IRC Team E
CFA IRC Team ECFA IRC Team E
CFA IRC Team E
 
Canadian Asset Managers - Initiation Report
Canadian Asset Managers - Initiation ReportCanadian Asset Managers - Initiation Report
Canadian Asset Managers - Initiation Report
 
Third point-q4-2014-investor-letter-tpoi
Third point-q4-2014-investor-letter-tpoiThird point-q4-2014-investor-letter-tpoi
Third point-q4-2014-investor-letter-tpoi
 
Costco financial analysis may 2008 slideshare
Costco  financial analysis  may 2008 slideshareCostco  financial analysis  may 2008 slideshare
Costco financial analysis may 2008 slideshare
 
Investor Day 2013: Aeroplan 2.0
Investor Day 2013: Aeroplan 2.0Investor Day 2013: Aeroplan 2.0
Investor Day 2013: Aeroplan 2.0
 
Mergers & Acquisitions and Capital Market Update
Mergers & Acquisitions and Capital Market UpdateMergers & Acquisitions and Capital Market Update
Mergers & Acquisitions and Capital Market Update
 
JCI Summary Analysis
JCI Summary AnalysisJCI Summary Analysis
JCI Summary Analysis
 
The Thawing of the Credit Markets
The Thawing of the Credit MarketsThe Thawing of the Credit Markets
The Thawing of the Credit Markets
 
Investor presentation-march-2016
Investor presentation-march-2016Investor presentation-march-2016
Investor presentation-march-2016
 
Investor presentation aug 2012 v001_x28lvi
Investor presentation aug 2012 v001_x28lviInvestor presentation aug 2012 v001_x28lvi
Investor presentation aug 2012 v001_x28lvi
 
BMO Capital Markets
BMO Capital MarketsBMO Capital Markets
BMO Capital Markets
 
WIG - June 2014 Annual Financial Report
WIG - June 2014 Annual Financial ReportWIG - June 2014 Annual Financial Report
WIG - June 2014 Annual Financial Report
 
Comparative analysis of costco target
Comparative analysis of costco targetComparative analysis of costco target
Comparative analysis of costco target
 
Ifc investor-presentation-(august-2016)
Ifc investor-presentation-(august-2016)Ifc investor-presentation-(august-2016)
Ifc investor-presentation-(august-2016)
 
Tricumen / Capital Markets: Results Review 4Q13/FY13_OPEN
Tricumen / Capital Markets: Results Review 4Q13/FY13_OPENTricumen / Capital Markets: Results Review 4Q13/FY13_OPEN
Tricumen / Capital Markets: Results Review 4Q13/FY13_OPEN
 
4Q16 SCFG Commentary_with Snapshot
4Q16 SCFG Commentary_with Snapshot4Q16 SCFG Commentary_with Snapshot
4Q16 SCFG Commentary_with Snapshot
 
PVA Credit Suisse Investor Presentation
PVA Credit Suisse Investor PresentationPVA Credit Suisse Investor Presentation
PVA Credit Suisse Investor Presentation
 

Semelhante a Localiza_Initiate_Oct06

Credit Corp - turnaround in performance
Credit Corp - turnaround in performance Credit Corp - turnaround in performance
Credit Corp - turnaround in performance George Gabriel
 
Credit Corp (CCP) - leading indicators in consumer debt recovery sector
Credit Corp (CCP) - leading indicators in consumer debt recovery sector Credit Corp (CCP) - leading indicators in consumer debt recovery sector
Credit Corp (CCP) - leading indicators in consumer debt recovery sector George Gabriel
 
3Q06 Results Presentation
3Q06 Results Presentation 3Q06 Results Presentation
3Q06 Results Presentation RiRossi
 
Virtual Investor Conference OTC - May/16
Virtual Investor Conference OTC - May/16Virtual Investor Conference OTC - May/16
Virtual Investor Conference OTC - May/16Localiza
 
C3 Took KitTool Kit for Analysis of Financial Statements Financial.docx
C3 Took KitTool Kit for Analysis of Financial Statements Financial.docxC3 Took KitTool Kit for Analysis of Financial Statements Financial.docx
C3 Took KitTool Kit for Analysis of Financial Statements Financial.docxhumphrieskalyn
 
3Q09 Results Conference Call
3Q09 Results Conference Call3Q09 Results Conference Call
3Q09 Results Conference CallKianne Paganini
 
Alinta Ltd (AAN) -Scheme Proposal recommendation
Alinta Ltd (AAN) -Scheme Proposal recommendationAlinta Ltd (AAN) -Scheme Proposal recommendation
Alinta Ltd (AAN) -Scheme Proposal recommendationWILBUR TONG
 
Voltas Visit Update: Muted near-term outlook - Prabhudas Lilladher
Voltas Visit Update: Muted near-term outlook - Prabhudas LilladherVoltas Visit Update: Muted near-term outlook - Prabhudas Lilladher
Voltas Visit Update: Muted near-term outlook - Prabhudas LilladherIndiaNotes.com
 
Earnings Release Presentation - Third Quarter 2008 (3Q08).
Earnings Release Presentation - Third Quarter 2008 (3Q08).Earnings Release Presentation - Third Quarter 2008 (3Q08).
Earnings Release Presentation - Third Quarter 2008 (3Q08).MRVRI
 
NETFLIX Business Analysis & Valuation
NETFLIX Business Analysis & ValuationNETFLIX Business Analysis & Valuation
NETFLIX Business Analysis & ValuationAlegra N Horne
 
Prosafe Q 2013 results presentation
Prosafe Q 2013 results presentationProsafe Q 2013 results presentation
Prosafe Q 2013 results presentationTradeWindsnews
 
2006 Analysts and Investors Meeting
2006 Analysts and Investors Meeting2006 Analysts and Investors Meeting
2006 Analysts and Investors MeetingLocaliza
 
Fag bearing ru3 qcy2010-221010
Fag bearing ru3 qcy2010-221010Fag bearing ru3 qcy2010-221010
Fag bearing ru3 qcy2010-221010Angel Broking
 
Localiza institucional inglês
Localiza institucional   inglêsLocaliza institucional   inglês
Localiza institucional inglêsLocaliza
 
3 q09 conference call presentation
3 q09 conference call presentation3 q09 conference call presentation
3 q09 conference call presentationBancoABCRI
 
Financial services sector - implications of FOFA, possible acquires of SFW, S...
Financial services sector - implications of FOFA, possible acquires of SFW, S...Financial services sector - implications of FOFA, possible acquires of SFW, S...
Financial services sector - implications of FOFA, possible acquires of SFW, S...George Gabriel
 
SFW - FOFA implications, Sum of parts valuation, possible acquirers
SFW - FOFA implications, Sum of parts valuation, possible acquirers SFW - FOFA implications, Sum of parts valuation, possible acquirers
SFW - FOFA implications, Sum of parts valuation, possible acquirers George Gabriel
 
Value based management of Union pacific corp and UPS
Value based management of Union pacific corp and UPSValue based management of Union pacific corp and UPS
Value based management of Union pacific corp and UPSSayedSadullahSadat
 
Analysis of financial statements@ bec doms
Analysis of financial statements@ bec domsAnalysis of financial statements@ bec doms
Analysis of financial statements@ bec domsBabasab Patil
 

Semelhante a Localiza_Initiate_Oct06 (20)

Credit Corp - turnaround in performance
Credit Corp - turnaround in performance Credit Corp - turnaround in performance
Credit Corp - turnaround in performance
 
Credit Corp (CCP) - leading indicators in consumer debt recovery sector
Credit Corp (CCP) - leading indicators in consumer debt recovery sector Credit Corp (CCP) - leading indicators in consumer debt recovery sector
Credit Corp (CCP) - leading indicators in consumer debt recovery sector
 
3Q06 Results Presentation
3Q06 Results Presentation 3Q06 Results Presentation
3Q06 Results Presentation
 
Virtual Investor Conference OTC - May/16
Virtual Investor Conference OTC - May/16Virtual Investor Conference OTC - May/16
Virtual Investor Conference OTC - May/16
 
C3 Took KitTool Kit for Analysis of Financial Statements Financial.docx
C3 Took KitTool Kit for Analysis of Financial Statements Financial.docxC3 Took KitTool Kit for Analysis of Financial Statements Financial.docx
C3 Took KitTool Kit for Analysis of Financial Statements Financial.docx
 
3Q09 Results Conference Call
3Q09 Results Conference Call3Q09 Results Conference Call
3Q09 Results Conference Call
 
Alinta Ltd (AAN) -Scheme Proposal recommendation
Alinta Ltd (AAN) -Scheme Proposal recommendationAlinta Ltd (AAN) -Scheme Proposal recommendation
Alinta Ltd (AAN) -Scheme Proposal recommendation
 
Voltas Visit Update: Muted near-term outlook - Prabhudas Lilladher
Voltas Visit Update: Muted near-term outlook - Prabhudas LilladherVoltas Visit Update: Muted near-term outlook - Prabhudas Lilladher
Voltas Visit Update: Muted near-term outlook - Prabhudas Lilladher
 
Earnings Release Presentation - Third Quarter 2008 (3Q08).
Earnings Release Presentation - Third Quarter 2008 (3Q08).Earnings Release Presentation - Third Quarter 2008 (3Q08).
Earnings Release Presentation - Third Quarter 2008 (3Q08).
 
NETFLIX Business Analysis & Valuation
NETFLIX Business Analysis & ValuationNETFLIX Business Analysis & Valuation
NETFLIX Business Analysis & Valuation
 
Prosafe Q 2013 results presentation
Prosafe Q 2013 results presentationProsafe Q 2013 results presentation
Prosafe Q 2013 results presentation
 
2006 Analysts and Investors Meeting
2006 Analysts and Investors Meeting2006 Analysts and Investors Meeting
2006 Analysts and Investors Meeting
 
Fag bearing ru3 qcy2010-221010
Fag bearing ru3 qcy2010-221010Fag bearing ru3 qcy2010-221010
Fag bearing ru3 qcy2010-221010
 
Localiza institucional inglês
Localiza institucional   inglêsLocaliza institucional   inglês
Localiza institucional inglês
 
3 q09 conference call presentation
3 q09 conference call presentation3 q09 conference call presentation
3 q09 conference call presentation
 
Financial services sector - implications of FOFA, possible acquires of SFW, S...
Financial services sector - implications of FOFA, possible acquires of SFW, S...Financial services sector - implications of FOFA, possible acquires of SFW, S...
Financial services sector - implications of FOFA, possible acquires of SFW, S...
 
SFW - FOFA implications, Sum of parts valuation, possible acquirers
SFW - FOFA implications, Sum of parts valuation, possible acquirers SFW - FOFA implications, Sum of parts valuation, possible acquirers
SFW - FOFA implications, Sum of parts valuation, possible acquirers
 
Value based management of Union pacific corp and UPS
Value based management of Union pacific corp and UPSValue based management of Union pacific corp and UPS
Value based management of Union pacific corp and UPS
 
SIX2015-12
SIX2015-12SIX2015-12
SIX2015-12
 
Analysis of financial statements@ bec doms
Analysis of financial statements@ bec domsAnalysis of financial statements@ bec doms
Analysis of financial statements@ bec doms
 

Localiza_Initiate_Oct06

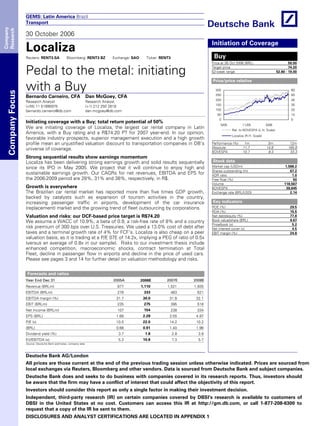
  • 1. GEMS: Latin America Brazil Transport 30 October 2006 Localiza Reuters: RENT3.SA Bloomberg: RENT3 BZ Exchange: SAO Ticker: RENT3 Pedal to the metal: initiating with a Buy Bernardo Carneiro, CFA Research Analyst (+55) 11 51895975 bernardo.carneiro@db.com Dan McGoey, CFA Research Analyst (+1) 212 250 2818 dan.mcgoey@db.com Initiating coverage with a Buy; total return potential of 50% We are initiating coverage of Localiza, the largest car rental company in Latin America, with a Buy rating and a R$74.20 PT for 2007 year-end. In our opinion, favorable industry prospects, superior management execution and a high growth profile mean an unjustified valuation discount to transportation companies in DB's universe of coverage. Forecasts and ratios Year End Dec 31 2005A 2006E 2007E 2008E Revenue (BRLm) 877 1,110 1,521 1,935 EBITDA (BRLm) 278 333 483 621 EBITDA margin (%) 31.7 30.0 31.8 32.1 EBIT (BRLm) 235 275 395 518 Net Income (BRLm) 107 154 238 334 EPS (BRL) 1.68 2.29 3.55 4.97 P/E (x) 10.5 22.0 14.2 10.2 (BRL) 0.66 0.91 1.40 1.96 Dividend yield (%) 3.7 1.8 2.8 3.9 EV/EBITDA (x) 5.3 10.8 7.3 5.7 Source: Deutsche Bank estimates, company data Deutsche Bank AG/London All prices are those current at the end of the previous trading session unless otherwise indicated. Prices are sourced from local exchanges via Reuters, Bloomberg and other vendors. Data is sourced from Deutsche Bank and subject companies. Deutsche Bank does and seeks to do business with companies covered in its research reports. Thus, investors should be aware that the firm may have a conflict of interest that could affect the objectivity of this report. Investors should consider this report as only a single factor in making their investment decision. Independent, third-party research (IR) on certain companies covered by DBSI's research is available to customers of DBSI in the United States at no cost. Customers can access this IR at http://gm.db.com, or call 1-877-208-6300 to request that a copy of the IR be sent to them. DISCLOSURES AND ANALYST CERTIFICATIONS ARE LOCATED IN APPENDIX 1 Initiation of Coverage Buy Price at 26 Oct 2006 (BRL) 50.50 Target price 74.20 52-week range 52.80 - 19.00 Price/price relative 0 50 100 150 200 250 300 5/05 11/05 5/06 0 10 20 30 40 50 60 Rel. to BOVESPA (L.H. Scale) Localiza (R.H. Scale) Performance (%) 1m 3m 12m Absolute 11.7 14.8 165.8 BOVESPA 10.7 8.3 33.3 Stock data Market cap (USDm) 1,588.2 Shares outstanding (m) 67.2 ADR ratio 1.0 Free float (%) 50 Volume 118,567 BOVESPA 39,645 Exchange rate (BRL/USD} 2.14 Key indicators ROE (%) 29.5 ROA (%) 15.5 Net debt/equity (%) 77.8 Book value/share (BRL) 9.67 Price/book (x) 5.2 Net interest cover (x) 4.5 EBIT margin (%) 24.8 Company ResearchCompanyFocus Strong sequential results show earnings momentum Localiza has been delivering strong earnings growth and solid results sequentially since its IPO in May 2005. We project that it will continue to enjoy high and sustainable earnings growth. Our CAGRs for net revenues, EBITDA and EPS for the 2006-2009 period are 28%, 31% and 38%, respectively, in R$. Growth is everywhere The Brazilian car rental market has reported more than five times GDP growth, backed by catalysts such as expansion of tourism activities in the country, increasing passenger traffic in airports, development of the car insurance (replacement) market and the growing trend of fleet outsourcing by corporations. Valuation and risks: our DCF-based price target is R$74.20 We assume a WACC of 10.9%, a beta of 0.9, a risk-free rate of 8% and a country risk premium of 300 bps over U.S. Treasuries. We used a 13.0% cost of debt after taxes and a terminal growth rate of 4% for FCF’s. Localiza is also cheap on a peer valuation basis, as it is trading at a P/E 07E of 14.2x, implying a PEG of ratio of 0.5x (versus an average of 0.8x in our sample). Risks to our investment thesis include enhanced competition, macroeconomic shocks, contract termination at Total Fleet, decline in passenger flow in airports and decline in the price of used cars. Please see pages 3 and 14 for further detail on valuation methodology and risks.
  • 2. 30 October 2006 Transport Localiza Page 2 Deutsche Bank AG/London Model updated: 24 October 2006 Year Ending 31 December 2005 2006E 2007E 2008E INCOME STATEMENT (BRL m) Sales revenue 877 1,110 1,521 1,935 Operating EBITDA 278 333 483 621 Depreciation 43 58 88 102 Amortisation 0 0 0 0 EBIT 235 275 395 518 Net interest income(expense) -84 -62 -64 -54 Associates/affiliates 0 0 0 0 Investment/other income(expense) 0 0 0 0 Exceptionals/extraordinaries 0 0 0 0 Income tax expense 44 59 93 130 Minorities/preference dividends 0 0 0 0 Net income 107 154 238 334 CASH FLOW (BRL m) Cash flow from operations -191 -20 194 59 Movement in net working capital -341 -236 -132 -378 Capex -28 -29 -30 -31 Free cash flow -219 -48 164 28 Other investing activities 0 0 0 0 +55-11-51895975 Equity raised(bought back) 0 150 0 0 Dividends paid -42 -61 -94 -132 Net inc(dec) in borrowings 203 -88 350 0 +1 212 250 2818 Other financing cash flows 0 0 0 0 Total cash flows from financing 161 1 256 -132 Net cash flow -59 -48 420 -104 Movement in net debt(cash) 261 -41 -70 104 BALANCE SHEET (BRL m) Cash and other liquid assets 71 23 443 339 Tangible fixed assets 50 70 86 98 Goodwill 0 0 0 0 Other intangible assets 0 0 0 0 Associates/investments 195 299 313 381 Other assets 854 1,091 1,171 1,421 Total assets 1,170 1,484 2,014 2,239 Interest bearing debt 610 529 879 879 Other liabilities 165 304 340 362 Total liabilities 775 834 1,219 1,242 Shareholders' equity 394 650 794 996 Minorities 0 0 1 1 Total shareholders' equity 395 650 795 997 Net working capital 712 840 887 1,116 Net debt(cash) 539 506 436 540 Capital 934 1,156 1,231 1,537 RATIO ANALYSIS Sales growth (%) na 26.5 37.1 27.2 Op. EBITDA/sales (%) 31.7 30.0 31.8 32.1 EBIT/sales (%) 26.8 24.8 26.0 26.8 Payout ratio (%) 39.5 39.5 39.5 39.5 52-week Range: BRL 19.00 - 52.80 ROE (%) 27.0 29.5 33.0 37.3 Market Cap (m) BRL 3,395 Return on Capital (%) 17.8 19.0 23.8 26.9 USD 1,588 Operating Return on Capital (%) 22.5 24.9 32.1 36.0 Capex/sales (%) 3.2 2.6 2.0 1.6 Company identifiers Capex/depreciation (x) 0.7 0.5 0.3 0.3 Cusip NA Net debt/equity (%) 136.6 77.8 54.9 54.2 SEDOL B08K3S0 Net interest cover (x) 2.8 4.5 6.2 9.6 Source: Company data, Deutsche Bank estimates 2.0 4.2 3.8 3.1 6.2 13.1 8.9 6.9 5.3 10.8 7.3 5.7 1.67 3.25 2.31 1.84 1,469 3,602 3,518 3,555 1,123 3,395 3,395 3,395 63.3 67.2 67.2 67.2 4.59 5.22 4.27 3.41 6.23 9.67 11.81 14.82 3.7 1.8 2.8 3.9 0.66 0.91 1.40 1.96 nm nm 17.5 58.0 -3.46 -0.72 2.44 0.42 -3.02 -0.29 2.89 0.87 10.5 22.0 14.2 10.2 1.68 2.29 3.55 4.97 na 36.4 54.6 40.1 10.5 22.0 14.2 10.2 1.68 2.29 3.55 4.97 Average market cap (BRL m) Price as of 26 October Target price BRL 50.50 BRL 74.20 Weighted average shares (m) Price/BV (x) Buy BV/Share (BRL) EV/Operating Capital Company website http://www.localiza.com Company description EV/Sales EV/EBITDA EV/EBIT Enterprise value (BRL m) DPS (BRL) Operating CFPS (BRL) EPS FD (BRL) Dividend Yield (%) Free CFPS (BRL) P/E ratio FD (x) P/CFPS (x)Localiza SUMMARY P/E ratio Headline (x) Headline EPS growth (%) Research Team Localiza is the largest car rental company in Latin America, with a network of 322 branches in nine countries and a car fleet of 43,000 vehicles. The company operates in four synergetic business segments which are car rental, fleet rental and fleet management, franchising and used car sales. Localiza is listed in the Novo Mercado classification of the Bovespa, which grants shareholders the highest standards of corporate governance and minority shareholder protection in Brazil Running the Numbers Headline EPS (BRL) GEM Brazil Transport Reuters: RENT3.SA Bloomberg: RENT3 BZ bernardo.carneiro@db.com Bernardo Carneiro Dan McGoey, CFA dan.mcgoey@db.com Price and Price Relative 10 15 20 25 30 35 40 45 50 55 60 10/01 10/02 10/03 10/04 10/05 10/06 0 50 100 150 200 250 300 350 Localiza (L.H.S.) Rel. to BOVESPA (R.H.S.) Absolute Price Return (%) 12% 13% 166% 0% 50% 100% 150% 200% 1m 3m 12m Margin Trends (%) 0 5 10 15 20 25 30 35 40 05 06E 07E 08E Sales growth (%) Op. EBITDA/sales (%) Return Ratios (%) 0 5 10 15 20 25 30 35 40 05 06E 07E 08E ROE (%) Return on Capital (%) Operating Return on Capital (%) Net Debt (Cash) / Equity (%) 0 100 200 300 400 500 600 05 06E 07E 08E 0 20 40 60 80 100 120 140 160 Net Debt / Cash (BRL m) Net debt/equity (%)
  • 3. 30 October 2006 Transport Localiza Deutsche Bank AG/London Page 3 Investment thesis Outlook We are initiating coverage on Localiza with a Buy rating and R$74.20 target price per share (2007 year-end), implying 50% total return potential (including dividends) from current levels. In our view, Localiza is a high-growth story fueled by state-of-the-art execution and favorable industry prospects. Localiza holds important competitive advantages such as its extensive experience in renting cars, strong bargaining power with automakers when purchasing cars, a skilled management and large country footprint in terms of branches and brand reputation. We estimate that the company will continue to enjoy high and sustainable earnings growth in the next three years. Our CAGRs for net revenues, EBITDA and EPS for the 2006-2009 period are 28%, 31% and 39%, respectively, in local currency terms. These growth rates compare favorably with anticipated earnings growth for the transportation companies in our universe of coverage. Valuation Our DCF valuation is based on a WACC of 10.9% as the discount rate for the FCFFs (free cash flows to firm), a beta of 0.9, a risk-free rate of 8% and a country risk premium of 300 bps over U.S. Treasuries. We used a 13.0% cost of debt after taxes (103% of the CDI forecast for 2007) and a perpetuity growth rate of 4% for FCFFs. On a comparative valuation basis, Localiza is trading at a discount of ~35% to domestic players in the transportation sector considering its PEG ratio – price to earnings growth – of 0.5 times (calculated with P/E 07E and 2007-2010 EPS CAGR). We think the company should trade at a 0.8x PEG ratio, meaning that it deserves a 20% discount to the 1.0x PEG benchmark to reflect the stock’s poor liquidity. If we had chosen this approach for our valuation, the 0.8x PEG 2007E would have implied a target P/E 07E of 23.0x and a fair value per share of R$81.30, which is higher than our DCF-derived price target of R$74.20. Risks Notable risks to our investment thesis are: The strong competitive environment requires aggressive marketing efforts and subsidized rental rates; Macroeconomic risks (potential increases in interest rates and GDP contraction) affecting the demand for car rentals and increasing cost of funding; Risks of contract termination by customers of the fleet rental unit; Potential declines in the passenger flow in airports (motivated by GDP contraction, terrorism, etc.) which account for 50% of the revenues in the car rental unit; Potential declines in the prices of used cars in the secondary market could lead to a deterioration of free cash flow. A high-growth story fueled by state-of-the-art execution and favorable industry prospects
  • 4. 30 October 2006 Transport Localiza Page 4 Deutsche Bank AG/London Table of Contents Company overview............................................................................ 5 Background...............................................................................................................................5 Management & shareholders....................................................................................................5 Business units...........................................................................................................................6 Industry background ....................................................................... 10 The very beginning..................................................................................................................10 Competitive environment........................................................................................................10 Growth is everywhere.............................................................................................................11 Valuation and rating........................................................................ 15 DCF valuation..........................................................................................................................15 Peer valuation .........................................................................................................................15 Risks .......................................................................................................................................16 Earnings outlook.............................................................................. 17 Accounting issues...................................................................................................................17 Earnings scenario....................................................................................................................17 Business model sensitivity......................................................................................................20
  • 5. 30 October 2006 Transport Localiza Deutsche Bank AG/London Page 5 Company overview Background Localiza was founded in 1973 by Salim Mattar, since then its chairman and CEO. It is now the largest car rental company in Latin America, with a network of 322 branches in nine countries and a car fleet of 43,000 vehicles. The company operates in four synergetic business segments – car rental, fleet rental and fleet management, franchising and used car sales. Business car rentals account for 75% of total rentals, comprising corporate employees and wealthy individuals. The stock is listed in the Novo Mercado classification of the Bovespa, which grants shareholders the highest standards of corporate governance and minority shareholder protection in Brazil (i.e., 100% of tag-along rights and only voting stock listed). Since 1997, when private equity investors acquired a strategic stake in the company, management has been developing a close relationship with the capital markets and the analyst community. In May 2005, the company held its IPO in a US$100 million deal with the sale of existing shares by the controlling shareholders. In April 2006 it concluded a follow-on offer of R$450 million, when the free float reached 50% from 38% previously. Since the IPO the stock has had a stellar performance, appreciating by 350% in local currency compared to 62% by the Ibovespa. Management & shareholders Localiza’s executive officers comprise the founders and one independent professional, the CFO, who has been with the company for more than 20 years. There has been no turnover so far in the top management, which is a strong message of commitment and loyalty to the employees. In addition to the regular salaries, everyone in the company receives variable compensation, which is tied to the targets accomplished and distributed as profit-sharing. Senior management is also granted stock options, distributed in a period of four years at a maximum of 3% of outstanding shares in the period. Management is promptly accessible and has so far developed an active investor relations department demonstrating alignment between majority and minority shareholders and providing fair disclosure of results. Figure 1: Localiza – Shareholder Structure Antonio Claudio Resende 15% Free Float 50% SalimMattar 15% Flavio Resende 10% Eugenio Mattar 10% Source: Deutsche Bank, Company data
  • 6. 30 October 2006 Transport Localiza Page 6 Deutsche Bank AG/London The Board of Directors is formed of nine people, of whom three are independent professionals including the former president of Banco do Brasil and former executive directors of investment banks. Figure 2: Localiza – Corporate Structure Localiza Franchising Total Fleet Prime (Seminovos) Franchising Brasil Car rental Rental International LFI (Argentina) 92.5% 92.5% 100% 95% 100% 100% 100% Source: Deutsche Bank, Company data Business units Localiza’s consolidated operations are split into four business units complementing each other and generating operating synergies. The company’s large-scale and integrated platform enable it to provide high-quality services at low costs while minimizing working capital commitment in the car acquisition business. Car rental The car rental unit, which uses the same brand as the consolidated corporation (Localiza), is the largest car rental company in Brazil by number of branches. It is highly recognized for its service quality and geographical reach. The unit operates in four different market niches, which are individuals, travel industry, corporate or mini-lease and replacement (car insurance). Because of its major presence in popular tourist locales, the company’s focus is on renting cars to wealthy individuals during vacation periods as well as renting cars to businessmen in the busiest cities. In 2005, the ten largest corporate customers accounted for 10% of the unit’s rentals while the largest accounted for 2.7% of the total. Most of the cars rented consist of the so-called popular models, which are simple vehicles having no major features such as electronic appliances or automatic gears. The most rented cars are the Palio (Fiat), Celta (GM) and Corsa (GM), which also have the lowest rental rates. The average age of the fleet ranges from five to seven months. Yield management Localiza makes use of a complex yield management technique similar to the one employed by airlines in Brazil, as well as a regional pricing policy. Depending on the demand for car rentals and the utilization rate of the fleet in a single branch, it can adjust rental rates to create demand in that particular location, considering the day of the week, city, event, etc. A key input in determining rental rates is the estimated sale price of the used cars, based on extensive research by Seminovos, the used car seller. If the secondary market of used cars deteriorates – car prices drop more than what is anticipated by management – Seminovos will generate lower cash flow in selling the used cars, translating into higher depreciation expenses. This can be offset by higher rental rates charged by Localiza in the branches. Therefore, rental rates determination takes into account the prospects for the other units in a consolidated approach, using inputs such as average age of car fleet, utilization rates and expected resale price of the used cars, as well the competitive environment per region.
  • 7. 30 October 2006 Transport Localiza Deutsche Bank AG/London Page 7 In order to retain customers and maintain brand reputation, Localiza offers customers a loyalty program that grants them free rental after accumulating R$3,000 of rentals (approximately US$1,350). The gift leverages the car rental business as customers usually pay for additional rentals when granted one for free. The membership program has close to 1.0 million customers registered and their profile, including a digital photo of their driver’s license, can be accessed online in real time from any of the 322 branches in Latin America. In 2005, roughly 43% of the car rental revenues came from members of the loyalty program. Customers book reservations by phone, through travel agencies (crucial in the tourism segment) or over the internet (roughly 300,000 visitors each month) and enjoy a free 24-hour assistance call center. It is worth highlighting Localiza’s corporate culture of “spectacular customer service” which extracts the best service from its employees. The company does not hire outside professionals that previously worked for other rental car companies – it aims to shape the workforce in its own way, making it easier for culture dissemination. Figure 3: Localiza – Revenue Breakdown (2005A) Figure 4: Localiza – EBITDA Breakdown (2005A) Franchising 1% Used cars sales 51% Car rental 31% Fleet rental 17% Franchising 1% Used cars sales 14% Car rental 49% Fleet rental 36% Source: Deutsche Bank, Company data Source: Deutsche Bank, Company data Used car sales The purchase and sale of cars is done by Seminovos (meaning “almost new”) and used car sales represent roughly 50% of the consolidated revenues. However, this is not a core business for the consolidated company (it contributes less than 15% of EBITDA) but rather a crucial and complementary operation. Localiza’s focus is on renting out new and modern cars to its customers in order to improve its brand and quality reputation, minimize maintenance costs and maximize the market value of the fleet when selling the used cars (thus limiting depreciation costs). Unlike the U.S., automakers do not provide buyback guarantees to car rental companies in Brazil, leaving them exposed to fluctuations in the market of used cars. Car prices are set according to an extensive research of the used car market in the main Brazilian cities and also take into consideration the operating (the sales structure comprising 15 Seminovos stores) and financial expenses that accrue on short-term loans taken to fund the purchase of cars. The company used to offset part of these expenses collecting referral fees from banks and financial agents recommended to finance customers at the stores (the unit never financed customers itself in order to circumvent balance sheet exposure). Recently, this situation changed as Seminovos set up a financial agreement with Banco do Brasil last September offering it exclusive rights in financing customers in exchange for a share of the financial monthly spread charged over car sales.
  • 8. 30 October 2006 Transport Localiza Page 8 Deutsche Bank AG/London In order to maintain a mix of new cars in the fleet, Seminovos is frequently turning over approximately 80% of the 43,000 vehicles rented by Localiza and Total Fleet, maintaining the average age of the fleet at 12 months (the remaining 20% of the fleet is sold through independent car dealers). The sizeable consolidated car fleet and the high number of car rental branches grant Localiza a strong bargaining power with automakers (it is the largest car purchaser in Brazil, accounting for approximately 2% of the market), and therefore it gets attractive discounts when buying brand new cars. In 2005, the unit purchased 30,879 cars and we believe that it enjoys roughly 25% off the list prices of vehicles sold by GM, Volkswagen, Ford and Fiat in the country. Customers of Seminovos can explore cars over the Seminovos website and sort them by type, color, year of launch, price, etc., and even choose available financing plans, consulting installments, interest rates, etc. Fleet rental The rising trend of outsourcing fleet and fleet management services by large and mid-sized companies has fueled the growth of Total Fleet, Localiza’s unit for fleet rental and fleet management. The unit rents approximately 12,500 cars to roughly 270 companies, out of which 31 accounted for 60% of rentals generated in 2005 (the ten largest ones accounted for 38% of the total rental). The customer base is thus very concentrated when compared to Localiza’s car rental operation. In order to protect it from early termination of contracts, the unit charges customers penalties of 10% to 50% of payments due. Total Fleet has a very low fixed cost structure operating through a central unit and few employees, using intensive technology. Out of the 1,845 employees as of December 2005, fewer than 7% were allocated in the unit. This unit rents cars in accordance to the specifics of the clients and for middle to long-term periods (average term of three years). The average age of the fleet, as of 3Q06, was 14.4 months. The tailor-made contracts allow Total Fleet to obtain high margins and cross-sell other products such as the short-term fleet contracts operated by Localiza. Corporate customers can order any sort of vehicle, from the popular GMs to BMWs and as many as they want. The unit is the most profitable of Localiza’s units, with an EBITDA margin of 69% in the January to September 2006 period. The market for fleet rental is growing as companies concentrate on their core business and let third-party companies provide car services. According to Total Fleet, the potential market for fleet rentals constitutes 150,000 cars that could be rented out to large and solid financial corporations (it is the market leader in Brazil with roughly 8% market share only). This market, as opposed to car rental, is not as sensitive to GDP fluctuations as contracts between the unit and the client are long-term and rental rates are less flexible. The large footprint in Brazil has also enabled Total Fleet to expand market share and retain customers as it satisfies customer needs due to its wide geographical presence and assistance. Localiza’s branches, spread across the country, can provide Total Fleet with cars and vice-versa, depending on the availability of cars parked in the branches, i.e., the utilization ratio of the fleet. Premium customer service Total Fleet has developed a premium service and state-of-the-art technologies to handle all sorts of needs or problems experienced by its customers. For instance, the unit has online access to a wide range of parts vendors and independent towing services registered in its database which can repair car damages or failures no matter where the car is located at the time of the incident. The damages are photographed and digitally filed so that Total Fleet can follow up remotely and monitor the quality of the service executed. Customers can also approve budgets through the Total Fleet website and request consulting for fleet rentals.
  • 9. 30 October 2006 Transport Localiza Deutsche Bank AG/London Page 9 Franchising One of the pillars for the growth of the company has been its franchising operation. The footprint expansion through franchisees enabled Localiza, back in 1983, to cheaply reinforce its brand and provide car rental services in locations that are less in demand and/or more risky, such as in rural areas and other countries. Franchisees share Localiza’s know-how, training, marketing material and bargaining power with automakers if they choose to purchase cars together with the company. However, Seminovos does not sell cars previously operated by the franchisees. The franchised branches share the same database and online system as the other branches in an integrated platform. In exchange for Localiza’s corporate support, the franchisees usually pay 6% of revenues to the company as regular fees. Depending on the investment returns achieved by the franchisees, the company may opt for the acquisition of these branches (a practice that has been significantly accretive to earnings). As of June 2006, out of the 322 branches, 195 were operated by franchisees. Geographical presence In Brazil, Localiza has a diversified geographical reach, ranging from busy cities to small vacation areas visited by wealthy tourists. Aside from Brazil, Localiza is present in eight other countries in Latin America, including Mexico, Chile and Argentina. All its international operations are run by franchisees, in order to keep top management’s focus on Brazil (where it believes it has significant growth opportunities); this also means that the franchisees are left to analyze, and learn about, these markets and at the same time bear the burden of start- up-related risks. In the past two years Localiza has expanded into the Brazilian countryside where new airports are being built and where the economic activity is picking up, such as in the agribusiness and energy sectors. Figure 5: Localiza – Branch Distribution Source: Deutsche Bank, Company data Financial profile Localiza is a solid company financially, with average to below-average leverage. Almost all of its debt is local currency-denominated and linked to floating rates, the CDI; therefore, the current downward trend in local interest rates should trigger an improvement in the company’s financial results. With the follow-on offer of April 2006, Localiza’s net debt to equity dropped to 0.6x as of September from 1.4x in December 2005, reaching a solid financial position. Moreover, the car fleet represents most of its total assets (approximately 70%) and is characterized by high liquidity, and Localiza can promptly sell cars in the event of financial distress.
  • 10. 30 October 2006 Transport Localiza Page 10 Deutsche Bank AG/London Industry background The very beginning The car rental industry in Brazil dates back to as early as the 1950s. Initially, businessmen in the city of São Paulo rented cars as a complement to their used car sales activity. The entrance of large international companies into the local market compelled some of them to focus on a nascent industry, full-time car rental, raising the bar of quality services. In the 1970s the companies managed to take loans from leasing companies and could therefore renew their car fleet, which led to an expansion of the market. Through the years until the 1980s, the companies got bigger and spread into the country, reaching important tourist destinations. The franchising of car rental branches was crucial to this expansion. In the ‘90s, Brazil experienced a significant opening of its economy to imported goods and the expansion of its consumer market with the decline of inflation due to the introduction of the Plano Real. Massive imports of cars and other vehicles changed the shape of the car manufacturing industry in the country, fueled by the introduction of the economical popular cars (cheap cars with one-liter engines). In 2004, these cars represented 70% of the car fleet held by rental companies in Brazil, while luxury cars accounted for just 6%, based on data provided by ABLA (the National Association of Car Rental companies). Competitive environment The car rental industry in Brazil is very competitive and less concentrated compared to developed countries. The five largest companies have only 33% of the market in Brazil, as opposed to 59% market share in Europe and 92% in U.S. The local market is very fragmented with close to 1,900 car rental companies, the majority of them comprising very small companies with dozens of cars in their fleet, compared to 43,000 held by Localiza. Most of them (44% of the total) are located in the southeast region, according to ABLA. The reasons for such a fragmented market can be found in the sequential economic crisis and volatile interest rates observed in the late ‘90s, which compressed demand and limited GDP growth, factors that stimulated price competition on the one hand and lowered the quality of services on the other. Accordingly, there are hundreds of companies that can only compete by charging low rental rates and therefore their cash flow generation is not enough to renew their car fleet, leaving them with old cars demanding significant maintenance costs. The improved macroeconomic scenario and real income recovery observed in the past three years have made customers less price-sensitive and shifted demand to higher-quality car rental companies such as Localiza. Since 1981 Localiza has been the market leader in Brazil by number of branches and in 2005 it held 18% of market share in the country, according to ABLA. Hertz, Unidas (owned by the Portuguese SAG group) and Avis (run by a master franchisee of Avis Europe) are Localiza’s major competitors, but they have lower scale and smaller footprint. The companies have become bigger and have increased their relevance to the Brazilian car manufacturing industry. For instance, in 2000, the size of the total fleet in the car rental industry was equivalent to 5.5% of all the cars manufactured and that increased to 11.3% in 2004.
  • 11. 30 October 2006 Transport Localiza Deutsche Bank AG/London Page 11 Figure 6: Car Rental Industry, Branch network in Brazil (September 2006) 267 84 83 74 66 42 25 20 15 11 0 50 100 150 200 250 300 Localiza Hertz Avis Unidas Yes Master Locaralpha Europcar Interlocadora Sixt Source: Deutsche Bank, Company data As in the case of Localiza and its subsidiary Total Fleet, most of the other rental car companies in Brazil also operate in the fleet rental and management businesses, in order to achieve synergies. The largest ones in that segment are Total Fleet, Unidas and Leaseplan. Figure 7: Market-Share In Brazil (Including Fleet Rental Revenues), 2004 others 69% Unidas 7% Localiza 16% Avis 4% Hertz 4% Source: Deutsche Bank, Company data The fast expansion of their businesses and the high profits accumulated attracted the attention of their parent companies. At the end of 2005, Ford sold Hertz in the U.S. to a group of private equity firms, which could be followed by a more aggressive international expansion. In September 2006 Unidas replaced its CEO and issued R$100 million in a private placement aiming to expand car fleet and open new branches. We should also mention the recent entrance of highly capitalized foreign players in the country such as the French ALD Automotive (subsidiary of the Societe Generale group) and Arval (linked to BNP Paribas), which aim to operate in the fleet rental business. Growth is everywhere Despite fierce competition, the car rental industry in Brazil is still in its early stages and enjoys numerous growth opportunities, as opposed to Europe and the U.S where the industry has already reached maturity (companies are struggling due to the impact of September 11 on tourism, and high debt burden). Recently, the Brazilian car rental market has registered more than five times GDP growth, backed by catalysts such as the expansion of tourism activities in the country, increasing passenger traffic in airports, development of the car insurance (replacement) market and the growing trend of fleet outsourcing by corporations. According to ABLA, from 2000 to 2005 the car rental market revenues increased by 12% per year compared to a 2.2% increase in GDP.
  • 12. 30 October 2006 Transport Localiza Page 12 Deutsche Bank AG/London General economic factors, including the expansion in credit card penetration and the improvement in household income among Brazilians, have also contributed to such outstanding industry performance. In the past three years, the number of credit cards in the country increased 18% per year to 68 million. The ownership of a credit card is mandatory for renting cars from Localiza. Airport traffic booming Close to 45% of Localiza’s daily rentals, excluding Total Fleet, are generated in airports, where not only tourists but also businessmen arrive and demand car services. The company is present in more than 70 airports in Brazil, including the busiest ones such as Congonhas and Guarulhos in São Paulo, and Santos Dumont and Galeão in Rio de Janeiro. The concessions for car rental companies are granted by Infraero (Federal Agency Airport Administration) for federal airports, and by the state and municipal authorities with regard to state and municipal airports. The concessions usually last from five to 15 years and are subject to new bidding after expiration. Localiza has renewed its concessions in the major and strategic airports for its business. In the last five years Brazil has experienced a boom in passenger traffic in airports due to a combination of factors on the demand side (real income recovery and expansion in credit alternatives) and from supply (promotions, aggressive marketing, modernization of aircraft, reforms in the airports, etc.). Data from Infraero shows that the flow of passengers in local airports has increased at an average annual rate of 7% from 2000 to 2005, more than 3.0 times the GDP growth in the period. Figure 8: Passenger Flow In Brazilian Airports (million) 68 74 75 71 83 96 40 50 60 70 80 90 100 2000 2001 2002 2003 2004 2005 Source: Deutsche Bank, Company data Consolidation trend Localiza’s strategy is to consolidate the sector not through acquisitions but through aggressive pricing, deep pockets and geographical expansion. It has been using its highly capitalized structure, easy access to capital markets and strong refinancing capabilities to constantly renovate its car fleet. The consolidation is also aided by Localiza’s strategy in the corporate segment where it negotiates short-term rentals with corporations (the so-called “mini-lease” contracts), which usually rent cars for a few months. The company charges them competitive rental rates without affecting margins as cars remain rented for long periods of time, which raises utilization rate of fleet, dilutes fixed costs and maximizes the use of its assets. Rental rates in the car rental unit have dropped in the past few years in nominal terms as a consequence of the market-share expansion in the corporate segment.
  • 13. 30 October 2006 Transport Localiza Deutsche Bank AG/London Page 13 Figure 9: Evolution Of Car Rental Companies In Brazil 2,451 2,511 2,340 1,985 1,964 1,000 1,400 1,800 2,200 2,600 3,000 2001 2002 2003 2004 2005 Source: Deutsche Bank, ABLA According to management, acquisitions do not necessarily add to growth as Localiza is already present in the premium locations in the country; so acquiring branches would not be complementary. The acquisition of branches would apparently increase its market share in the airports but because of regulatory concerns Localiza would have to return the acquired slots for new bidding processes (no car rental player can have two slots in any airport in Brazil). Furthermore, given that Localiza purchases new cars at substantial discounts, the company has no interest in acquiring the car fleet held by competitors. In view of the informal characteristics of most car rental companies, their small size, lower quality car fleet and inability to raise capital, we believe Localiza should continue to consolidate the market and expand market-share in Brazil. Replacement market on the rise The replacement market of insured cars and automakers is a fast-growing niche for car rental companies in Brazil. Insurance companies are becoming more professional and broadening the range of products while improving the quality of services. Recently, more companies have addressed the car insurance market by offering an emergency car to those drivers who have suffered accidents and have had their cars impaired. According to management, given that 16.5% of the 9.2 million insured cars in Brazil crash or are stolen every year and taking into account that the average period for repairing a car is seven days, we calculate that the replacement market in Brazil for car rentals reaches 10.6 million daily rentals. The current market is still 1.0 million rentals as large insurance companies do not yet offer emergency cars to their clients. Localiza has approximately 30% of the replacement market, and based on our estimates, we think that the recent decision of Bradesco to offer the extra car in new insurance contracts and the potential entrance of other large car insurers could rapidly raise that market to 3 million daily rentals by mid-2007. Localiza could earn 600,000 additional car rentals in the next year if we conservatively maintain its market share (please refer to Figure 10). If the company maintains its car fleet, the impact on the utilization rate would be an increase of 800 bps. The replacement market of car rentals is also growing due to the demand from automakers. Car manufacturers have increasingly offered an extra car to their customers as part of special warranties clauses, which is a direct effect of higher competition in the industry and improved professional standards.
  • 14. 30 October 2006 Transport Localiza Page 14 Deutsche Bank AG/London Figure 10: Localiza – Impact Of Bradesco Seguros On The Replacement Market* Status quo Bradesco entrance Current market 1,000 Additional market 2,000 Localiza's share 30% Localiza's share 30% Localiza's rentals 300 Localiza's rentals 900 Total rentals 2007E 6,421 Total rentals 2007E 7,021 % of the total 5% % of the total 13% YoY growth 35% YoY growth 48% Utilization rate 70% Utilization rate 78% Source: Deutsche Bank *000’s rentals
  • 15. 30 October 2006 Transport Localiza Deutsche Bank AG/London Page 15 Valuation and rating DCF valuation Our 2007 year-end price target of R$74.20 was derived from a DCF valuation. Given its attractive upside potential of 47% (plus dividend yield) versus the 10% threshold in DB’s rating criteria and the favorable peer multiple comparison, we are initiating coverage on Localiza with a Buy rating. Our DCF valuation is based on a WACC of 10.9% as the discount rate for the FCFFs (free cash flows to firm), a risk-free rate of 8%, a sovereign risk spread of 300 bps and a cost of debt of 13.0% (103% of the CDI expected for 2007). We used a 4% perpetuity growth rate. Figure 11: Price target Sensitivity With Discount Rate And Perpetuity Growth WACCg 2.0% 3.0% 4.0% 5.0% 6.0% 9.9% 70.73 78.85 89.73 105.07 128.30 10.4% 65.37 72.27 81.33 93.75 111.84 10.9% 60.64 66.55 74.17 84.38 98.78 11.4% 56.43 61.53 68.00 76.51 88.17 11.9% 52.67 57.09 62.64 69.80 79.39 Source: Deutsche Bank Peer valuation Localiza is the only car rental company listed in Latin America. We believe that its business model and earnings drivers are similar to other transportation players in Latin America which enjoy high GDP leverage and strong elasticity to real income and consumption growth. Therefore, we compared its trading multiples with companies in the transportation sector in our universe of coverage in Latin America. Considering their differences in growth prospects and industry stages, it is important to factor earnings growth into the valuation comps. Accordingly, we believe Localiza deserves superior valuations to account for its higher earnings and EBITDA growth anticipated for the next three years. Figure 12: Valuation Comparison In Latam Transportation Market Cap EV/EBITDA P/E EPS CAGR PEG Company Name Ticker Target Price Close Price USD Upside 2006 2007 2006 2007 07-10E ratio Gol GOL.N 35.20 31.45 6,210.6 12% 10.1 7.1 14.4 11.9 15% 0.81 TAM TAM.N 34.80 31.19 4,683.0 12% 8.7 6.5 12.4 10.5 16% 0.68 ASUR ASR.N 42.00 39.25 1,182.8 7% 9.3 8.1 25.3 19.3 23% 0.86 CCR CCRO3.SA 20.00 22.46 4,234.6 -11% 8.3 7.4 18.5 15.3 18% 0.83 Localiza RENT3.SA 74.20 50.50 1,588.1 47% 10.8 7.3 22.0 14.2 29% 0.49 Source: Deutsche Bank estimates
  • 16. 30 October 2006 Transport Localiza Page 16 Deutsche Bank AG/London Risks Notable risks to our investment thesis are: The strong competitive environment: This requires aggressive marketing efforts and subsidized rental rates, which could depress margins and hold back price increases. The recent arrival of large foreign players in the fleet rental business or a more aggressive stance by international competitors in the local market could translate into lower profitability levels. Macroeconomic risks: Potential increases in interest rates and/or GDP contraction could affect the demand for car rentals and increase Localiza’s cost of funding. If the Brazilian economy slows down followed by lower consumer confidence then demand for car rentals would fall, affecting the industry. In addition, since most of the company’s debt is denominated in local currency and exposed to floating rates, an eventual increase in interest rates would intensify Localiza’s debt burden and reduce earnings growth. Risks of contract termination by customers of the fleet rental unit: Since Total Fleet has a high client concentration, one or a few of its clients could choose to terminate their contracts. Although Total Fleet would likely collect fines on amounts due, it might not be able to replace them with new customers and therefore end up registering lower rentals, revenues and lower utilization rates. Potential declines in the passenger flow in airports: The branches located in airports account for approximately 45% of the revenues in the car rental unit. GDP contraction, terrorism, etc. could impair the demand for flights in Brazil and therefore reduce the flow of people in the airports, which in turn would lower the amount of Localiza rentals in the airports. Potential declines in the prices of used cars in the secondary market: Localiza, through its subsidiary Seminovos, relies on the secondary market of used cars to sell its fleet and therefore recover the cash spent on car acquisition, an ongoing activity. If the prices of used cars fall below Localiza’s estimates, then it would raise less cash than anticipated and would not have enough cash to fund the purchases of new cars. As a result, consolidated free cash flow would deteriorate.
  • 17. 30 October 2006 Transport Localiza Deutsche Bank AG/London Page 17 Earnings outlook Accounting issues As previously mentioned, the car rental industry is capital-intensive and is characterized by large working capital requirements, particularly in the purchase of new cars. Localiza has frequently raised debt to fund its operations, as operating free cash flow has been negative several times in the past. In U.S. GAAP, on which we base our estimates, the car fleet is neither treated as inventories nor as fixed assets, but is accounted as short- and long-term assets instead. Given the high liquidity of these assets, we opted to build our model considering them as part of the regular working capital, backed by the fact that they are constantly sold in order to raise proceeds to fund the purchase of new cars. The investment in fleet renewal is significant and consumes most of the EBITDA generated by the company. From a cash flow perspective, it is worth pointing out that 70% of consolidated costs are a non-cash item (the depreciated book value of the used cars). Accordingly, when calculating free cash flow one has to add back the costs associated with car sales to the EBITDA when subtracting it from the capital expenditure for car fleet expansion. The same rationale is applied to margin analysis, i.e., margin analysis for Localiza is only meaningful on a unit per unit basis given the accounting issues of buying and selling cars by Seminovos, which distorts the figures regardless of the efficiency of the car rental operation. Figure 13: Localiza – Breakdown Of COGS (2005A) Franchising 1% Fleet rental 7% Rental costs 19% Depreciated used cars 69% Taxes on sales 4% Source: Deutsche Bank, Company data Earnings scenario We estimate that the company will continue to enjoy high and sustainable earnings growth in the next three years given the favorable industry outlook, its competitive advantages (management, scale and brand) and growth drivers. Our CAGRs for net revenues, EBITDA and EPS for the 2006-2009 period are 28%, 31% and 39%, respectively, in local currency terms. These growth rates compare favorably to anticipated earnings growth for the transportation companies in our universe of coverage:
  • 18. 30 October 2006 Transport Localiza Page 18 Deutsche Bank AG/London Figure 14: Operating Statistics In Latam Transportation (US$) Sales EBITDA EPS EBITDA margin % ROE% Company Name Ticker CAGR 05-08E CAGR 05-08E CAGR 05-08E 2006E 2007E 2008E 2006E 2007E 2008E Gol GOL.N 43% 55% 42% 29.6 29.8 31.5 39.3 31.4 26.2 TAM TAM.N 22% 37% 39% 18.5 19.9 20.5 77.8 49.0 38.0 ASUR ASR.N 13% 12% 17% 56.9 56.3 59.7 3.9 5.0 6.4 CCR CCRO3.SA 13% 17% 16% 57.5 59.5 60.5 40.7 47.2 51.4 Average 23% 30% 28% 40.6 41.4 43.0 40.4 33.1 30.5 Localiza RENT3.SA 33% 33% 46% 30.0 31.8 32.1 31.4 30.6 33.2 Source: Deutsche Bank estimates Our earnings outlook for Localiza starts with the forecast of daily rentals, for both the car rental and the fleet rental units, bearing in mind the elasticity between the growth in rentals to GDP and the favorable prospects for the sector we highlighted in the “Industry outlook” section. High leverage to GDP We think that Localiza’s car rental unit will continue to increase rentals by 7-9 times the GDP growth expected for the next three years while the fleet rental division generates growth at 3-5 times the rate of GDP. We then estimate the utilization rate of car fleet, raising it from 66% in 2006 (100 bps above current guidance) to 70% in 2007 and 72% thereafter for Localiza while maintaining a stable 97% utilization rate for Total Fleet. Therefore, we calculate the amount of cars required every year to generate these daily rentals which in turn lead to the annual investment in car fleet (working capital needs). We believe in higher future utilization rates, as in the past Localiza has reported abnormally low rates due to non-recurring events (the flex fuel car boom in Brazil and substantial new launches from automakers) which made it very attractive for Localiza to purchase new cars. The demand for car rentals collapsed in 2003 due to the Brazilian economic crisis and hike in interest rates, reducing the utilization rate versus 2002. Figure 15: Localiza – Car Fleet Evolution Figure 16: Net Investment In Car Purchases (R$ million) 58.8% 66.0% 72.0%72.0%72.0% 70.0% 60.6% 62.9% 67.4% 0 10,000 20,000 30,000 40,000 50,000 60,000 2002 2003 2004 2005 2006E 2007E 2008E 2009E 2010E 40% 45% 50% 55% 60% 65% 70% 75% Fleet evolution (eop) Utilization rate 0 50 100 150 200 250 300 350 400 2002 2003 2004 2005 2006E 2007E 2008E 2009E 2010E Source: Deutsche Bank, Company data Source: Deutsche Bank, Company data In our scenario we welcomed management’s strategy to increase the utilization rate as it is crucial, in our view, to free cash flow generation and higher asset utilization. We justify our assumptions based on recent conversations with management and conference call guidance, pointing to 1) an expansion of the used car sales store chain to increase Seminovos’ capacity to sell cars and 2) the opening of more branches in the countryside leading to higher efficiency in moving cars from branch to branch and renting them in locations with heated demand. We assume that Localiza will completely renew its car fleet every year keeping the average age of the cars at six months.
  • 19. 30 October 2006 Transport Localiza Deutsche Bank AG/London Page 19 Localiza’s capital expenditure in PP&E is very low and represents roughly 6% of EBITDA, consisting of the opening of branches, revamping existing ones, improving IT systems and the opening of used car stores. For the car rental business we estimate a total of 4.85 million daily rentals for 2006 and 6.43 million for 2007, which imply annual growth rates of 42% and 32%, respectively, for Localiza. With regard to Total Fleet we estimate 27% and 18% growth in rentals for 2006 and 2007, reaching 4.25 million rentals and 5.02 million rentals, respectively. In our earnings scenario used car sales will represent 52% of consolidated net sales in 2009 versus 49% in 2006. Figure 17: Localiza – Daily Rentals Evolution (000s) Figure 18: Localiza – Net Revenues Evolution (R$ Mn) 0 200 400 600 800 1,000 1,200 1,400 1,600 2003 2004 2005 2006E 2007E 2008E 2009E 2010E Car rental Fleet rental Used car sales Source: Deutsche Bank estimates, Company data Source: Deutsche Bank estimates, Company data Figure 19: Localiza – EBITDA (R$ million) And EBITDA Margin (%) 31.8%30.0% 28.6% 33.1% 32.6% 32.1% 32.0% 32.4% 0 100 200 300 400 500 600 700 800 900 1,000 2003 2004 2005 2006E 2007E 2008E 2009E 2010E 0% 5% 10% 15% 20% 25% 30% 35% 40% EBITDA EBITDA margin Source: Deutsche Bank estimates, Company data 0 2,500 5,000 7,500 10,000 12,500 15,000 17,500 20,000 2002 2003 2004 2005 2006E 2007E 2008E 2009E 2010E Localiza Total Fleet CAGR = 11%
  • 20. 30 October 2006 Transport Localiza Page 20 Deutsche Bank AG/London Figure 20: Localiza – Revenue Model (R$ million) 2005 2006E 2007E 2008E 2009E 2010E Car Rental 271.3 371.2 493.8 636.6 773.0 937.0 Rental rate (R$) 79.52 76.70 76.81 79.55 82.20 84.81 % change -3% -4% 0% 4% 3% 3% Daily rentals (000's) 3,411.4 4,849.6 6,420.9 7,994.0 9,392.9 11,036.7 % YoY change 41% 42% 32% 25% 18% 18% Fleet Rental 149.2 193.3 233.9 284.6 324.9 370.4 Rental rate (R$) 44.28 45.44 46.58 48.24 49.85 51.44 % change -2% 3% 3% 4% 3% 3% Daily rentals (000's) 3,350.8 4,252.2 5,017.6 5,895.7 6,514.7 7,198.7 % YoY change 19% 27% 18% 18% 11% 11% Fleet management - - - - - - Car Sales - Localiza 369.9 410.1 633.1 814.3 1015.3 1233.2 Average price (R$ 000's) 23.05 25.37 27.02 27.94 28.86 29.75 % change 18% 10% 7% 3% 3% 3% Cars sold 15,691 16,148 23,231 28,900 34,886 41,103 % change 47% 3% 44% 24% 21% 18% Financial spread - - 5.4 6.9 8.5 10.2 Car Sales - Fleet 78.3 128.2 146.5 181.8 207.4 235.9 Average price (R$ 000's) 25.17 26.36 28.04 29.00 29.95 30.88 % change 45% 5% 6% 3% 3% 3% Cars sold 3,072 4,839 5,223 6,269 6,923 7,640 % change -39% 58% 8% 20% 10% 10% Franchising 8.2 9.6 13.8 17.8 21.6 26.2 % of car rental rev. 3% 3% 3% 3% 3% 3% Net Revenues 876.9 1,109.6 1,521.1 1,935.1 2,342.2 2,802.8 Source: Deutsche Bank estimates and company data Given the sharp reduction in average rental rates in the past three years (motivated by product mix changes, market-share expansion and competitive pressures), we believe nominal rates are close to reaching their trough. We thus estimate that Localiza will pass inflation through to rental rates starting in 2007. We estimate Localiza to report a 2006-09E CAGR of 28% in consolidated net sales in local currency. However, we forecast an EBITDA CAGR of 31% over this period, via rising margins stemming not only from higher economies of scale but also in particular from more profitable used car sales, which had atypical low EBITDA margins in the 1H06. Business model sensitivity Localiza’s earnings, margins and cash flow are sensitive to the changes in the prices of used cars, the utilization rate of fleet and local interest rates (cost of debt). Seminovos has a low and volatile EBITDA margin because of the swings in the used car market in Brazil. Depending on the launches by automakers, the exchange rate and inflation, prices of used cars vary significantly. The low margin stems from the fact that used cars have a low residual value after one year of usage due to decelerating depreciation rates (the higher decline in value happens right after the purchase of a new car). Seminovos’ EBITDA margins vary from 0% to 10% and can significantly affect consolidated margins depending on the quantity of cars sold in a given period, which distorts the analysis of the company’s core business margins (car rental operations).
  • 21. 30 October 2006 Transport Localiza Deutsche Bank AG/London Page 21 The utilization rate of Localiza’s car fleet, or asset utilization, is in our opinion key for the maximization of value to shareholders. If demand for car rentals is correctly estimated the company will then renovate its car fleet sufficiently to increase rentals minimizing working capital investment. However, if it overestimates demand, it will buy more cars than it needs, leaving cars stuck in the branches without being rented. As a result, the utilization rate would decline, assets would be impaired and operating cash flow consumed with unnecessary car purchases. Maximizing utilization rate, maximizing value to shareholders In Figure 21, we can see that Localiza maximizes value when it maximizes the utilization rate of fleet (keeping the fleet age constant, i.e, fleet turnover is unchanged). Since most of the consolidated EBITDA is generated by the car rental unit, or from the sale of daily rentals, the higher the utilization rate the more rents are sold. It is important to mention that utilization rate has a cap, which is approximately 80% to 85%, higher than which some branches will not have cars for their customers, leading to quality deterioration. One could think that cash generation is also maximized through the minimization of investments in car acquisition, i.e., reducing fleet turnover while maintaining the same utilization rate of fleet. However, we believe this would be dangerous for the overall business. Although working capital investment would fall, the age of fleet would increase, leading to higher maintenance cost, lower quality of services, brand erosion and business model weakness. Figure 21: Sensitivity Of Price Target And Utilization Rate Scenarios (R$) Utilization rate Age (months) PT 55% 6.0 $ 49.40 60% 6.0 $ 58.16 65% 6.0 $ 65.60 70% 6.0 $ 71.90 75% 6.0 $ 77.40 80% 6.0 $ 82.24 Source: Deutsche Bank estimates Changes in interest rates are also crucial for Localiza’s business model. Most of the car purchases are funded by short- and long-term local currency loans denominated in floating rates (CDI), while recently, we acknowledge, the company has raised capital in the form of equity increase. A large part of the company’s cash flow in 2004 and 2005 was financed by debt increase which raised financial expenses and limited earnings growth. The sequential cuts in interest rates by the Brazilian Central Bank have limited the financial burden for Localiza but we cannot rule out the possibility of future turmoil in the economy leading to interest rate hikes and lack of funding alternatives.
  • 22. 30 October 2006 Transport Localiza Page 22 Deutsche Bank AG/London Figure 22: Localiza – Income Statement (R$ million) 2004 2005 2006E 2007E 2008E 2009E 2010E Net revenues 634.5 876.9 1,109.6 1,521.1 1,935.1 2,342.2 2,802.8 Cost of Goods Sold 364.0 511.3 673.4 916.1 1,159.6 1,404.8 1,669.8 Gross Profit 270.4 365.6 436.2 604.9 775.6 937.4 1,133.0 Gross Margin 42.6% 41.7% 39.3% 39.8% 40.1% 40.0% 40.4% Total Operating Expenses 96.2 130.6 160.7 209.7 257.1 311.2 371.9 Sales Expenses 52.7 66.6 78.0 91.3 116.1 140.5 168.2 Administrative Expenses 20.2 21.0 24.8 30.4 38.7 46.8 56.1 Other Operating Expenses 23.4 43.0 57.9 88.0 102.3 123.8 147.7 Operating Income 174.2 235.0 275.4 395.3 518.5 626.2 761.1 Operating Margin 27.5% 26.8% 24.8% 26.0% 26.8% 26.7% 27.2% Depreciation and Amortization 23.4 43.0 57.9 88.0 102.3 123.8 147.7 EBITDA 197.6 285.8 333.4 483.3 620.8 750.0 908.8 EBITDA Margin 31.1% 32.6% 30.0% 31.8% 32.1% 32.0% 32.4% Provisions Net Financial Income (43.0) (84.4) (61.7) (63.7) (53.8) (56.2) (54.2) Financial Income - 56.0 22.6 16.1 39.1 28.7 22.4 Financial Expenses 43.0 140.4 84.3 79.8 93.0 84.8 76.6 Equity Income - - - - - - - Non-recurrent 0.2 0.2 0.0 - - - - Goodwill Amortization - Pre-Tax Income 131.4 150.8 213.7 331.6 464.7 570.1 706.9 Pre-Tax Margin 20.7% 17.2% 19.3% 21.8% 24.0% 24.3% 25.2% Income Taxes (40.7) (44.2) (59.3) (92.8) (130.1) (159.6) (197.9) Social Contribution - Majority Net Income 90.7 106.6 154.5 238.7 334.6 410.5 509.0 Participations (0.1) (0.1) Others - - (0.2) (0.3) (0.4) (0.7) (1.1) Net Income 90.6 106.5 154.3 238.5 334.1 409.8 507.9 Net Margin 14.3% 12.1% 13.9% 15.7% 17.3% 17.5% 18.1% EPS 1.47 1.68 2.29 3.55 4.97 6.09 7.55 Source: Deutsche Bank estimates and company data
  • 23. 30 October 2006 Transport Localiza Deutsche Bank AG/London Page 23 Figure 23: Localiza – Balance Sheet (R$ million) 2004 2005 2006E 2007E 2008E 2009E 2010E Cash and Equiv. 129.3 70.8 23.3 443.2 339.2 296.4 273.1 ST Vehicles 467.8 705.7 897.4 940.1 1,143.3 1,367.2 1,629.1 Accounts receivable 54.8 93.3 127.3 161.6 205.5 248.5 297.4 Other Current Assets 5.4 17.6 28.4 29.6 30.7 31.8 32.9 Current Assets 657.3 887.4 1,076.5 1,574.5 1,718.7 1,944.0 2,232.6 LT Vehicles 144.4 194.5 299.1 313.4 381.1 455.7 543.0 Gross PPE 24.0 50.2 85.0 115.3 145.9 176.6 207.2 Accumulated Depreciation - - 21.1 35.5 54.5 77.8 105.6 Net Fixed Assets 24.0 50.2 63.9 79.8 91.4 98.7 101.6 Other LT Assets 37.9 37.4 44.5 46.0 47.6 49.0 50.5 Total Assets 863.6 1,169.5 1,484.0 2,013.6 2,238.9 2,547.5 2,927.7 Short-term debt 343.5 116.9 158.8 263.8 263.8 263.8 263.8 Suppliers 58.8 39.4 123.1 135.2 130.5 158.4 191.9 Other Current Liabilities 104.0 65.7 90.0 109.4 132.9 161.6 196.4 Current Liabilities 506.3 221.9 371.9 508.3 527.2 583.8 652.1 Long term debt 3.0 493.3 370.5 615.5 615.5 615.5 615.5 Deferred Taxes 5.7 - - - - - - Other LT Liabilities 55.1 59.6 91.4 95.0 98.8 102.2 105.8 LT Liabilities 63.7 552.9 461.9 710.5 714.3 717.7 721.3 Minority Interest 0.2 0.3 0.2 0.5 0.9 1.6 2.7 Shareholders Equity 293.4 394.5 650.0 794.3 996.4 1,244.3 1,551.6 Total Liabilities and Equity 863.6 1,169.5 1,484.0 2,013.6 2,238.9 2,547.5 2,927.7 Source: Deutsche Bank estimates and company data Figure 24: Localiza – Cash Flow Statement (R$ million) 2004 2005 2006E 2007E 2008E 2009E 2010E EBITDA 197.6 285.8 333.4 483.3 620.8 750.0 908.8 (-) Change in working capital (267.6) (396.2) (235.5) (132.3) (378.2) (384.5) (448.7) (-) CAPEX (14.2) (28.0) (28.6) (30.3) (30.6) (30.6) (30.6) (-) Taxes (27.8) (44.2) (59.3) (92.8) (130.1) (159.6) (197.9) FREE CASH FLOW TO FIRM (112.1) (182.6) 9.9 227.8 81.8 175.2 231.5 (-) Net financial expenses (24.2) (92.3) (58.2) (63.7) (53.8) (56.2) (54.2) (+) Increase in debt 159.2 217.0 (88.4) 350.0 - - - FREE CASH FLOW TO EQUITY 23.0 (57.9) (136.6) 514.1 28.0 119.1 177.3 (+) Subscription 16.0 15.4 150.1 - - - - (-) Dividends (68.9) (16.0) (60.9) (94.2) (132.0) (161.9) (200.6) CHANGE IN CASH POSITION (29.8) (58.6) (47.5) 419.9 (104.0) (42.8) (23.3) Cash and equivalents 129.3 70.8 23.3 443.2 339.2 296.4 273.1 Source: Deutsche Bank estimates and company data Mismatches between current share prices, our ratings, and DB's rating structure At current levels, based on our existing 12-month price targets, two stocks mentioned in this report have total return potential that falls outside the definitions of Deutsche Bank's Buy, Hold, and Sell ratings. We cite the following reasons: GOL: Total return potential is >10%, a mismatch with our Hold rating. We note high volatility (three-month trading range of 21%). CCR: Total return potential is <-10%, a mismatch with our Hold rating. We note high volatility (three-month trading range of 21%).
  • 24. 30 October 2006 Transport Localiza Page 24 Deutsche Bank AG/London Appendix 1 Important Disclosures Additional information available upon request Disclosure checklist Company Ticker Recent price* Disclosure Localiza RENT3.SA 50.50 (BRL) 26 Oct 06 6 Gol GOL.N 31.69 (USD) 26 Oct 06 2,6 TAM TAM.N 30.95 (USD) 26 Oct 06 6 ASUR ASR.N 39.18 (USD) 26 Oct 06 2 *Prices are sourced from local exchanges via Reuters, Bloomberg and other vendors. Data is sourced from Deutsche Bank and subject companies. Important Disclosures Required by U.S. Regulators Disclosures marked with an asterisk may also be required by at least one jurisdiction in addition to the United States. See “Important Disclosures Required by Non-US Regulators” and Explanatory Notes. 2. Deutsche Bank and/or its affiliate(s) makes a market in securities issued by this company. 6. Deutsche Bank and/or its affiliate(s) owns one percent or more of any class of common equity securities of this company calculated under computational methods required by US law. Important Disclosures Required by Non-U.S. Regulators Please also refer to disclosures in the “Important Disclosures Required by US Regulators” and the Explanatory Notes. 2. Deutsche Bank and/or its affiliate(s) makes a market in securities issued by this company. 6. Deutsche Bank and/or its affiliate(s) owns one percent or more of any class of common equity securities of this company calculated under computational methods required by US law. For disclosures pertaining to recommendations or estimates made on securities other than the primary subject of this research, please see the most recently published company report or visit our global disclosure look-up page on our website at http://gm.db.com. Analyst Certification The views expressed in this report accurately reflect the personal views of the undersigned lead analyst(s) about the subject issuer and the securities of the issuer. In addition, the undersigned lead analyst(s) has not and will not receive any compensation for providing a specific recommendation or view in this report. Bernardo Carneiro
  • 25. 30 October 2006 Transport Localiza Deutsche Bank AG/London Page 25 Historical recommendations and target price: Localiza (RENT3.SA) (as of 10/26/2006) 0.00 10.00 20.00 30.00 40.00 50.00 60.00 May05 Aug05 Nov 05 Feb06 May06 Aug 06 Date SecurityPrice Previous Recommendations Strong Buy Buy Market Perform Underperform Not Rated Suspended Rating Current Recommendations Buy Hold Sell Not Rated Suspended Rating *New Recommendation Structure as of September 9, 2002 Historical recommendations and target price: Gol (GOL.N) (as of 10/27/2006) 5 4 3 2 1 USD- USD5.00 USD10.00 USD15.00 USD20.00 USD25.00 USD30.00 USD35.00 USD40.00 USD45.00 Oct 04 Jan05 Apr 05 Jul 05 Oct 05 Jan 06 Apr 06 Jul 06 Date SecurityPrice Previous Recommendations Strong Buy Buy Market Perform Underperform Not Rated Suspended Rating Current Recommendations Buy Hold Sell Not Rated Suspended Rating *New Recommendation Structure as of September 9, 2002 1. 28/2/2005: Buy, Target Price Change USD36.00 2. 2/11/2005: Buy, Target Price Change USD43.00 3. 2/12/2005: Buy, Target Price Change USD51.30 4. 20/12/2005: Downgrade to Hold, Target Price Change USD25.65 5. 26/4/2006: Hold, Target Price Change USD35.20
  • 26. 30 October 2006 Transport Localiza Page 26 Deutsche Bank AG/London Historical recommendations and target price: TAM (TAM.N) (as of 10/27/2006) 2 1 USD- USD5.00 USD10.00 USD15.00 USD20.00 USD25.00 USD30.00 USD35.00 USD40.00 Mar 06 Jun 06 Sep06 Date SecurityPrice Previous Recommendations Strong Buy Buy Market Perform Underperform Not Rated Suspended Rating Current Recommendations Buy Hold Sell Not Rated Suspended Rating *New Recommendation Structure as of September 9, 2002 1. 10/5/2006: Buy, Target Price Change USD32.14 2. 14/7/2006: Buy, Target Price Change USD34.80 Historical recommendations and target price: ASUR (ASR.N) (as of 10/27/2006) 5 4 3 2 1 USD- USD5.00 USD10.00 USD15.00 USD20.00 USD25.00 USD30.00 USD35.00 USD40.00 USD45.00 Oct 04 Jan05 Apr 05 Jul 05 Oct 05 Jan 06 Apr 06 Jul 06 Date SecurityPrice Previous Recommendations Strong Buy Buy Market Perform Underperform Not Rated Suspended Rating Current Recommendations Buy Hold Sell Not Rated Suspended Rating *New Recommendation Structure as of September 9, 2002 1. 12/1/2005: Buy, Target Price Change USD31.00 2. 21/4/2005: Buy, Target Price Change USD35.00 3. 26/7/2005: Downgrade to Hold, USD35.00 4. 25/10/2005: Hold, Target Price Change USD30.20 5. 6/4/2006: Upgrade to Buy, Target Price Change USD42.00
  • 27. 30 October 2006 Transport Localiza Deutsche Bank AG/London Page 27 Equity rating key Equity rating dispersion and banking relationships Buy: Expected total return (including dividends) of 10% or more over a 12-month period. Hold: Expected total return (including dividends) between - 10% and 10% over a 12-month period. Sell: Expected total return (including dividends) of -10% or worse over a 12-month period. Notes: 1. Published research ratings may occasionally fall outside these definitions, in which case additional disclosure will be included in published research and on our disclosure website (http://gm.db.com); 2. Newly issued research recommendations and target prices always supersede previously published research. 8% 36% 57% 7%14%14% 0 100 200 300 400 Buy Hold Sell Global Universe Companies Covered Cos. w/ Banking Relationship
  • 28. 30 October 2006 Transport Localiza Page 28 Deutsche Bank AG/London Regulatory Disclosures SOLAR Disclosure For select companies, Deutsche Bank equity research analysts may identify shorter-term trade opportunities that are consistent or inconsistent with Deutsche Bank's existing longer term ratings. This information is made available only to Deutsche Bank clients, who may access it through the SOLAR stock list, which can be found at http://gm.db.com Disclosures required by United States laws and regulations See company-specific disclosures above for any of the following disclosures required for covered companies referred to in this report: acting as a financial advisor, manager or co-manager in a pending transaction; 1% or other ownership; compensation for certain services; types of client relationships; managed/comanaged public offerings in prior periods; directorships; market making and/or specialist role. The following are additional required disclosures: Ownership and Material Conflicts of Interest: DBSI prohibits its analysts, persons reporting to analysts and members of their households from owning securities of any company in the analyst's area of coverage. Analyst compensation: Analysts are paid in part based on the profitability of DBSI, which includes investment banking revenues. Analyst as Officer or Director: DBSI policy prohibits its analysts, persons reporting to analysts or members of their households from serving as an officer, director, advisory board member or employee of any company in the analyst's area of coverage. Distribution of ratings: See the distribution of ratings disclosure above. Price Chart: See the price chart, with changes of ratings and price targets in prior periods, above, or, if electronic format or if with respect to multiple companies which are the subject of this report, on the DBSI website at http://gm.db.com. Additional disclosures required under the laws and regulations of jurisdictions other than the United States The following disclosures are those required by the jurisdiction indicated, in addition to those already made pursuant to United States laws and regulations. Analyst compensation: Analysts are paid in part based on the profitability of Deutsche Bank AG and its affiliates, which includes investment banking revenues Australia: This research, and any access to it, is intended only for "wholesale clients" within the meaning of the Australian Corporations Act. EU: A general description of how Deutsche Bank AG identifies and manages conflicts of interest in Europe is contained in our public facing policy for managing conflicts of interest in connection with investment research. Germany: See company-specific disclosures above for (i) any net short position, (ii) any trading positions (iii) holdings of five percent or more of the share capital. In order to prevent or deal with conflicts of interests Deutsche Bank AG has implemented the necessary organisational procedures to comply with legal requirements and regulatory decrees. Adherence to these procedures is monitored by the Compliance-Department. Hong Kong: See http://gm.db.com for company-specific disclosures required under Hong Kong regulations in connection with this research report. Disclosure #5 includes an associate of the research analyst. Disclosure #6, satisfies the disclosure of financial interests for the purposes of paragraph 16.5(a) of the SFC's Code of Conduct (the "Code"). The 1% or more interests is calculated as of the previous month end. Disclosures #7 and #8 combined satisfy the SFC requirement under paragraph 16.5(d) of the Code to disclose an investment banking relationship. Japan: See company-specific disclosures as to any applicable disclosures required by Japanese stock exchanges, the Japanese Securities Dealers Association or the Japanese Securities Finance Company. Russia: The information, interpretation and opinions submitted herein are not in the context of, and do not constitute, any appraisal or evaluation activity requiring a licence in the Russian Federation. South Africa: Publisher: Deutsche Securities (Pty) Ltd, 3 Exchange Square, 87 Maude Street, Sandton, 2196, South Africa. Author: As referred to on the front cover. All rights reserved. When quoting, please cite Deutsche Securities Research as the source.
  • 29. 30 October 2006 Transport Localiza Deutsche Bank AG/London Page 29 Turkey: The information, interpretation and advice submitted herein are not in the context of an investment consultancy service. Investment consultancy services are provided by brokerage firms, portfolio management companies and banks that are not authorized to accept deposits through an investment consultancy agreement to be entered into such corporations and their clients. The interpretation and advices herein are submitted on the basis of personal opinion of the relevant interpreters and consultants. Such opinion may not fit your financial situation and your profit/risk preferences. Accordingly, investment decisions solely based on the information herein may not result in expected outcomes. United Kingdom: Persons who would be categorized as private customers in the United Kingdom, as such term is defined in the rules of the Financial Services Authority, should read this research in conjunction with prior Deutsche Bank AG research on the companies which are the subject of this research.
  • 30. 30 October 2006 Transport Localiza Page 30 Deutsche Bank AG/London
  • 31. 30 October 2006 Transport Localiza Deutsche Bank AG/London Page 31
  • 32. Global Disclaimer The information and opinions in this report were prepared by Deutsche Bank AG or one of its affiliates (collectively “Deutsche Bank”). The information herein is believed by Deutsche Bank to be reliable and has been obtained from public sources believed to be reliable. With the exception of information about Deutsche Bank, Deutsche Bank makes no representation as to the accuracy or completeness of such information. This published research report may be considered by Deutsche Bank when Deutsche Bank is deciding to buy or sell proprietary positions in the securities mentioned in this report. For select companies, Deutsche Bank equity research analysts may identify shorter-term opportunities that are consistent or inconsistent with Deutsche Bank's existing, longer-term Buy or Sell recommendations. This information is made available on the SOLAR stock list, which can be found at http://gm.db.com. Deutsche Bank may trade for its own account as a result of the short term trading suggestions of analysts and may also engage in securities transactions in a manner inconsistent with this research report and with respect to securities covered by this report, will sell to or buy from customers on a principal basis. Disclosures of conflicts of interest, if any, are discussed at the end of the text of this report or on the Deutsche Bank website at http://gm.db.com. Opinions, estimates and projections in this report constitute the current judgement of the author as of the date of this report. They do not necessarily reflect the opinions of Deutsche Bank and are subject to change without notice. Deutsche Bank has no obligation to update, modify or amend this report or to otherwise notify a reader thereof in the event that any matter stated herein, or any opinion, projection, forecast or estimate set forth herein, changes or subsequently becomes inaccurate, except if research on the subject company is withdrawn. Prices and availability of financial instruments also are subject to change without notice. This report is provided for informational purposes only. It is not to be construed as an offer to buy or sell or a solicitation of an offer to buy or sell any financial instruments or to participate in any particular trading strategy in any jurisdiction or as an advertisement of any financial instruments. The financial instruments discussed in this report may not be suitable for all investors and investors must make their own investment decisions using their own independent advisors as they believe necessary and based upon their specific financial situations and investment objectives. If a financial instrument is denominated in a currency other than an investor’s currency, a change in exchange rates may adversely affect the price or value of, or the income derived from, the financial instrument, and such investor effectively assumes currency risk. In addition, income from an investment may fluctuate and the price or value of financial instruments described in this report, either directly or indirectly, may rise or fall. Furthermore, past performance is not necessarily indicative of future results. Unless governing law provides otherwise, all transactions should be executed through the Deutsche Bank entity in the investor’s home jurisdiction . In the U.S. this report is approved and/or distributed by Deutsche Bank Securities Inc., a member of the NYSE, the NASD, NFA and SIPC. In Germany this report is approved and/or communicated by Deutsche Bank AG Frankfurt authorised by Bundesanstalt für Finanzdienstleistungsaufsicht. In the United Kingdom this report is approved and/or communicated by Deutsche Bank AG London, a member of the London Stock Exchange and regulated by the Financial Services Authority for the conduct of investment business in the UK and authorised by Bundesanstalt für Finanzdienstleistungsaufsicht (BaFin). This report is distributed in Hong Kong by Deutsche Bank AG, Hong Kong Branch, in Korea by Deutsche Securities Korea Co. and in Singapore by Deutsche Bank AG, Singapore Branch. In Japan this report is approved and/or distributed by Deutsche Securities Inc. The information contained in this report does not constitute the provision of investment advice. In Australia, retail clients should obtain a copy of a Product Disclosure Statement (PDS) relating to any financial product referred to in this report and consider the PDS before making any decision about whether to acquire the product. Deutsche Bank AG Johannesburg is incorporated in the Federal Republic of Germany (Branch Register Number in South Africa: 1998/003298/10) Additional information relative to securities, other financial products or issuers discussed in this report is available upon request. This report may not be reproduced, distributed or published by any person for any purpose without Deutsche Bank's prior written consent. Please cite source when quoting. Copyright © 2006 Deutsche Bank AG 06/2006 GRCM2006PROD008802 Deutsche Bank AG/London International locations Deutsche Bank Securities Inc. 60 Wall Street New York, NY 10005 United States of America Tel: (1) 212 250 2500 Deutsche Bank AG London 1 Great Winchester Street London EC2N 2EQ United Kingdom Tel: (44) 20 7545 8000 Fax: (44) 20 7545 6155 Deutsche Bank AG Große Gallusstraße 10-14 60272 Frankfurt am Main Germany Tel: (49) 69 910 41339 Deutsche Bank AG Deutsche Bank Place Level 16 Corner of Hunter & Phillip Streets Sydney, NSW 2000 Australia Tel: (61) 2 8258 1234 Fax: (61) 2 8258 1400 Deutsche Bank AG Level 55 Cheung Kong Center 2 Queen’s Road Central Hong Kong Tel: (852) 2203 8888 Fax: (852) 2203 6921 Deutsche Securities Inc. Level 20, 2-11-1 Nagatacho Sanno Park Tower Chiyoda-ku, Tokyo 100-6171 Japan Tel: (81) 3 5156 6701 Fax: (81) 3 5156 6700